Kingdom of Norway
| |
|---|---|
| Motto: Enige og tro inntil Dovre faller (Bokmål) Einige og tru inntil Dovre fell (Nynorsk) "United and loyal until Dovre falls" | |
Anthem:
| |
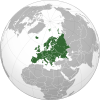
.svg)  Location of the Kingdom of Norway in Europe (green and dark grey) | |
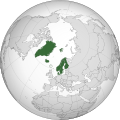
_cropped.svg) Location of the Kingdom of Norway and its integral overseas areas and dependencies: Svalbard, Jan Mayen, Bouvet Island, Peter I Island, and Queen Maud Land | |
| Capital and largest city | Oslo 59°56′N 10°41′E / 59.933°N 10.683°E |
| Official languages | |
| Official minority languages | |
| Writing system | Latin |
| Ethnic groups |
Indigenous status: Minority status:[4] |
| Demonym(s) | Norwegian |
| Government | Unitary parliamentary constitutional monarchy |
• Monarch | Harald V |
| Erna Solberg | |
| Tone W. Trøen | |
| Toril Marie Øie | |
| Conservative | |
| Legislature | Stortinget L Sámediggi |
| History | |
| 872 | |
• Old Kingdom of Norway (Peak extent) | 1263 |
| 1397 | |
| 1524 | |
| 25 February 1814 | |
| 17 May 1814 | |
| 4 November 1814 | |
| 7 June 1905 | |
| Area | |
• Total | 385,207 km2 (148,729 sq mi)[6] (67tha) |
• Water (%) | 5.7b |
| Population | |
• 2019 estimate | |
• Density | 13.8/km2 (35.7/sq mi) (213th) |
| GDP (PPP) | 2018 estimate |
• Total | $397 billion[8] (46th) |
• Per capita | $74,065[8] (4th) |
| GDP (nominal) | 2018 estimate |
• Total | $443 billion[8] (22nd) |
• Per capita | $82,711[8] (3rd) |
| Gini (2017) | low (1st) |
| HDI (2017) | very high (1st) |
| Currency | Norwegian krone (NOK) |
| Time zone | UTC+1 (CET) |
• Summer (DST) | UTC+2 (CEST) |
| Date format | dd.mm.yyyy |
| Driving side | right |
| Calling code | +47 |
| ISO 3166 code | NO |
| Internet TLD | .noc |
| |


Poverty in Norway edit
Norway, officially known as the Kingdom of Norway, one of the members of the European Economic Area. Norway is the fifth largest oil exporter in the world and is considered one of the richest countries in Europe. However, poverty is still a significant problem in Norway. Compared to other countries in the European Union, Norway is considered a relatively rural country. Only half of the population lives in towns with more than 8,000 inhabitants. Living conditions are said to be a problem for the poor. Overcrowded living conditions lead to the economic difficulties of the city. This article would describe poverty in Norway in three sections which are the poverty concept, the lifestyle of the Norwegian and the main politics of poverty in Norway including employment and education.
The poverty concepts edit
Literally, income poverty is the economic situation that an individual or family is considered to be poor when the standard living conditions are below the poverty line. The concept of poverty here is not only a purely financial problem but also the broader aspect like the way of life including social activity and spiritual satisfaction. Income provides a poverty line that promotes cross-country comparisons so that it is regarded as a common poverty indicator for EU member states. And the extreme poverty represents the living conditions with a daily income less than $1.9. The poverty line can define household income and poverty levels in individual countries. According to the definition of the European Union, about 10% of Norwegians were considered to be below the relative poverty line two years before the 2006 recession. And the recent studies have shown that socio-economic inequalities in Norway continue to increase. Inequality is due to the current richest government's 5% of the richest, the people have carried out extensive tax cuts [11].
The lifestyle of the Norwegian edit
According to the development assistance committee, Norway is one of the staunch supporters of the Copenhagen 20/20 initiative, advising donor to spend 20% of their official development assistance on basic social services, and the recipient countries were encouraged by this proposal to allocate one part of their national budget to basic social services. In addition, giving birth to a child, for instance, the government distributes subsidy more than ten thousands krone, rising a child, the government gives out milk fee around 1000 krone by the month, until the child reaches 18 years old. Moreover, there are sorts of various social welfare such as pension, annuities and jobless benefits. However, such a country with excellent social welfare and financial subsidies, there still is poverty existed. Specifically, poor and rich are both relative and exist in comparison, the key is the difference between comparison references and the perspective to measure and conclude. For example, the so-called “poor” in Norway receive minimum living benefits of more than 5000 kroner, equivalent to 600 American dollars, which is higher than the per capita income of many developing countries. But in Norway, 5000 krone in the context of Norway’s high prices, life is difficult [12].
What’s more, according to the statistics of Carol Yeh-Yun Lin, a professor of department of business administration from national cheng chi university, Per capita GDP contrast in six European countries including Denmark, Finland, Iceland, Norway and Sweden showed that Norway’s private economy like fixed assets and private savings fared worst, coming in last. Assuming that Norwegians owe in foreign debt was deducted, almost all Norwegians are destitute, almost truly proletariat. In a sense, Norwegians are the most typical poor people living in a rich country in the world [13].
The main politics of poverty in Norway edit
Employment politics edit
The new politics of the welfare state testified that one of the important ways to combat poverty is emphasising employment. Improve the employment rate is an effective way to alleviate the gap between the rich and the poor and eliminate poverty on a large scale. Politics actions are divided into two parties to launch an improvement for employment, which are the conservatives and the labour party. The conservatives party represents a more relaxed approach to temporary employment regulation to ease access to the labour market. And the labour party helps recipients of social assistance find the opportunity to work via introducing welfare contracts between social insurance and clients. As a result, the poor would have the opportunity to find work and change the living conditions[14].
Education politics edit
Norway government found that more than a quarter of young people drop out of school so that the young people like them without any basic education background are easily caught in poverty and social exclusion. The government introduced policies at administrative departments of education at all levels. In Norway’s education system, children and teenagers are required to take parts in ten years of compulsory education, and they have the right to enter the high school education. Furthermore, higher education is free of charge, and all of the students are able to obtain education subsidies and grants. In short, the next generation with higher education will be more effective in lifting Norway out of poverty[15].
Increased inequality edit
The increased inequality for the country of Norway can be contemplated via the unfairness of Gini index and Lorenz curve, some studies believed that adequate amount of inequalities are fair. Under the Gini index, which are the theorisation of the uniform versions of the Gini coefficient and Lorenz curve. Further revelations indicate that regardless of the declining Gini coefficient in this period of time, pre-tax and post-tax income distributions in Norway had become less fair [16]. The research suggest that there is a better method of capturing the essence of inequality in Norway, by utilizing the Parento-Lorenz curve acquired by determining the shares within the shares. The researchers revealed that Norway had a equivalent development as other developed countries,such as the UK and Sweden [17]. Another research particularly investigated in the aspect of Norway’s top income shares in the period of 1875 and 2006, which is then partitioned the population into six clusters, 0.05 per cent, 0.1 per cent, 0.5 per cent, 1 per cent and 5 per cent, the derivation of this data were coming from before tax income micro-data. The findings of the research confirmed with the past research results [18],suggesting that there had been a reduction in the top income shares, especially in the years of war, and a shift of trajectory that caused by market liberalization that occurred in the timeline of 1980. Subsequently, in 1992 recorded the first visible difference in terms of the declining top income shares.
On the other hand, some other scholars pursue in the similar interest of researching the income distribution of the top incomes, however, the source of data were primarily using income tax data [19]. The long-run changes at the top of the income distribution of Norway were using the method of top income share time series over the long run. The findings suggest that most of the regions in the world is relatively stable in terms of the income inequality, however, after the war, the capital income phenomenon cause the income inequality to decline, which affected in Norway as well [20]. Moreover, additional findings revealed that after the Second World War, the Norway’s top income shares dropped gradually, this is mainly caused by the central strategy of the Norway’s economy, highly progressive tax structure, and steady increase of the state of welfare. Additionally, more empirical evidences revealed that the Pareto-Lorenz coefficient was at an approximate 2.25 in 1948, however, the Pareto-Lorenz coefficient grew up to 4 by the end of 1970. In essence, it is evident that there is a turning point in the Pareto-Lorenz curve in the 1980, and the second turning point for the top income shares started to pick up in the early 1990s.
Overall, it is worth mentioning that Norway had underwent a reduction in top income shares in between 1900-1950s. The researcher contend that it is mainly due to the declining wealth concentration on the top section [18], while another scholar argued that it is caused by the differences of capital income [19]. Though, another critiques suggest the reduction of top income shares were caused by central planning, highly progressive tax structure, and the steady increase of the state of welfare [20].
edit
The Norwegian economy and the entry of oil had an significant influence on inequality. The top income shares initially pickup the increasing momentum subsequently after 1990s, which could be associated with the generation of wealth due by introduction of the oil industry, and also due to the increase in global prices in the stock market, allowing the top shares in Norway to increase as well. The first visible insignificant peak were witness in between 1997, this might be illustrated by the shift of the tax laws in Noway, particularly increased the evaluated values of corporate stock on personal tax returns [21]. The phenomenon of insignificant reduction in top income shares in between 2001 can be interpreted by the imposed short term tax on dividends, however, the incorporation of the long term dividend tax in 2006 had furnish strong rationale for Norwegian owner-managers to increase their dividends in 2005, further expanding the top income shares [20]. Then, relating to the income shares in Norway, the income shares remained relatively stable over the years, excepting in between 2005-2006.
Trends in income inequality edit
The wage distribution of Norway wage structure is relatively different from other OECD nations. In the years 1987-1991, low-wage workers that reside at the bottom acquired income shares in relation to the average, though other countries low-wage workers were performing poorly [22]. Though, such phenomenon were most likely caused by the national level bargain that occurred in between 1960s and 1970s. Regardless, the conservative government had a radical change in 1981, which the government administrators had decided not to involve in the bargaining of wage, and the Norwegian Federation of Trade Unions had consented to more decentralized discussion. Such course of action allow the wage outcome among the companies to have more opportunities in aligning the wage structure, some researcher made the presupposition that increased wage inequalities is caused by decentralization of bargaining [22]. However, in 1988, the centralized wage bargaining were revisited by the Norwegian administrators, thereby, showing signs of improvement on the gap in between wage inequalities. More importantly, the introduction of tax reform were incorporated in 1992, allowing the self employment labour forces have a more distinctive definition, which eventually led to the various of labor earnings, and the upper tail of labor earnings distribution to increase, also, among the richest households in Norway, the tax reform had allow the capital gains and dividend to sharply increase, benefiting them the most.
It is contended that, the turning point of the Norwegian economy are most likely caused by the increased revenues of the introductory oil industry into the Norwegian economy, which may have been affirmatory to the public finance institution, however, this does not allow the top income shares increase. But instead, the top income shares expanded in the early 1990s, though, it is more likely to be related to the radical changes in the financial markets in 1980s, which incorporated the elimination of credit rationing.
References edit
- ^ "Språk i Norge – Store norske leksikon".
- ^ "Minoritetsspråk". Språkrådet.
- ^ kirkedepartementet, Fornyings-, administrasjons- og (June 16, 2006). "Samer". Regjeringen.no.
{{cite web}}: CS1 maint: multiple names: authors list (link) - ^ inkluderingsdepartementet, Arbeids- og (June 16, 2006). "Nasjonale minoriteter". Regjeringen.no.
- ^ regjeringen.no (July 5, 2011). "The Re-establishing of a Norwegian State". Government.no.
- ^ a b "Arealstatistics for Norway 2019". Kartverket, mapping directory for Norway. 2019. Retrieved March 22, 2019.
- ^ "Population, 2019-01-01". Statistics Norway. February 22, 2019. Retrieved March 16, 2019.
- ^ a b c d "Norway". International Monetary Fund.
- ^ "Gini coefficient of equivalised disposable income - EU-SILC survey". ec.europa.eu. Eurostat. Retrieved March 7, 2019.
- ^ "2017 Human Development Report". United Nations Development Programme. 2017. Retrieved September 14, 2018.
- ^ Borgeraas, Elling; Dahl, Espen (2010). "Low income and 'poverty lines' in Norway: a comparison of three concepts". International Journal of Social Welfare. 19 (1): 73–83. doi:10.1111/j.1468-2397.2008.00622.x. ISSN 1468-2397.
- ^ Norway, Paris. "OECD Publications Services" (PDF).
- ^ Lin, Carol Yeh-Yun; Edvinsson, Leif; Chen, Jeffrey; Beding, Tord (2014). National Intellectual Capital and the Financial Crisis in Denmark, Finland, Iceland, Norway, and Sweden. SpringerBriefs in Economics. New York, NY: Springer New York. doi:10.1007/978-1-4614-9536-9. ISBN 9781461495352.
- ^ Allern, Elin H.; Bay, Ann-Helén; Saglie, Jo (September 2013). "The New Politics of the Welfare State? A Case Study of Extra-Parliamentary Party Politics in Norway". European Journal of Social Security. 15 (3): 249–272. doi:10.1177/138826271301500302. ISSN 1388-2627. S2CID 157222167.
- ^ Fosse, Elisabeth (January 1, 2013). "The Politics of Poverty in Norway". Social Alternatives. 32 (1): 31. ISSN 0155-0306.
- ^ Almås, Ingvild, Cappelen, Alexander, Lind, Jo Thori, Sörensen, Erik & Tungodden, Bertil (2010). "Measuring unfair (in)equality", Norwegian School of Economics and Business Administration, Bergen, Norway" (PDF).
{{cite web}}: CS1 maint: multiple names: authors list (link) - ^ Atkinson, B. Anthony & Morelli, Salvatore (2014). "Chartbook of economic inequality", Working paper Series, Society for the Study of Economic inequality (ECINEQ)" (PDF).
{{cite web}}: CS1 maint: multiple names: authors list (link) - ^ a b Atkinson, B. (2008). "The Changing Distribution of Earnings in OECD Countries".
- ^ a b Piketty, Thomas & Saez, Emmanuel (2012). "Top Incomes and the Great Recession: Recent Evolutions and Policy Implications" (PDF).
{{cite web}}: CS1 maint: multiple names: authors list (link) - ^ a b c Aaberge, R and Atkinson, A B (2008). "Top incomes in Norway", in A B Atkinson and T Piketty, editors, Top incomes: A global perspective" (PDF).
{{cite web}}: CS1 maint: multiple names: authors list (link) - ^ Waldenström, Daniel (2010). "Den ekonomiska ojämlikheten i finanskrisens Sverige". IFN Policy Paper nr 33, Institutet för näringslivsforskning" (PDF).
- ^ a b Kahn, Lawrence M. (January 20, 1998). "Against the Wind: Bargaining Recentralization and Wage Inequality in Norway, 1987-91". Rochester, NY. SSRN 49541.
{{cite journal}}: Cite journal requires|journal=(help)