This is an archive of past discussions. Do not edit the contents of this page. If you wish to start a new discussion or revive an old one, please do so on the current talk page.
Latest comment: 9 years ago27 comments13 people in discussion
With it nearly November now, the charts not yet including October are becoming quite long-in-the-tooth.--Froglich (talk) 06:40, 29 October 2014 (UTC)23:10, 28 October 2014 (UTC)
None of them, see #Latest Liberian Numbers. Some people just don't know how to read them. That doesn't make them WP:OR. The debate at #Latest Liberian Numbers is about the fact that the data is only a biased sample of the real data, being based on reported statistics which are acknowledged to significantly underreport the epidemic, and it is asserted that, being only a sample, the data must therefore be incomplete, inaccurate, useless, and unsuitable for presentation to a general innumerate wiki readership, who would thereby be better informed and more aware of the real scale of the epidemic if all data was removed from the article (except, perhaps, for the minor Ebola outbreaks which are probably totally accurate - maybe). Note that although the debate focuses on the charts, it is actually the raw data (in the tables) that is challenged. Not my point of view, I hasten to add. --Kirbett (talk) 10:24, 29 October 2014 (UTC)
You are misrepresenting what I said. The charts can only be misunderstood by the general audience. They serve no valid purpose with data being so wrong. The data table itself can be kept, minus the calculated measures like "% daily growth", and a disclaimer can be added. If anyone does research based on this data, we can publish it, but please no homegrown plotting, presented in such a way as to be (perhaps accidentally) deceiving the reader and letting him believe what he sees are (quote) "Cumulative totals of cases and deaths over time", "Average new cases and deaths per day", "Cumulative number of cases by country" etc. --rtc (talk) 13:04, 29 October 2014 (UTC)
Well, I really don't understand what you expect the general reader to do with large tables of uncharted data. You consider the general reader to be incapable of interpreting the charts correctly and yet to be quite capable of doing something sensible with the raw data. Such as what? Could we not just relabel the charts to say "Cumulative totals of reported cases and deaths over time", "Average new reported cases and deaths per day", "Cumulative reported number of cases by country" etc?
WP:GRAPHS and WP:HCGWA facilitate the creation of timeline charts for the benefit of the reader, so it's fairly clear that these aren't considered to be WP:OR. That said, there seem to be hundreds of websites producing graphs of the epidemic based on the reported data (just Yahoo search for "ebola graph"), some of which I guess would count as the research you're looking for, according to your definition. Regrettably, the more accessible ones (which I assume are what the general reader would resort to in lieu of the wiki) seem to be the ones most likely to omit disclaimers. Kirbett (talk) 17:06, 29 October 2014 (UTC)
I don't expect the general reader to do anything with large tables of uncharted data. At least it's not decepting them in the way the questionable charts do. It is not enough to say these are reported cases. The source clearly states that these numbers are wrong. What is so hard to understand about that? --rtc (talk) 11:31, 30 October 2014 (UTC)
Something that should be considered is that all publications do this, and will continue to do this, even if this article doesn't. Forbes graph based on the raw data [1], NPR [2], The Telegraph [3], BBC [4], and then of course Reddit, Mashable, and other sites that get millions more views. Some of these are simply copy directly from the WHO reports and no disclaimer is given. It's presented and understood to be fact.
This doesn't mean the graphs should or shouldn't be removed, but most have (or can) see graphs that will be presented as the truth. Snd0 (talk) 17:45, 29 October 2014 (UTC)
I take issue with the new cases per day line graph from a WP:OR standpoint; it's the same issue I and others have with the homebrew % increase per day. The graph is plotting the artifacts of WHO and national government data collection and sampling, NOT the progression of the outbreak. From a readability standpoint, I take issue with the fact that there are 8 graphs and a lengthy table of raw data that all convey the same information. Wikipedia is not a respository for raw data. I understand a few editors are keeping it there as a repository of data for the convenience of graph creation, but it just doesn't belong in the article as it's not encyclopedic.ZeLonewolf (talk) 19:20, 29 October 2014 (UTC)
Which version of the wiki are you looking at? Daily growth percent only ever appeared as a column in the tables, and that was removed yesterday. Kirbett (talk) 21:38, 29 October 2014 (UTC)
The chart you referring to could be drawn as a histogram, with the width and area of each bar corresponding exactly to the time interval and new case count as cited by the WHO report - thus no OR. Such a chart would have exactly the same shape as the one you object to. See also WP:CALC - I understand the definition of basic arithmetic mentioned therein also includes division.
I know of no disease outbreaks where the statistics have tracked actual cases rather than reported or estimated cases. I know for certain, for example, that flu statistics are strictly wrong, because I have been among the thousands who have not reported the occasions on which we have caught flu. Health agencies can only report the numbers they have been made aware of, or have estimated, and that will always be the case. That doesn't make their data / reports any less valuable.
How can there be a readability issue, when all but the latest raw data is hidden?
The table of raw data is not just raw data. Every line of that table has been individually captured, verified, credited, and qualified, and what has resulted is a coming together of information which, as far as I am aware, is and will be of unique value to much of the wiki readership. This epidemic will be studied by thousands of academics and non-academics alike in times to come, and the robust manner in which the data has been collected and preserved on the wiki will prove an invaluable starting point for many of those students. I know of no other source on the internet which collates so much information on this topic in one place, and I think it would be a great loss to see a significant part of that information removed. Kirbett (talk) 21:33, 29 October 2014 (UTC)
Routine calculations do not count as original research, provided there is consensus among editors that the result of the calculation is obvious, correct, and a meaningful reflection of the sources.
The problem here is not that the data isn't real; the problem is that the calculations are meaningless because the data is known to be inaccurate, and WHO itself has noted repeatedly that the actual case count may be three times as high. WHO has repeatedly noted that some countries have struggled to provide numbers - they specifically called out Liberia on more than one occasion because its medical infrastructure (and government) is on the verge of collapse, and therefore they are unable to really provide the data in question because they lack the resources to collect and track said data.
The problem with graphing the data is that it implies that these are real changes, when in reality the 2000 case jump in Liberia was not due to Liberia actually having 2000 new cases in that interval, but because of a change in data sourcing - Liberia had failed to update its numbers at all on the previous update, for instance, but the idea that there were 0 new cases in Liberia was just absurd on the face of it.
That's why the daily growth % was removed; the data does not reflect the daily growth of the disease at all, but the reporting. If someone got sick in some random village, and it was only reported a week later when they died, then the numbers would increase on the latest report even though they got sick with Ebola seven days earlier. Titanium Dragon (talk) 22:31, 29 October 2014 (UTC)
But the calculations are not meaningless, because they correctly reflect the flaws in the raw data, and, in fact, the charts make those flaws far more visible (and demonstrably thought-provoking) than if the data was only available via the tables. Neither are the flaws in the data meaningless, quite the opposite in fact - you, me, and the WHO all agree on the meaning of those flaws - they represent failings primarily in the Liberian record keeping, a point that is certainly noteworthy. WP:NPOV very much applies here, and I think it's in the spirit of the wiki that, rather than removing any of the material, the effort should be directed at ensuring those flaws are adequately highlighted and explained (and the charts appropriately labelled). After all, the explanation of these flaws is verifiable - SitRep 8Oct2014 et al. Kirbett (talk) 00:43, 30 October 2014 (UTC)
I second and I am Strongly For keeping the "raw data table". Yes it has all its problems and they are well documented. But it is a fact this is what the best available reports are or were at the time. If WHO/CDC or local authority wishes to restate past data to give a better view of the progression I would welcome that ... but until they do we need to stick with what we have. Nowhere else do you see this data online that I have been able to find and I for one find it very useful.Greenbe (talk) 21:54, 29 October 2014 (UTC)
What about my argument is a "straw man?" I am reacting specifically to " Wikipedia is not a respository for raw data" ... "but it just doesn't belong in the article as it's not encyclopedic.ZeLonewolf (talk) 19:20, 29 October 2014 (UTC)" ZeLonewolf please clarify if you are calling for the raw data table to be removed. In any event, I am strongly for keeping it and I would like others who agree to chime in.:::::: (talk) 15:48, 30 October 2014 (UTC)
The term raw data has been used rather loosely to refer to the numerical data as opposed to the charted data. The true raw data is that coming from the individual countries which are primary sources. Looking at the definitions carefully, I believe WHO is a secondary source producing data which has undergone a degree of analysis and evaluation. WP:WPNOTRS appears to frown on Large blocks of material based purely on primary sources but does not make the same statement for secondary sources. -- Kirbett (talk) 02:18, 1 November 2014 (UTC)
At least, we could get rid of the last row of graphs (with the percentage of the population affected). These graphs are more or less useless. First of all, we don't have any data on whether the victims belong to a certain population. What if the US sends 1000 soldiers to Liberia and all of them get sick? Liberia will report 1000 new cases, but they certainly do not belong to the population of Liberia. Secondly, even if we disregard that issue, why do we need a graph to show that? Why not just write one sentence and say: "At the end of the epidemic, five percent of the Liberian population ...". I don't see the added value of having a graph for this purpose. -- 75.155.52.78 (talk) 03:32, 30 October 2014 (UTC)
Your point of view. Useless to you doesn't mean useless to everybody else. When I saw the numbers, I, like the chart creator and many others, I suspect, tried to put them in context, asking do the difference in the numbers just reflect different population sizes, or is the disease, as reported, actually penetrating deeper into the different populations? Initially, I answered that question myself by cross-referencing to the population stats elsewhere on the wiki. The charts answer those specific questions. And even though the Liberian numbers were/are being under-reported, the charts still suggest a much deeper penetration of the epidemic into Liberia than into the other countries. Of particular interest, is the way in which the Liberian penetration figures have overtaken the Guinea and, to a lesser extent, the Sierra Leone ones. It's not for the wiki to speculate on the why, but I suspect the figures will inspire more than a few dissertations from present and future epidemiologists. And it's too early to write a sentence starting "At the end of the epidemic ...." Kirbett (talk) 12:00, 30 October 2014 (UTC)
You are about the only person lobbying against deletion of those charts. Don't you want to rethink your position, given so many have voiced concerns? --rtc (talk) 12:16, 30 October 2014 (UTC)
I think the dates in the charts should be in ISO 8601 format rather than in the DD.MM.YY format used in Germany, Russia, etc. — Preceding unsigned comment added by 151.190.40.1 (talk) 15:18, 30 October 2014 (UTC)
Table in infobox?
Latest comment: 9 years ago11 comments8 people in discussion
Would it look better to make the case by country counts in the infobox in a summary table? I tried to do it to see how it would look but I couldn't figure out the formats. e.g.:
It is possible to place a table inside an infobox, and I've added an example infobox at right. I'm not especially convinced that this presentation is better though. Dragons flight (talk) 19:44, 31 October 2014 (UTC)
I was referring to this "I added "style="width: 100%" to the table syntax. -- Veggies (talk) 09:58, 1 November 2014 (UTC)" which I thought improved it--Ozzie10aaaa (talk) 11:02, 2 November 2014 (UTC)
Latest comment: 9 years ago4 comments3 people in discussion
The second paragraph of the main body begins "As of 29 October 2014..."
Can anyone shed any light on this? The most recent WHO report (31 Oct) only has data up to the 27th, and the 25th for Liberia, but this statement gives figures (similar cases and lower deaths) claimed to be for the 29th, it is also referenced by a citation dated 22 October. I would have cleaned it up myself, but the markup is too complicated for me.Saxmund (talk) 09:58, 2 November 2014 (UTC)
In the Oct. 31 WHO report [5]: "A total of 13 540 confirmed, probable, and suspected cases of EVD and 4941 deaths have been reported up to the end of the 29 October 2014 by the ministries of health of Guinea and Sierra Leone, and 25 October by the Ministry of Health of Liberia (table 1)." I can only assume you either misread the WHO report, or were looking at an older one. Dragons flight (talk) 16:56, 2 November 2014 (UTC)
I am not sure what happened there but have now updated the info box accordingly. On the offchance the WHO report changed I have updated the access date as well. But it was probably my error :-( Saxmund (talk) 17:34, 3 November 2014 (UTC)
But I did not change the graphics from 27 to 29. It also confuses me, because as we split the tables, we also have now different date entries. The other table has data for 27 October. I already fear the moment when I have to redesign the graphs to allow individual dates for each country. Malanoqa (talk) 20:40, 4 November 2014 (UTC)
Latest Liberian Numbers
Latest comment: 9 years ago24 comments6 people in discussion
Are the latest Liberian numbers thought to be accurate by WHO, or do they think that Liberia's health care system has collapsed to the point where they simply were unable to record any additional cases? I'm pretty suspicious given the history of Liberian numbers having issues in their reports, but I don't want to add a note to the number without a source for it. Titanium Dragon (talk) 05:42, 26 October 2014 (UTC)
As the pace of the disease destroys infrastructure in these countries, the tally numbers will go from tardy to unreliable to absolutely hopeless, and there's very little we can do about it.--Froglich (talk) 08:07, 26 October 2014 (UTC)
IMO the entire obsession with numbers and statistics in this article is a clear example of cargo cult science. These numbers bear little resemblance to reality, and this is even strongly emphasized by the organization that publishes them. The way they are presented, up to the last digit, suggests to the reader a degree of accuracy that is completely unfounded. If at all, these numbers tell you something about the capability and willingness of local authorities to report new cases -- apparently it is declining. --rtc (talk) 10:11, 26 October 2014 (UTC)
... and having no numbers at all, would leave us all totally in the dark. I see no choice but to rely on a proliferation of disclaimers and the intelligence of the readers to appreciate the points that you make. Inferring what these numbers actually tell us would unfortunately be either WP:OR or WP:POVKirbett (talk) 16:48, 26 October 2014 (UTC)
I don't think there is any OR in what I say; this interpretation is made by the WHO itself and it is already included as a disclaimer in the various pictures displaying the data in the Timeline of cases and deaths section. What is really OR is calculating a "% Daily growth" measure, suggesting to the reader that such an interpretation of the data would bear any validity. Inferring growth rates from the data is exactly what one cannot do. I tend to have the same opinion on the said pictures themselves. In the same way, they are making it seem as if the data had any validity and they are giving the wrong message that the disease is slowly beginning to "burn out". The pictures, as a "finished product" made from the numbers, make it too easy to dismiss the caveats and disclaimers and to assume the raw data reflects reality, which it does not. The actual growth rates are higher and estimated to be in fact not decreasing at all. Plus, the data contains anomalies that obviously cannot be right, such as numbers not adding up, or the latest liberian numbers being unchanged, as mentioned above. We shouldn't use this data to calculate any measure and probably not to draw pictures either. It is useful only for experts with advanced specialist knowledge in stochastic models for further processing and as a very raw input, and those experts have the tools ready to display the data themselves anyway. --rtc (talk) 21:15, 26 October 2014 (UTC)
So what would you suggest? Remove the data and tables completely? I can't seen how having no access to the data would better inform us. And the lead para to the data and tables does say "The WHO has stated the reported numbers "vastly underestimate the magnitude of the outbreak"" Kirbett (talk) 02:27, 27 October 2014 (UTC)
Keep the table of raw data with WHO-like disclaimer, but remove anything that can be considered an interpretation or derivative of the data, pictorial or otherwise. --rtc (talk) 07:39, 27 October 2014 (UTC)
@Rtc:@Kirbett:@Art LaPella:@Ozzie10aaaa: I had previously added the ≥ marks to the Liberian numbers when WHO called them out as being especially unreliable, but they haven't been including remarks on the individual data recording capacity of the various countries in their more recent reports. If this is an ongoing problem, or something which has been noted in a RS, maybe we should add that mark to all the table for the three most infected countries? Or possibly relabel the table to make sure that it is clear that this is a very bottom-run estimate of the number of cases? I dunno, I hate to junk up the table excessively but it seems like there should be an obvious disclaimer that these numbers are very questionable so people don't just blindly rely on them. Titanium Dragon (talk) 02:51, 27 October 2014 (UTC)
The charts and growth rate calcs are correct representations of the trends inherent in the raw data. These charts and calcs are not of themselves misleading - it is the underlying data that is - and there is a very clear bold disclaimer at the head of the table to that effect. I sense that the suggestion to remove the charts and calcs is an attempt to hide the trends that do exist within the data, unreliable though they might be, by making that data more impenetrable and obscure to the less numerate readership. The assumption being made is that, without the calcs and graphical aids, the average readership will be incapable of making any non-trivial sense of the numbers (for why else remove the charts/calcs?). Is this not bordering on censorship? Is it not better to show the trends AND educate the readership further to the probable reasons for those trends, rather than trying to leave them in ignorance? If we cannot state and highlight those reasons because we do not have adequately sourced material to support those reasons, then neither do we have adequate reasons for removing/hiding the charts/calcs.
That said, concerning the most recent (unchanged) Liberian entries, I would prefer to see these listed as "n/a", and the "daily growth" as "n/a" also for as long as it is based on unavailable Liberian data. And the "daily growth" heading might be better as "reported daily growth". Kirbett (talk) 13:26, 27 October 2014 (UTC)
Removing the charts is not an illegitimate idea, given that we know that the data is nearly worthless in those countries - WHO estimates that the numbers by be off by a factor of two or more, and we know that the reporting of the data is haphazard at best in many cases. If WHO is to be believed, these numbers aren't even good to a single significant digit. Titanium Dragon (talk) 05:32, 28 October 2014 (UTC)
Not only that, but the factors of uncertainty vary over time and hence the dynamics of the stochastic process suggested by the raw numbers are wrong as well. For example, the WHO states that recent decline in numbers are most likely not real. The pictures strongly suggest the disease is slowly beginning to "burn out". What other useful information do they convey? I have a hard time seeing any. They merely deceive the reader. The pictures may be "correct representations of the trends inherent in the raw data", as brought forward by User:Kirbett but that's not what readers expect and understand. They want to know the real trends, not illusory trends caused by increasing errors in the data, interesting at most to experts in stochastics who can do their own plots easily. --rtc (talk) 10:08, 28 October 2014 (UTC)
The latest Liberian stats (24/Oct) seem to have caught up slightly. Hopefully, that's enough to dispel any premature perceptions that the disease might be beginning to burn out. As far as useful information is concerned, I can only speak for myself, but three months ago the graphs confirmed my back-of-the-envelope calculations that the disease was/is really growing (at least) exponentially. The straight line log graph took my breath away, and the first question I asked myself was "what's the slope of that graph"? (hence why I like "daily growth rate"). As far as the under-reporting is concerned, the general public (not just the epidemiologists) need to know that this under-reporting is happening, so that they can make their own best guesses at "the real trends" as you would put it, and my belief is that that's best achieved by providing them with more information, not less. It's the wiki's responsibility to provide the information, along with all the disclaimers it feels necessary. But we can't and shouldn't take away from the readership their responsibility to digest that information correctly and draw their own conclusions. If, in the process, we can educate the general readership into understanding that it's not wise to read too much into just one or two rows of a table of statistics, then so much the better. Kirbett (talk) 15:06, 28 October 2014 (UTC)
I didn't say the table needs to be deleted. What is arguably violating WP:NOR and quite deceptive are the data plots and calculated measures like "% Daily growth" (which is not even making it clear whether cases or deaths), suggesting interpretations to the general public that are obviously invalid. In the latest Liberian stats we see a slight decrease (!) of deaths. That's so obviously wrong that I'm very surprised about your conclusion that premature perceptions are now dispelled. Whether the numbers are "caughing up slightly" or not, they are hopelessly out of kilter and at this point in fact have become quite useless. Soon, the raw data will be wrong by at least an order of magnitude. --rtc (talk) 15:42, 28 October 2014 (UTC)
Presenting information in a more digestible way (such as charts) is most definitely not WP:OR. The wiki is full of summaries and precis, and charts are simply the most convenient way of summarising and precising tables of data. And I contend that "daily growth" counts as WP:CALC. I agree the column header is ambiguous and should be corrected.
The latest Liberian stats appear to reflect a change in procedures between their Oct 21st SitRep and their Oct 22nd SitRep. The editor hasn't reflected these numbers onto the charts yet, yet curiously you are campaigning for the numbers to be retained but for the charts to be removed. It is most definitely premature to draw any conclusions from these stats until the next WHO report which I would hope would shed some light on the change in Liberian reporting procedures. Since the table focuses on WHO-reported numbers, perhaps the ">=2704" entry should be replaced by "n/a" until that time.
And I still don't understand how you think that removing the charts would somehow make the general public better aware of the "hopelessly-out-of-kilter" raw data and generally better informed of the scale of the epidemic. To me, a picture speaks a thousand words, and a chart with a line shooting off the top of it (even though the top may be out by an order of magnitude) says a heck of a lot more than a thousand bland words of text and data. Kirbett (talk) 17:18, 28 October 2014 (UTC)
Again, the trends suggested by the data don't tell the truth. This is stressed by the source. Thus, plotting the data or calculating a "daily growth" is not a "meaningful reflection of the sources" as per WP:CALC. The data plots are deceptive and are suggesting decreasing growth when in fact they are merely showing underreporting to be increasing according to the source. Heck, the captions are clearly saying "Cases" and "deaths", which in fact the plots clearly don't show. Some plots contain a disclaimer box but readable only when you click on them. Please tell me what you think is a legitimate use of these plots? You say a picture speaks a thousand words, that's certainly true, but that does not mean the thousand words it speaks are the truth. --rtc (talk) 17:38, 28 October 2014 (UTC)
2) WP:CALC says "a meaningful reflection of the source", which in this case is the cited raw data, NOT the undetermined real data
3) There is no intent to deceive. You obviously understand what is going on with the statistics. The editors have tried hard to make sure other readers also achieve that understanding
4) I suggest you do indeed click on the disclaimer boxes to read them. It is, in fact, hard to read the other parts of those charts (legend, subtitles, scale etc), without actually clicking on them. Kirbett (talk) 18:42, 28 October 2014 (UTC)
Let's be realistic!
1) Many readers will ignore that paragraph, but go right down to the plots because, as you said correctly, a picture speaks a thousand words, so why read a thousand words when you can simply look at the picture.
2) the captions are written as if it were the real data and that's clearly what people expect.
3) Intent does not matter; the deception does. Unintended or accidental deception is no less of a problem than intended deception. And requiring the average reader to understand things when I do seems like an unreasonably high standard. For example, I read some papers on probability, stochatics and time series in finance while doing some edits in Merton's portfolio problem. I don't think that such background knowledge can be expected from the average reader.
4) Hardly anyone will click on them. Given the captions talking about cases and deaths, there is a very clear, straight-forward way in which readers will not click on the plots and misunderstand them. It's like handing a glass of acid with a label saying "water" to some ordinary person and then being surprised when he drinks it... While it was intended for a complex chemical experiment that the guest has no clue about, but would perhaps have known about had he carefully read the microscopic disclaimer above the big word "water" on the label saying "and by the way, it's very likely not actually water, rather it seems to be acid"? --rtc (talk) 19:07, 28 October 2014 (UTC)
Perhaps you would both be happy with keeping the graphs and changing the captions (other than caption number 4 out of 8, which would seem to be explicit enough for anyone). Art LaPella (talk) 19:30, 28 October 2014 (UTC)
In a month's time, the numbers will have doubled, the current stats will be paling into insignificance, and this discussion will have been obsoleted. I have nothing more to add. Kirbett (talk) 19:44, 28 October 2014 (UTC)
In a month's time, the numbers will be off by an even greater factor. The points raised in this discussion will be even more pressing. --rtc (talk) 19:52, 28 October 2014 (UTC)
Latest comment: 9 years ago9 comments6 people in discussion
The total number of deaths is currently reported as at least 4941 for 29 October. For 24 October the total is reported as 5078. Since the number of deaths cannot decrease the lower limit on any day after October 24 should be at least 5078. Yes, one can point out that the numbers are not inconsistent in a strict sense but that would also be true if the total listed as of 29 October would be 'at least 0'. So I would like to change the total for 29 October to at least 5078. Thanks. Lklundin (talk) 12:56, 5 November 2014 (UTC)
PS. The same logic applies to the other totals, specifically for Liberia for 29 October. Lklundin (talk) 13:00, 5 November 2014 (UTC)
Hi Lklundin please obtain consensus before you edit. Other editors are aware of these inconsistencies and there's a lot of debate about the best way to handle them - see elsewhere in this talk page! Robertpedley (talk) 13:12, 5 November 2014 (UTC)
OK. (I did actually scan the talk page, but apparently missed the already ongoing discussion. Sorry). My point is just that older data points also counts in the sense that a total (including its lower bound) cannot decrease in this tragic case. I will let the already discussing editors conclude the discussion and perform any edit deemed useful. Lklundin (talk) 13:39, 5 November 2014 (UTC)
Lklundin, it's not that the death has been reversed, it's been reclassified as not because of Ebola.. see UN page here, read specifically:
These numbers are subject to change due to ongoing reclassification, retrospective investigation and availability of laboratory results.
Thank you for patiently explaining the concept of the reclassification (of the cause of death). I cannot see how this changes anything. In order for the fatality numbers to make sense, I would think that a reclassification would have to be applied retroactively, back to the actual time of death for that case. Otherwise the derivatives would be seriously distorted. And as far as I can see, the lack of decrease in the total should be preserved by such a correction. Apologies for not understanding. Lklundin (talk) 18:06, 5 November 2014 (UTC)
All values reported here are cumulative cases / deaths as understood on the day reported, with no subsequent adjustment of previously reported values. You're right that eventually someone may want to go back and correct the historical data on cases / deaths in order to get a better understanding of the true evolution of the disease. However, at the present, none of the involved countries are providing historical corrections. Probably too low a priority given what else they have to deal with. So all we have to go on is the current totals as reported on Day X. Sometimes those current totals include large swings due to historical adjustments and reclassifications, but at present, we don't get to see how those adjustments would actually apply to the past data. Dragons flight (talk) 18:14, 5 November 2014 (UTC)
Lk is a super good editor as far as I have seen but frankly I am not sold that the encyclopedia should even attempt to present a running total in real time that seems to miss the point of WP:NOTNEWS and WP:RECENT but then what would I know?Wikidgood (talk) 22:21, 5 November 2014 (UTC)
Latest comment: 9 years ago1 comment1 person in discussion
I thought it might be useful for editors of the wiki article, to add a list of sources of sources to the talk page to make searching for current and past sources of information easier. If it is not appropriate to add this section to the talk page, let me know and I will delete it. For starters, I have two such sources to list,
Explained, I assume, by the extended disclaimer WHO attached to its table data in that report ...
Data are based on official information reported by ministries of health. These numbers are subject to change due to ongoing reclassification, retrospective investigation and availability of laboratory results. The fewer cases reported this week compared with the Situation Report of 29 October is due to a change in the use of data sources. In this report, the cumulative total numbers of cases and deaths nationally (table 1) and by district (figures 1-3) are identical to those presented in situation reports compiled by ministries of health and WHO country offices. Previously, these totals were derived from a combination of patient databases and country situation reports. The revised approach unifies the totals presented in this report with those given in national report
To be honest the numbers make it look like people came back from the dead. There should be a giant * on the lower number with an explanation. Otherwise the numbers make no sense regardless of where they are coming from or the reason they go up and down. -- Ashish-g5514:51, 6 November 2014 (UTC)
No wonder we can not contain the outbreak so far. Deaths go away on order of 500 in a few days! We can not even get
accurate data reported. — Preceding unsigned comment added by 74.143.208.239 (talk) 15:36, 6 November 2014 (UTC)
I doubt if you all are aware of the situation, WHO has been very inconsistant with there reports as we stated in numerous cases in the past.. In the case of Sierra Leone they are now only reporting lab confirmed deaths, hence the massive decrease in death toll. Liberia have last reported on 31 October as well . I expect this situation to change soon since Unmeer is involved and the head of WHO in Africa was replaced in the past week. Hoping this will solve the erroneous numbers soon. Unfortunately the data is the only we have to work with, but dropping it now is not a viable option. BrianGroen (talk) 16:23, 6 November 2014 (UTC)
RfC
Latest comment: 9 years ago50 comments30 people in discussion
Should the French name Médecins Sans Frontières be used or should the English translation Doctors without Borders be used in the article? 12:55, 12 October 2014 (UTC)
Both Both are used by the organization without indicating an absolute preference for any single language. Noting also the corporate name in the US is "MSF USA" which should also be indicated. Collect (talk) 17:28, 12 October 2014 (UTC)
I can see no reason to list the national names for each country, unless there is a specific reason for doing do. All the best: RichFarmbrough, 16:21, 15 October 2014 (UTC).
Both. Collect makes a good point. Since the organization uses both French and English without preference for either, the article can easily do the same, as it has been doing. And as Saxmund noted in the discussion in the thread above, it's common in the UK to say MSF. SW3 5DL (talk) 18:25, 12 October 2014 (UTC)
Emphasis on the French, and use MSF as the abbreviation later in the article. [Example: "Médecins Sans Frontières (Doctors Without Borders) has provided assistance...] I have seen hundreds of communications from this organization, and the French name is always used, while even in English-language communications Doctors Without Borders is seen significantly less frequently. It may have equal footing in the US, but this is not US Wikipedia. "Doctors Without Borders" is not seen nearly as often in English-speaking countries outside the US. Risker (talk) 22:40, 12 October 2014 (UTC)
French. Let's be clear on the problem: the French name is used throughout most of the world, except by the U.S. media, who seems to feel that their primary job is to dumb Americans down by eliminating the use of foreign words and phrases. If we started following in the footsteps of the U.S. media, this entire site would be doomed. Viriditas (talk) 22:41, 12 October 2014 (UTC)
English. Let's be clear here: Doctors Without Borders translates their name into local languages. It does so on its own website. Per WP:EN, we should as well. It is the common name in English, and it is the name of the organization - just as we call the Russian armed forces such, even though they have a name in Russian. If you look at their website, on the English versions of their page, they refer to themselves either as Doctors Without Borders, or as the MSF. They do note their name in French, and that shows up on their website too, but the reality is that they don't refer to themselves inline by their full name on their English webpages, and their most common name in the English speaking world is MSF or Doctors Without Borders. But we should be having this discussion over there, not here, as others have noted. Titanium Dragon (talk) 03:38, 13 October 2014 (UTC)
That's not actually correct; the American branch is named MSF/DWB-USA, the Canadian branch is MSF Canada, and indeed in Canada from coast to coast it's referred to as MSF or Médecins Sans Frontières. The same is true in the UK and Australia. Doctors Without Borders is not the name used in the majority of English-speaking countries. Nonetheless, to the heart of the matter: DWB would be appropriate if all of the volunteers on a specific mission came from a single country where that was the name by which the organization was known; however, they are in fact coming from multiple countries for this specific outbreak, so the generic/international name is the appropriate one, not the name by which MSF is known in the US. Risker (talk) 04:33, 13 October 2014 (UTC)
French. Considering that in many circumstances French is still a lingua franca. Except for monolinguists (i.e. North Americans living between Canada and Mexico.Jaerik (talk) 03:53, 13 October 2014 (UTC)
How is that relevant to the English Wiki? By that metric, all the Wikis should use the English name for everything, given that it is the primary lingua franca of the world, especially in a lot of technical fields. Titanium Dragon (talk) 04:11, 13 October 2014 (UTC)
It's the name of the umbrella organization that co-ordinates responses to crises. Since the response to this specific crisis is multinational, it makes sense to use the name of the umbrella organization instead of the name by which it is known in the US. Risker (talk) 04:33, 13 October 2014 (UTC)
Both but mostly MSF, with parenthetical mention of DWB in major sections. Per Risker above, that's the umbrella name internationally; "Doctors Without Borders" the name for MSF in the US. (True, most Anglophone North Americans live in monolingual areas where the name "DWB" will be preferred in the media. But most other Anglophones don't tend to be (nearly) as monolingual, so using mainly DWB would constitute regional bias IMO). --Middle 8 (contribs • COI) 06:01, 13 October 2014 (UTC)
French only. "Médecins Sans Frontières" is the main term used by the organization, even in the UK and some other English-speaking countries. Axl¤[Talk]11:44, 13 October 2014 (UTC)
French. "Médecins Sans Frontières" is the original name of the organisation, and the one it is most frequently referred to by in the UK (and as the article uses British English, I think that is quite a good pointer). From what I see on this page, the English name is only used as the primary name in the US. This is an international article about an international event so to defer to a usage prevalent in only one country seems wrong. Although the name is used on the website it clearly appears to be secondary, and when the organisation is abbreviated it is usually MSF, ie an abbreviation of the main French name. Having said that, I would be happy to see the English name in parentheses the first time the phrase is used in the article. Saxmund (talk) 18:48, 13 October 2014 (UTC)
"French" (MSF) - which, we should note, is the English name in most of the English-speaking world! Glossing as DWB on first or second use is definitely sensible, though. Andrew Gray (talk) 18:45, 15 October 2014 (UTC)
French it is not difficult to understand. Moreover from what I can see the local media uses either the French or an Angliciɀed version (Medicine sans Frontiers). All the best: RichFarmbrough, 22:27, 15 October 2014 (UTC).
French My experience of seeing the organisation mentioned in the media is that they mostly referred to as Medecins Sans Frontieres. A quick check on the BBC website confirms this (6,360 uses of MSF and 1,780 of DWB, most of which seem to be noting the translation of MSF rather than using it as the main name). However, this debate is rather pointless - the article should simply reflect whatever the main article is called - having a subdiscussion here is not really appropriate. Number5714:30, 16 October 2014 (UTC)
What is here confusingly called "French". But I'm no more speaking that language when I call Médecins Sans Frontières by the name it's best known by in most of the English speaking world than I'm speaking German when I say "Volkswagen". (And that one has had an alternative name used in one English speaking country.) Timrollpickering (talk) 09:53, 17 October 2014 (UTC)
I think that the French title should be used throughout seeing as most of the world uses the french version. Perhaps one should include the english translation in brackets after the first use of it, ie Médecins Sans Frontières (Doctors without Borders). Schuy B. (talk) 00:07, 21 October 2014 (UTC)
French, per above editors that believe it is preferable. The article currently has the French version with the English version in brackets in the lead as Schuy suggests, which I find to be the best choice. Gandydancer (talk) 16:08, 21 October 2014 (UTC)
French. That's its name, that is how it is known throughout the world. I am English, but until today I had never encountered an English version of its name. Maproom (talk) 07:13, 25 October 2014 (UTC)
Anglicised as Medecins Sans Frontieres as used at least by the BBC, I was aware of the English translation but I dont recall it being used in British media. MilborneOne (talk) 16:36, 29 October 2014 (UTC)
I disagree. The MSF article's title is adequate for WP, and the link to that article clarifies for the curious. -- Scray (talk) 03:12, 5 November 2014 (UTC)
That's a good point, but they also call themselves Doctors without Borders in English speaking countries, because they are without borders. So they don't insist on the French name. They want to be inclusive. SW3 5DL (talk) 16:51, 12 October 2014 (UTC)
I opposed a blanket change, but I would be happy with a compromise. I propose "Doctors without Borders / Medecins sans Frontieres (MSF)" for the first occurrence and then "MSF" thereafter. Robertpedley (talk) 17:05, 12 October 2014 (UTC)
UK news sources like the BBC always use Medicines Sans Frontieres - there are two here; two here (although to see one of them, you need to click the "Respirator" link in the "Protective Ebola suit" picture); on here; there are other pages too. --Redrose64 (talk) 17:07, 12 October 2014 (UTC)
Per the RfC rules publicizing an RfC, I posted at the Village pump and the RS and NPOV noticeboards. I haven't picked editors at random from the Feedback Service list because those three places should be enough whilst waiting on the Bot. SW3 5DL (talk) 17:20, 12 October 2014 (UTC)
Improper venue? Why does there need to be a separate discussion about this just for this article? The organization already has an article of their own with a name that presumably follows WP:COMMONNAME and not only have there been multiple discussions about the common name in English sources there already, but there's a parallel RM going on right now. Regards, Orange Suede Sofa (talk) 17:45, 12 October 2014 (UTC)
A Google Image search strongly suggests MSF are predominantly or exclusively using 'Medecins Sans Frontieres' on the ground during the current Ebola outbreak in West Africa, even though English is the official language of two of the most heavily affected countries (Liberia, Sierra Leone). Qwfp (talk) 18:10, 12 October 2014 (UTC)
FWIW, the other countries mainly at risk are Francophone. The use of French markings is therefore pretty meaningless in discussions here. As the organization appears to give equal weight to both names, and to "MSF" as an acronym, then so ought we. Collect (talk) 20:49, 12 October 2014 (UTC)
I also agree that this may be the wrong venue for this discussion; MSF is discussed on hundreds of Wikipedia pages and even has its own article (while DWB is a redirect). It is not a good idea to have a "local consensus" considerably out of step from the rest of the project. Risker (talk) 22:40, 12 October 2014 (UTC)
Titanium Dragon, Risker is right, but did you provide a link here to your RfC on the MSF article? I didn't see any link here. If I had, I wouldn't have bothered to start this RfC. But looking at the one you began over on the MSF, it appears keeping the French name is the community choice. SW3 5DL (talk) 03:51, 13 October 2014 (UTC)
Well, I started it in the wrong place, which didn't help anyway. I should probably close it and reopen it properly, as it doesn't belong in speedy. Titanium Dragon (talk) 04:13, 13 October 2014 (UTC)
For those who presume to claim that the group is not known as "Doctors without Borders" in the UK, I present Health specialists work in an isolation ward for ebola patients at a Doctors Without Borders facility in southern Guinea. Photograph: AFP/Getty Images from [7] The Guardian, etc. The English term is,indeed, used in England, although in an acronymic society "MSF" is frequently found. Cheers. Collect (talk) 12:24, 15 October 2014 (UTC)
That's very unusual; note that the Guardian style guide itself uses Médecins sans Frontières without even mentioning another name. I suspect this is an effect of an article written by external correspondents! Outside of that link, I would confidently have said I'd never seen it referred to by that name here (including on material it produces, which it sends me every now and again). Andrew Gray (talk) 18:54, 15 October 2014 (UTC)
Indeed. This RfC should be closed. In fact, whoever started it should be trouted. Do we really need an RfC for every little decision on this article. This Ebola stuff has been the biggest whackery since Bradley Manning vanished off the face of the Earth. - Floydianτ¢15:42, 17 October 2014 (UTC)
Proposed new situation map
Latest comment: 9 years ago18 comments9 people in discussion
I propose that we change the map to simplify it and reduce the effort needed to constantly tweak the numbers. I created a new version of the map that color codes based on live versus contained outbreaks.
Yes, that looks good. I'd make one change: either use a paler pink for the contained-outbreak countries, or use hatching, to de-emphasize the seriousness relative to the other countries: none of those countries had more than 30 cases, whereas the currently uncontained countries have cases measured in the thousands -- a quite different level of seriousness by at least an order of magnitude. -- The Anome (talk) 19:19, 2 November 2014 (UTC)
I made the change, with a paler color of pink. I also removed the title on the graph since it seemed redundant with the infobox title. ZeLonewolf (talk) 20:19, 2 November 2014 (UTC)
I would suggest distinguishing between the big three countries and Mali (which has had only one case so far). In WHO language, Liberia / Sierra Leone / Guinea have "widespread and intense transmission", while Mali / Spain / USA have "initial cases" and/or "localized transmission" and Nigeria / Senegal have "previous localized transmission" that is now declared "over". For the map, I might suggest the labels "Widespread Active Outbreak", "Initial Case(s) / Localized Outbreak", and "Past Outbreak Resolved". By the way, the current label "contained" also isn't an ideal word choice since some people may think it just means that all the sick people have been isolated. Personally, I'd probably also go with a wider color range, e.g. (red, orange, yellow) or (red, yellow, pale green) or something, for easier visual distinctions, but that may be more a matter of taste. Dragons flight (talk) 21:14, 2 November 2014 (UTC)
Propose an alternate nomenclature and color scheme. I agree that "contained" isn't the right term, I was trying to come up with something that's concise and avoids overly technical language. Remember, it has to fit in the legend. ZeLonewolf (talk) 22:20, 2 November 2014 (UTC)
Perhaps "no current cases" instead of "contained". As far as the colors, let's keep in mind that there are colorblind people who would benefit from cross-hatching and should be able to access this as easily as those of us without color perception problemsJaerik (talk) 04:33, 3 November 2014 (UTC)
Would be nice to use the terms of a reliable source. The WHO situation assessments use the phrases "outbreak over" and "free of Ebolavirus transmission"; the former seems more compact and would be clear in the legend. -- Scray (talk) 05:29, 3 November 2014 (UTC)
I changed this to "Past Outbreak", but what color/hatching scheme would be better? And are we OK with the phrase "Isolated cases"? ZeLonewolf (talk) 14:21, 3 November 2014 (UTC)
Since we seem to have no objections on three colors I would suggest vertical lines, lines from upper left to lower right and lines from from upper right to lower for the three shading options. Should work well with the existing colors.Jaerik (talk) 23:08, 3 November 2014 (UTC)
The plural of "isolated cases" is wrong right now since there was only one single isolated case two weeks ago in the only country affected by this term on the example map. Proposition: dark red (Gin, Lib, SL) / light red (Mali, Sen, NG) for the dimension (severly hit vs. initial cases) - additional lines as proposed by Jaerik for outbreak over (Senegal, Nigeria) Semiliki (talk) 20:49, 6 November 2014 (UTC)
Regarding accessibility— people seem to be talking a lot about accessibility and color perception but only Dragons flight and Jaerik have gotten close to what the solution should be. If the goal is to make the map accessible by those who have difficulty perceiving color, then there are two conditions that must be met:
No information can be transmitted by color alone. In this case, there is a dimension of severity that is transmitted by color alone. Jaerik suggested using additional patterns to distinguish this dimension and that is indeed one of the traditional ways to solve this problem.
If you want to distinguish colors, you cannot do so by brightness or saturation alone; you must do so by changing hue. This map has only one hue that is distinguished by brightness and saturation, so it is not acceptable if the goal is to be accessible to those with color perception issues. Dragons flight suggested introducing different hues, and that is the right way to address this.
Selfishishly, I do not have issues with perceiving this map so I am not going to drive further changes. But for those who care about accessibility, these are what the challenges and solutions are. Regards, Orange Suede Sofa (talk) 21:09, 6 November 2014 (UTC)
Latest comment: 9 years ago9 comments5 people in discussion
Hi all, User:Ozzie10aaaa and I seem to be in disagreement over a few lines at the end of the Liberia section. I don't have enough Wikipedia:Etiquette experience to handle the situation without risking edit wars, so I'm asking for help. Problem description: Ozzie10aaaa added material I believe to be poorly sourced, I reverted, and they un-reverted with a promise to improve. FourViolas (talk • contribs) 14:11, 3 November 2014 (UTC)
If this comes up again it will be helpful to include all pertinent diffs and/or the contested text so people have a better idea what the underlying issue is. Wikidgood (talk) 22:18, 5 November 2014 (UTC)
right, you might want to check the user FourViolas, page (sockpuppetry?) as I contacted a administrator (who confronted him/her with it before)two days ago.thank you--Ozzie10aaaa (talk) 22:43, 5 November 2014 (UTC)
Thanks for your patience! All seems resolved, but here's the back-and-forth for future reference:
• I (FourViolas) reverted with the comment, "(Undid revision 632278400 by Ozzie10aaaa (talk) Couple issues: Dailybeast.com isn't WP:Reliable enough for such a claim, and citing the news needs more than a url.)"
• Ozzie10aaaa reverted my reversion with, "Undid revision 632279222 by FourViolas (talk) we will find a different source then. thank you" and deleted the DailyBeast reference with, "I hope that reference is better mister [sic]. have a nice day"
• I came here (see above), and later added a (cn) with the comment, "added (cn), material remains noncompliant with MoS"
• Following the lead to the WHO press briefing referenced in the second citation, and my own unjustified feeling that USA Today is a good but not the best possible source, I changed the two sentences in question to
with comment "Thanks for pointing to the WHO press conference. I rewrote in line with a good source. Please note the citation template:cite news"
• Ozzie10aaaa, with (imo) justified suspicion of my "precocious edit history", brought their suspicions to User_talk:Flyer22#sockpuppet.3F_User:FourViolas, who had broached her own suspicions previously on my talk page. (btw, I categorically deny being a sockpuppet, and understand but am saddened by the interpretation of my good-faith efforts to learn the rules before editing as evidence against me. OK, sulk over.)
Oooh FourViolas please break those citations! Pesonally I think you are both serious & sincere editors, if either of you is ever anywhere near Heathrow Airport give me a call & I'll buy you a coffee!Robertpedley (talk) 20:06, 6 November 2014 (UTC)
RfC: Should the charts derived from WHO's reported case/death statistics be removed?
Latest comment: 9 years ago56 comments21 people in discussion
Should the charts derived from WHO's reported case/death statistics be removed, on the basis that they are misleading, given that WHO's statistics, in particular for Liberia, are incomplete? -- Kirbett (talk) 13:48, 30 October 2014 (UTC)
There is discussion on this topic in these sections ...
Per the RfC rules, I'll also post on WP:RSN and WP:ORN.
Please keep in mind the question in the RfC summary. The question I am seeking resolution of is whether any charts should be included, even with a proliferation of disclaimers, given that some consider them to be useless, meaningless, or misleading (not my words) being based on unreliable / incomplete data from WHO. If it is resolved that this is not a bar to their inclusion, then I am happy to participate in discussions about which particular charts should be included. -- Kirbett (talk) 22:38, 30 October 2014 (UTC)
Remove - I think most of them are not WP:OR, as I am seeing various sources that graph the data in more or less the same way, so for those graphs which plot data that have been plotted together in reliable sources, I don't think there's a WP:SYNTH violation. That said, it's pretty bad style to just have a big chunk of graphs in the middle of an article like that. Graphs are best used judiciously to illustrate various points. You definitely shouldn't just have a bunch of random graphs strewn together on top of a huge (and I must say, unnecessarily detailed) data set - half of these graphs even have redundant information on them, showing the linear and then the log plot next to one another. Show one or the other, not both. I have no problem if they are integrated into the article inline where they are relevant. Also, all the graphs are PNGs; if they're to be kept, they should be replaced with vectorized (SVG) versions. 0x0077BE [talk/contrib] 14:37, 30 October 2014 (UTC)
Remove Most - I agree it's bad style to have all those charts just plopped in the article like that. The cases/per day graph is certainly WP:OR. I say keep at most one graph to show disease progression. I can live with a weekly or monthly histogram or line graph to give a reasonable display of the WHO data. ZeLonewolf (talk) 15:15, 30 October 2014 (UTC)
Producing a weekly or monthly histogram would require interpolation, possibly incurring WP:OR. A variable bin-width histogram, derived directly from the data, would only require Basic arithmetic as per WP:CALC, but would essentially have the same shape as the cases/per day graph you consider to be WP:OR... -- Kirbett (talk) 15:52, 30 October 2014 (UTC)
Keep Most Keep them all except remove the last two country population graphs those don't seem to add much info (since Ebola has a history of sub-region concentration) and they clutter the presentation. I am also for format improvements and other suggestions. I am generally not a fan of wholesale deletion a lot of work went into these graphs. I generally prefer replacement and improvement unless the info is well covered in another WP page. IMO Greenbe (talk) 16:02, 30 October 2014 (UTC)
I don't know how much work went into these graphs, and it's more or less irrelevant, since the author didn't bother to make them SVGs, so they all need to be replaced by vectorized versions eventually anyway (and thus will all be "deleted", or at the very least taken out of the article and replaced with similar ones). That said, did you notice that two of the graphs are the exact same data, plotted twice, once with a linear axis and once with a logarithmic axis? Do you suggest keeping all four of those graphs? 0x0077BE [talk/contrib] 18:31, 30 October 2014 (UTC)
Keep tables of data with out these graphs are mostly useless. If graphs were removed and someone wanted to make sense of data they would have to do the same graphs themselves. If graphs are considered misleading then so is the data table they are based on. Data quality problems have been stated clearly enough, but its the best availabe so it has to do. — Preceding unsigned comment added by 89.235.242.231 (talk) 16:08, 30 October 2014 (UTC)
WHO is a primary source. Synthesizing data from datasets in primary sources is a form of original research. It's also very, very easy to make misleading graphs from raw numbers. Choice of axis position, choice of graph type, deciding whether to use logarithmic or linear axes - all of these can be used to create different stories using the same exact data, so making a graph is not really a straightforward calculation as required by WP:CALC. 0x0077BE [talk/contrib] 1:11 pm, Today (UTC−5)
Many articles use WP:CALC to present UN and WHO data. This is nothing new or exceptional. Frankly the graphs should be restricted to the most simple versions using linear scaling and straight counts (no log odds or anything wonky). Currently there are too many graphs, but there's nothing wrong with their source or creation. EvergreenFir(talk) Please {{re}} 18:33, 30 October 2014 (UTC)
I agree that WP:CALC can be used to justify the creation of graphs, so long as the graphs created are presenting either a standard way of representing the data in the field, or that there's a reliable, secondary source showing data presented in essentially the same way. Logarithmic axes, choice of offsets, choice of chart are all standard ways to present data, so there's no way to say, a priori what is "funky" and what's not. Presenting inherently logarithmic data on a linear axis is just as bad as presenting linear data on a logarithmic axis. Choice of axis scaling isn't identifiably "funky" but can completely change how data are perceived. Consider:
I represented the same data with three different choices of axes. The first one looks very dramatic, but the second one looks like it has a lot of wasted space. The third one has less wasted space and looks less dramatic, but I could essentially choose to make the slope of the line look like whatever I want it to if I am arbitrarily choosing the axis limits. The point is that without a "industry standard" ways of representing data, there's a lot of mundane choices that don't seem like a big deal that you must make that are not straightforward, which is why graphs can be tricky territory. I'm thinking that what we should do is remove most of the graphs and the data and replace it with text, then illustrate the text with graphs made in the same general style as those presented in reliable secondary sources with the same (or equivalent) data sets or otherwise analogous to industry standard representations. 0x0077BE [talk/contrib] 18:52, 30 October 2014 (UTC)
Although the first three comments on this RfC indicate Remove, none of them seem to be against retention of at least one or more of the graphs. Could I ask you to clarify your views please on whether you think the unreliability / incompleteness of the WHO data should disqualify the use of charts in this context? -- Kirbett (talk) 17:03, 30 October 2014 (UTC)
If reliable, secondary sources are making charts that are not dissimilar to those that are up there, I don't think there's an OR / reliability problem. I highly doubt anyone's showing the linear plot and the log plot, so it may be impermissible WP:SYNTH to be showing whichever one people aren't using (since showing a logarithmic plot of something that is generally displayed on a linear axis can be very misleading, as can the opposite). That said, whether or not they are reliable, a pile of unexplained charts and data is unencyclopedic, so whether we want to remove them because they are bad charts or whether they don't belong there, I don't know that it matters. 0x0077BE [talk/contrib] 17:53, 30 October 2014 (UTC)
Keep - As stated in the referenced discussions above, I consider it unrealistic to expect the general reader to be able to gauge the epidemiology of the disease just by reference to the tables (even an experienced epidemiologist would find that hard to do). The flaws in the data, reflected in the charts, are themselves noteworthy, being consequences of the disease itself. The charts should be retained, with sufficient explanations, qualifications and disclaimers to aid their comprehension. -- Kirbett (talk) 17:37, 30 October 2014 (UTC)
KEEP - Graphs make it easier to assimulate the date. I added a graph showing daily compounded growth rate which was removed. I am not adding it back unless the consensus here is to do so as I don't exactly know what the social norm is on wikipedia. However, it is definitely not original research, but WP:CALC. How can we possible understand the progression of the epidemic unless we see how it is progressing. Absolute numbers tell us less than the change in those numbers. I will wait and see how this discussion evolves before I undo the removal. Weanhall (talk) 18:17, 30 October 2014 (UTC)
First off, there are several reasons I removed your graph, but honestly we're having an RfC on this very topic, so you should probably wait until that's been decided before exacerbating the situation. Second, if you're making charts, make them SVGs. Third, just because something involves a calculation does not mean it's acceptable. I could produce hundreds of different charts showing various differences, derivatives, polynomial fits, etc, and tell my own story about what's happening. That's clear original research. If it's true that the only way to see how this is progressing is to see a chart of the time derivative of the growth, then you should be able to find some reliable secondary sources indicating that, as this is an incredibly well-covered story. Fourth, while graphs are useful, they are not a replacement for text. A huge unmanagable table and a gallery of various graphs with no explanatory text is simply not acceptable encyclopedic style. Graphs should be used to illustrate a point, they are not sufficient for making the entire point. 0x0077BE [talk/contrib] 18:24, 30 October 2014 (UTC)
Keep - As stated in discussions above (with references provided), many sources either copy graphs directly from WHO reports or make their own based on the WHO data. The graphs are included in those articles (BBC, Telegraph, Guardian, NPR, etc.) because they're helpful for understanding. Even the graph that looks most like OR / noise conveys useful information about the WHO data. So the graphs should stay... maybe not all of them. And maybe a longer description for each is needed. Snd0 (talk) 18:36, 30 October 2014 (UTC)
Keep I'm not sure how helpful the opinion of a non-involved editor may be but I felt my opinion could be somewhat useful. I come to this article on a regular basis out of interest for the topic, so my thoughts won't be skewed due to the amount of time I have invested in the project. The RfC asks whether the charts should be removed from the page, to answer concisely - absolutely not. Some of them are informative and do help the general reader make sense of the large table of information, but I think that the graph part of the page is congested. Is it necessary to have a log-scale and linear-scale graphs based on the same data? No. To simplify, it might be easier if their was just three or maybe four: 1: cumulative linear scale chart, 2: cases vs. deaths linear scale, 3: reported weekly cases and possibly 4: average cases vs deaths. Keep up the work though people, this article is a prime example of why I love spending time here XyZAn (talk) 18:48, 30 October 2014 (UTC)
Keep All statistics are subject to uncertainty and error. WHO is the definitive agency tackling this outbreak, their stats are likely more reliable than other sources. Robertpedley (talk) 19:22, 30 October 2014 (UTC)
Keep.. just a few of them.. drop the linear, Weekly cases & population tables.. In general Infections spread at a logarithmic rate... log tables shows the trending of the infections, Upward swing showing the disease taking hold, and downward swing shows doctors taking hold.. Linear tables dont show this properly... Any table that has interpolated values could be considered OR.. Gremlinsa (talk) 19:30, 30 October 2014 (UTC)
Exponential data presents particular problems when attempting to illustrate it with a graph. A standard linear graph may not have the resolution to display significant fine detail at the start of the graph, and it can be difficult to differentiate significant slope changes towards the end of the graph. A standard log graph solves both of this problems, and has the advantage of making clear the exponentiality (or otherwise) of the data - a straight line indicates exact exponentiality. The problem with the standard log graph is that many less numerate readers may not be familiar with the construct. The more numerate reader (I wouldn't say expert) would probably prefer the log graph. Which audience should the wiki attempt to satisfy? Or should it attempt to satisfy both by providing both graphs as now? I think, perhaps, this particular point should be discussed in a separate talk section. -- Kirbett (talk) 20:56, 30 October 2014 (UTC)
Remove charts, keep table (with disclaimer). "keep" voters seem not to be aware at all that the WHO itself is warning that its data is unreliable: That the numbers are off by a factor of two to three, and that major trends suggested by the data are most likely opposite to reality. Plotting the data and presenting it as if this were reality is misleading readers. Such plots make sense only to experts who know what they are doing. Presenting the plots with changed description or bold disclaimers is not a convincing idea either, because there is simply no valid use they could have for an ordinary reader. It would be the same as putting a bottle of acid with big warning on a buffet. Despite the big warning, it simply makes no sense to have such a bottle in such a context; at best, everyone will ignore it, but realistically, it will be mistaken for or misunderstood as a drink by the average absent-minded person -- if it weren't a drink, nobody would have put it there, right? Let's wait until the epidemic is over and reliable sources are available, containing professional post mortem analyses by trained experts who know about epidemics and stochastics and can make estimates for the real progression of cases and deaths. --rtc (talk) 21:37, 30 October 2014 (UTC)
Yes the data is crappy. We all know the data is crappy. Totals are way off and any apparent trends should always be regarded as suspicious. However, that doesn't necessarily imply that simply hiding the data would be better. Hiding what little data we do have is still likely to make people less informed not more. Dragons flight (talk) 21:52, 30 October 2014 (UTC)
We're not hiding the data. The data is in the table. If someone wants to plot it, he can do so for himself, well knowing he is on his own, and hopefully having read the disclaimers. However, if Wikipedia is officially presenting its own charts, that's something entirely different. People will assume these charts are there for a purpose, to nicely display the trends. They can only be misunderstood. Show 100 people those charts and then ask them what they saw. I can guarantee you, the majority will say "cases and deaths of the ebola epidemic", many will say "I don't know" and nobody will give the right answer "illusory trends caused by an increasing error term" I mean just look at the most recent Liberia data. The total number of deaths is actually decreasing. How can that be? 200+ Liberian Ebola victims rising from the dead? (SCNR) And that while the number of Liberian cases is surging like never before? The data is increasingly getting wild and nonsensical. --rtc (talk) 21:58, 30 October 2014 (UTC)
The fact that it seems like they are conveying different details using the exact same data is exactly the problem with misleading graphs and why very frequently graph creation is not simply WP:CALC-style calculation. I have almost never seen data that is sometimes plotted logarithmically and sometimes plotted linearly, particularly right next to one another. There's almost certainly an industry standard for how this is done. 0x0077BE [talk/contrib] 12:26, 31 October 2014 (UTC)
Maybe we're looking at it wrong. I thought about this some more...if the graphs showed the number of people sick at any given time, it would be a useful picture of the progress of the epidemic. But, it doesn't. It shows the cumulative number of cases/death. And frankly, the cumulative number at a given point in time just really isn't that meaningful to help understand the epidemic. So, I change my vote to Remove allZeLonewolf (talk) 01:50, 31 October 2014 (UTC)
Remove. I am more skilled than most in interpreting graphs yet I still find these to be worthless. Why? Because the raw data is worthless. WHO is relying on the governments of the affected countries to provide the raw data. Unfortunately those governments at present are not capable of providing accurate nor precise data. The last I checked both WHO and US CDC stated they actually "may" be as much as three times higher. Meaning that the actual multiplier could be different and in fact may not be a constant.
It used to be said that are three types of lies: lies; damn lies; and statistics. The data at the moment are so unreliable as to not be usable for any definitive purpose. If we must provide some information let's limit to the currently reported values.
And preferable semi-protect it so that people who can't, don't, won't or haven't read the talk page will leave it alone.Jaerik (talk) 04:56, 31 October 2014 (UTC)
Remove. As I have noted elsewhere, the problem is that the underlying data is known to be worthless; according to who, the actual numbers are about 3x the reported ones, and graphing the numbers as cases vs time is inherently misleading because that isn't what the data is anyway - it is when the cases were reported, which doesn't necessarily correlate with when people got sick. We saw a 2000 case jump in Liberia because they changed how they were getting their numbers so that they got a larger number of cases reported, but that was not because 2000 new cases had appeared in that time interval. As such, any graph or chart is going to be worthless and misleading to the audience, and we can't just multiply by three because, again, the Liberian numbers went up by 2000 not because there were 2000 new cases in that time interval but because WHO changed data sources.
We should keep the tables, but we need to make sure that they are properly labelled so that we note that the numbers are unreliable and that they are reported cases, not necessarily correlating with when they occurred. Titanium Dragon (talk) 05:45, 31 October 2014 (UTC)
Worthless? - I really don't like that word - it's a loaded word which, strictly, means, of no value whatsoever. I've seen no reports from WHO suggesting they consider the data they're reporting to be worthless. Quite, the opposite, in fact. They consider their data to be an important indication of the severity of the epidemic (else why publish the data?), together with a statement that the epidemic could be even more widespread than portrayed. And epidemiologists will be feasting on these, or similar charts, for years to come, trying to explain the many questions that the charts raise. In what sense of the word, is that sort of information worthless?
Misleading? - One look at the charts suggests to me that there is a raging epidemic in West Africa which is growing broadly exponentially, with no apparent signs of abating. Do the charts suggest that that is not the case? Do the charts suggest that there is no such epidemic? Charts are broad brush tools and minor leaps or reversals in the data may soon dwindle into insignificance on the charts given the nature of this epidemic. If WHO stats eventually start to capture and catch up with "real" cases and deaths, one can expect to see the charts leaping upward as they start to converge with reality, depending on how WHO chooses to record those changes. And there are in-your-face disclaimers on most of the charts which could be modified to highlight the speculated under-reporting. -- Kirbett (talk) 10:17, 31 October 2014 (UTC)
@Kirbett: The problem is that the charts are worthless; the increases have nothing to do with reality, they have to do with reporting methodology. All we're doing is graphing when cases were reported to WHO, which isn't a particularly meaningful number because it may have little to do with when the cases occurred. As such, the dates - an entire axis - has no real relevance to reality. When you graph two things, you're trying to show how they're connected; reported cases over time isn't really meaningful to graph because it doesn't really tell you about the epidemic as much as it does about the reporting methodology used, and as such it makes little sense in the article. The large spikes in the last couple sets of data are artifacts and not real, and as such graphing them along with the earlier data is also misleading because it implies that the two are more closely connected than they are in reality. We don't even have a good sense of the size of the error bars; the thought is that the range is between there and three times the previous numbers, but what about the new numbers? Does that still apply? Is it only 2x now? 1.5x? Titanium Dragon (talk) 08:36, 1 November 2014 (UTC)
In your interpretation of the meaning of the words worthless and meaningless, I think you're perilously close to applying a personal point-of-view to the subject matter, rather than just being prepared to document data which has been supplied by an officially competent secondary source. You're choosing to make a personal evaluation of the data as worthless and meaningless, while I believe that the correct wiki action is for the data, together with qualifications, to made available to the general reader, in a digestible format (i.e. charts), for him to make up his own mind on this matter. It is not the for the wiki to withhold information based on its assessment of the intelligence of its readership. If it were, there would be thousands of wiki articles, technical and otherwise, barred on the basis of being beyond the abilities of the general reader to understand. In addition, if you are making the case that the data is truly worthless, then you are making a case not just for the removal of the charts, but also for the removal of all of the numerical data as well and of any numerical assessment of the scale of the epidemic that does not lie within your perception of what the true figures are. My comment below, also applies. -- Kirbett (talk) 10:52, 1 November 2014 (UTC)
Keep graphs. If the WHO data are unreliable then remove the data. If the data are allowed to stay then nothing in any Wikipedia policy prevent me from representing them in any conceivable form. Ruslik_Zero10:02, 1 November 2014 (UTC)
For some reason or other which I don't understand, the Talk page citation list has suddenly appeared below. Looking at these citations, I find that this article - How many Ebola cases are there really? - is of particular interest. This is one of the two main sources cited by the Wiki article for the under-reporting, and hence for provoking this discussion. I recommend reading this article in its entirety. In it, the author asks and answers the question "If the numbers are that far off, should they be published at all? " as follows -
Even if many cases are missed, the trends in the numbers are still very meaningful. They clearly show that the number of cases has roughly doubled every 3 to 4 weeks and that this trend is continuing. If underreporting gets worse, however, it may be even more difficult to discern such trends.
@Kirbett. As you know I have agreed with and seconded you on multiple points throughout this page and still do. I checked out the article and IMO it is a good read and right in all respects ... except ironically the one you italicize above. That point is completely wrong IMO. WHO data do not show that the real number of cases have doubled in the last 3-4 weeks. These are cumulative data and the reported numbers could possibly be rising while the growth is falling (or any other combination of rising/falling you can think of). To illustrate, it is possible that they just received a batch of new data on 1000 cases in March, that would be added to the cumulative but does not say anything of recent growth rate. Why they do not break out new cases along with cumulative I do not know. However, despite this problem that is all we have and I am still strongly for keeping the data in the article and most of the graphs. We need to write a clear explanation on this cumulative issue just ahead of the data and let the reader apply some intelligence. At the core of the explanation needs to be the statement "rate of growth of cumulative totals could possibly be increasing at the same time the rate of spread of the disease is slowing". As soon as WHO or other researcher starts restating data from past reporting periods we should switch to that since it gives a clearer picture, but until then we serve the public best by including. I don't believe this is WP:OR or Primary source.Greenbe (talk) 22:21, 1 November 2014 (UTC)
@Greenbe. I take your point. It's evident that the author of the article would have been more accurate had he said,
They are clearly consistent with the number of cases roughly doubling every 3 to 4 weeks ...,
thus supporting (but not proving) the hypothesis of exponential-growth-to-date. This hypothesis is further strengthened by the fact that the three components of that data (Liberia, Guinea, and Sierra Leone) are all independently consistent with such exponential growth. The difference in rates of exponential growth that have been exhibited by the three sets of reported cases is an aspect which, I'm sure, will be being explored in depth by the epidemiologists. And I am sure that those guys are all watching the reported data (for what else can they watch?) very closely for any clear signs of the epidemic starting to abate.
@Kirbett Yes it does seem to me that it is still growing. However I think our warning disclaimer needs to be stronger since it is possible the BRN has fallen to say 0.95 and you would still be seeing thousands of new cases. If the WHO wanted to say "exponential growth" they could, but instead it seems they say "intense transmission" in the latest update. I think it is all about the semantics of the explanation of the data than the data itself.Greenbe (talk) 18:58, 2 November 2014 (UTC)
@@KirbettI was unaware of that source. So it goes the other way as well if you see further down this page apparently Liberia said the big jump was all old data. So the data could be levelling off but growth could accelerate if a batch of new cases are not in, or just slow in being diagnosed even. I think we need to characterize the growth based on this and other sources as best we can and separately explain the limitations of the data as best we can. I'll have a try at it later.Greenbe (talk) 06:22, 4 November 2014 (UTC)
I am not surprised to see apparent "flaws" and "discrepencies" in recent data - indeed, I would be very suspicious if reported data collected in these circumstances did not exhibit at least some such characteristics. The cause of those variations are for the WHO experts and others to speculate on, identify and explain, as they see fit. And it is for the wiki to report such speculation, where verified, in the context of the data to which it refers. -- Kirbett (talk) 13:53, 2 November 2014 (UTC)
Keep. If the data were not useful then WHO would not be publishing it. While I think we can all agree that the charts do not perfectly represent reality, they do correlate to reality. In other words, we are much better informed with these ball-park estimates than being in the dark completely. Trends and variance therein are just as important as actual numbers, if not more so. It's not up to us as mere wikipedia editors to decide that readers are simply too stupid to find any use in this data. LokiiT (talk) 21:40, 1 November 2014 (UTC)
LokiiT, the WHO/CDC et all aren't producing tables or graphs, only the reports. On the page right now, the cumulative death total has gone DOWN from the previous report. Clearly, it's an evolving situation and the past reports cannot be treated as a history. Are you really suggesting that we draw a graph where the cumulative death toll goes down? That doesn't make sense and it's a more extreme example on why aggregating and charting WHO data doesn't make sense. ZeLonewolf (talk) 14:37, 2 November 2014 (UTC)
Think of them like population charts. Just because every 5 years we have to go back and revise the population numbers for previous years doesn't mean the data is useless and we shouldn't keep population charts at all. The trend is what the charts are there to show, and a bit of volatility doesn't change the trend. LokiiT (talk) 19:37, 2 November 2014 (UTC)
If you think of population charts, think of trying to chart the population of China 4000 years ago. Remember, undercounting is estimated at 2.5, 3, or 5, and only those who approach the medical bureaucracy can be counted. The count is notable because it's widely reported, but we shouldn't present it as real without qualification. Art LaPella (talk) 22:10, 2 November 2014 (UTC)
The article states numerous times, both above and below the charts, that the actual numbers are estimated to be much higher. LokiiT (talk) 21:17, 3 November 2014 (UTC)
I'm glad it does, but I would also prefer the word "reported" in captions like "Cumulative totals of cases and deaths over time", and the accuracy doesn't compare to ordinary population statistics. Art LaPella (talk) 21:56, 3 November 2014 (UTC)
"The trend is what the charts are there to show" But that's exactly the problem! Let me repeat again: the WHO itself is warning that its data is unreliable: Not merely that the numbers are off by a factor of two to three, but also that major trends suggested by the data are most likely opposite to reality --rtc (talk) 07:55, 5 November 2014 (UTC)
@rtc I've been trying to find where WHO used the actual word unreliable with respect to its data, or said that major trends suggested by the data are most likely opposite to reality. Could you cite the WHO sources of that word and statement, please? I'd like to understand the context in which they were used, and whether they've since been superceded by later WHO briefings. -- Kirbett (talk) 12:46, 6 November 2014 (UTC)
@rtc It seems to me you're the one playing with words. There's a world of difference between the disclaimers used by WHO and displayed on the charts and the emotive words you're choosing to use to express your opinions. -- Kirbett (talk) 12:08, 7 November 2014 (UTC)
Nope, there isn't. The mere fact that the WHO is using disclaimers clearly shows that these charts need to go. --rtc (talk) 12:45, 7 November 2014 (UTC)
WHO's Virtual Press Conference on the 29 October 2014 addresses the question of the jump in Liberian cases - most of these were old cases because remember they got swamped a couple of months ago with a lot of new cases and just got behind on their data, so a lot of that is about reconciling new data ... that jump in cases is sort of a bolus of underreported stuff historically and the data getting caught up -- Kirbett (talk) 19:39, 3 November 2014 (UTC)
Keep Yes the data is incomplete but that makes the graphs all the more valuable. The WHO isn't picking numbers out of a hat, they are collecting data from a range of medical professionals, contact tracing, laboratory testing even posthumously (which is why deaths can go down), and it is doing so **consistently**. As such the actual numbers may well be out by a factor of 3 in some cases but the change over time is meaningful. Furthermore when case numbers started to approach 0.1% of the population in Liberia we can clearly see a difficulty in keeping up with the case reporting which is only corrected weeks later, something that is hard to gauge from the numbers alone. (Sorry wasn't signed in) Kactusotp (talk) 01:10, 6 November 2014 (UTC)
Keep. The problem that unreported cases go unreported and therefore the data is in a strict sense wrong applies to all statistics. It does not make the data worthless, but harder to interpret. Everybody seems to agree that Liberia's reporting capability has reached a limit and is currently a source of bias. If WHO or somebody else comes up with a solution how to get better data, fine. If not this is the best data available. It sure helps when we explain these facts. But I don't get why restricting the presentation form should help. The big question everybody asks is "What's the slope? Is it still exponential?" and a graph answers that question. Stupid girl (talk) 12:31, 6 November 2014 (UTC)
Prevention section
Latest comment: 9 years ago4 comments3 people in discussion
It seems like the section titled "Prevention" is primarily about preventing the spread of the epidemic, rather than measures to prevent the disease in a given individual. Hence it might be better to change the section title to something like "Containment" or "Prevention and Control". 67.188.230.128 (talk) 17:03, 7 November 2014 (UTC)
Agree, especially as this article is about an epidemic .... so the implication is that the section is about prevention of an epidemic. I propose "Containment and control" Robertpedley (talk) 18:30, 8 November 2014 (UTC)
Yeah, we shouldn't do that. The page is about all sorts of responses, not just about humanitarian ones, and frankly, the other responses are just as (if not more) important. Titanium Dragon (talk) 07:02, 7 November 2014 (UTC)
Gandy - 2 sections which are currently small would not belong under the revised title.
(1) "Measures to protect national security". I think I said this a while back - there are 196 countries in the world and a large number of them have some kind of advisory or visa restriction. The article would become swamped if every one of them gets a mention (I can see that someone has added a large but incomplete list into this article!) - and its not relevant to the epidemic in west africa. So I don't propose to replace it anywhere.
OK, first, I deleted that new addition to this article. I can't see where we should be working so hard to keep this article within bounds and add all that. As for the Response article I trust your judgement and will support whatever you decide. "Countries bordering the affected region" could be added here, working it into the three countries sections...or skipped. IMO we need to keep in mind what the general reader is interested in, and I doubt that they care whether or not exactly what border is open or closed, etc. — Preceding unsigned comment added by Gandydancer (talk • contribs)
Can't make up my mind...I used the Haiti earthquake as an example above - of course no one closed their borders to Haiti after the earthquake so the current scenario is very different, and there's a case for recording all asspects of the response. I'll leave it for now. Robertpedley (talk) 19:39, 9 November 2014 (UTC)
Timeline errors
Latest comment: 9 years ago4 comments2 people in discussion
In the absence of a report for SL from the governments i cannot correct the 2 Nov dates as well as an error on Liberia report for that date. I have updated the previous reports as per governments as WHO have drop all SL all suspected and possible death. Used the numbers from the governments and OCHA. Will continue to try and update as best as possible. BrianGroen (talk) 06:15, 8 November 2014 (UTC)
what if we shorten the table to just the last 10 "sitreps" and place the rest in archive with the hidden collapsible table it isn't a complete solution but at least we could get these erratic numbers behind us quicker, also we could go directly to the health ministries site of each country, bypass WHO completely?--Ozzie10aaaa (talk) 14:02, 8 November 2014 (UTC)
Hi Ozzie10aaaa thought about that too, but the main problem is the latest figures n SL :about 400 difference in deaths . I can get a report for 7 Nov and 2 Nov but none for 4 Nov with probable and suspected deaths . But that said the report has been done as the pdf numbers indicate oon the "sl gov" site but just not published. The Who report for 4 Nov have no suspected or probable deaths. I could add in the 6 Nov numbers to it but somebody will question it... hoping it will come online Monday.. greetings Brian BrianGroen (talk) 16:34, 8 November 2014 (UTC)
Latest comment: 9 years ago1 comment1 person in discussion
Hi all i have ask for a semi-protection due to vandalism.. we have two weeks .. so keep an eye out in two weeks.. Greetings Brian BrianGroen (talk) 18:58, 10 November 2014 (UTC)
Thanks Brian. Robertpedley (talk) 12:15, 11 November 2014 (UTC)
Daily growth
Latest comment: 9 years ago27 comments15 people in discussion
In the big table, I assumed the new "% Daily growth" field was growth in the number of deaths not cases, because the field is next to the "Deaths" field and not by the "Cases" field; also because the heading is black, which matches the "Deaths" and not the red "Cases" field heading. However, a calculator shows it's a daily percentage of cases. So I suggest moving the field and making the header red. Art LaPella (talk) 02:41, 16 October 2014 (UTC)
I think we should slowly start moving away from this table. These numbers are not accurate, they're just what the governments are posting. Liberia is collapsing and Sierra Leone is not far behind. Even the WHO said there was major under-reporting in these countries. I think we should remove the % Daily Growth, only because this is only a show of the numbers in the report and how they change. This is NOT an accurate portrayal of how the virus is growing. Realistically, these numbers should be increasing. There is NOT a decline in cases OR deaths in West Africa, just a decline in reporting. AmericanXplorer13 (talk) 03:18, 16 October 2014 (UTC)
Which is why I liked the previous section heading "... reported cases and deaths". The table heading should also say "reported", and I don't know what pages of statistics are accomplishing compared to other things that were spun off into subarticles. But if we keep the Daily Growth column, please fix the heading. Art LaPella (talk) 03:32, 16 October 2014 (UTC)
Do we have reliable sources to back up the claim that there are lots more cases in Liberia, and that the rate of infection is growing? People seem to base these claims primarily on articles coming out a few weeks ago.John Pack Lambert (talk) 04:42, 16 October 2014 (UTC)
This report is indeed a few weeks old. Are you implying that everyone dying in Liberia lately makes sure they get counted, even if they can't get into a clinic, just because reporting difficulties aren't reported weekly? Art LaPella (talk) 05:07, 16 October 2014 (UTC)
There is underreporting in Liberia [10] and some of it may be intentional [11]. I mostly agree with AmericanXplorer that the table should be moved away from, or at least make sure the wording associated with it is deliberate (as Art suggests). If the epidemic unfortunately goes at the rate that the WHO expects [12], the gap between what's true and what's reported could become pretty large. Snd0 (talk) 06:28, 16 October 2014 (UTC)
The Daily Growth column is likely to be more accurate than the underlying declared statistics, in that even if the underlying figures are underestimates, the growth is likely to be more similar to that of the real (unquantifiable) stats. That's just the nature of statistics - it deals with approximations all the time, so I see no reason, on that basis, to discount the Daily Growth column.
That said, Daily Growth could give an unduly optimistic picture of the situation to those less familiar with the effect of the compound growth that has been evidenced by the epidemic so far. Dare I suggest that, to the layman in the street, a daily growth of 1.4% could feel more like an annual growth of 1.4 x 365 = ~500% annual growth, rather than the >15000% annual growth that it actually represents. (Just as an aside, a daily growth of 2%, when compounded, would amount to an annual growth of >130000%!). Nevertheless, I accept that citing an inferred annual growth could be viewed as unduly pessimistic and alarmist - "true" though it might be. Personally, I believe that more people and governments need to be seriously "alarmed" by the epidemic's potential, but that's my POV and therefore not appropriate for the wiki. Kirbett (talk) 17:52, 16 October 2014 (UTC)
Yes and no. If the statistics represent only those who the clinics have room for (and I don't know to what extent that is true), then it isn't an approximation like the approximate population of countries. It would be more like estimating the population of France by counting people in Paris. That is, it would be a better representation of growth in the number of beds provided, bearing no relation to how many people may be dying outside, waiting to get in. Art LaPella (talk) 18:52, 16 October 2014 (UTC)
Daily growth would give useful data, if under reporting factor stays more or less stable over time. If however there is a bottleneck somewhere in reporting, then all that is reported is capacity to report new cases, without any relation to how many cases there really are. Its quite likely the latter is the case.194.126.122.67 (talk) 09:14, 21 October 2014 (UTC)
I second moving away from Daily Growth for a different reason. I've been reading a lot trying to learn more about base regeneration rate sometimes written as Ro or R(t). There is recent data in published paper (through a few weeks ago) estimating it for the three major countries. The R(t) fluctuates over time and seemed to be actually declining. http://www.eurosurveillance.org/images/dynamic/EE/V19N36/Nishiura_fig2.jpg It is not a straight a/b calculation you have to use eigenvalues of matrices or other statistical methods and it is changing significantly over time. So I think unless we find at least two reliable sources that conclude that Daily Growth has significant meaning in an ongoing epidemic I think we have drifted slightly in to WP:OR territory and should shy away. R(t) may be better but I have not been able to find a clear explanation of the true meaning and implication so far. That being said, I really like this table I find it very valuable and sobering information at a glance.Greenbe (talk) 23:39, 16 October 2014 (UTC)
Suggest we align the growth rate not on daily but on time line dates i.e 1.4% should therefore read 7.3% , giving a better picture. Title should read growth rate and not daily and in red referring to cases..just my opinion.. gives you a better picture IMO greetings Brian BrianGroen (talk) 05:21, 17 October 2014 (UTC)
Please clarify what you mean by "time line dates". 7.3% refers to the growth over the last 5 days of the table. If you're referring to the intervals between different rows of the table, then these vary widely. Any stats based on these non-uniform intervals would be incapable of being interpreted without simultaneously referencing the intervals themselves, row by row. Kirbett (talk) 10:20, 17 October 2014 (UTC)
I think the growth rates could be normalized to weeks synchronized to the WHO definition of week number of the epidemic. This would smooth out the fluctuations in the %. However that would require me to pull it into Excel and run a normalizing regression if the report dates don't align to weeks - isn't that WP:OR? Regeneration rate is the only way to know if it is growing - that is the number of new infection each case generates, and the rate varies weekly. Deaths could be growing rapidly while regeneration is declining below 1. Greenbe (talk) 01:44, 18 October 2014 (UTC)
I don't know. What I am thinking is a little more complicated than a simple calc, because it seems the reported dates don't align with epidemic weeks exactly (a few days off here and there). So you would have to figure out the compound daily growth from report to report then normalize it back to weekly smoothed average and you would have to make some decision about the smoothing window over several weeks. Anyway just an idea if anyone wants to take a crack at it to see if it reduces noise and makes a clearer trend (whether increasing or decreasing).Greenbe (talk) 22:34, 20 October 2014 (UTC)
My 2cents - The Daily Growth numbers are interesting and informative. I was calculating them by hand until they were added to the table. They should be kept. None of us (unless you are actually in West Africa) knows anything beyond what is being reported. Perhaps there is some under-reporting, but is it better or worse than the previous under-reporting? Further, since this disease has a ~70% fatality rate, the under-reporting has some bounds: if, for example, there were actually, 50k infected, we'd be seeing mass quantities of corpses that would be difficult to hide. Some under-reporting, yes. Delayed reporting that makes the measured stats noisier than reality, absolutely. Still, sans conspiracy theories, the reported data likely tracks the real ground truth within some bounded percentile factor. And in any case, it's the best that can be offered. — Preceding unsigned comment added by Ddopson (talk • contribs) 03:44, 19 October 2014 (UTC)
Mine as well, i have a doctor friend in the area of Liberia and it is bad, .. Just the other day Liberia requested 160 000 body bags(must be a reason for that ; was in a news report will try to find it..The under reporting may be way higher than 2.5. In SL patient are being treated at home (most die) and are not included in most stats... BrianGroen (talk) 05:36, 19 October 2014 (UTC)
Hi Art Art LaPella their was another news item , but i think the reporters switch the two around somehow.. cant find it now but it was 160 000 body bags and 5000 hazmat suits.. Reportes yikes...This one sounds more correct.. BrianGroen (talk) 05:43, 20 October 2014 (UTC)
Re the true case rate, I ran across a statement made by MSF where they figured that the reported cases are only 20% of the true number of cases/deaths. I have looked for the report I read, but I have lost it. It does figure that it has become worse than the WHO's old report of 2.5 that was made before the epidemic seems to have run totally out of control. Gandydancer (talk) 11:32, 21 October 2014 (UTC)
Re. the reported cases being only 20% of the true numbers: This transcript of an interview with Dr. Joanne Liu, President of MSF, quotes her as saying: "...but it’s difficult to get a reality check about what is the magnitude of the epidemic when we just look at some of the cold figures or think 'Oh, 4,700 people infected, about half of them died - well, compared to other context it is not that bad' - but the reality is that this is only the tip of the iceberg. First of all, we know that the figures underestimate it, we have only 20% visibility of the number of cases...". Here is that interview on YouTube. The interview was on 22 Sept. So, if the true total number of cases really was 5 times higher than the reported number - and the total number is doubling every 3 weeks - then, by 03 Nov, the actual number of cases would stand at 94,000 (4,700 x 5 x 2 x 2). Does anyone really believe that the true number of cases will be anywhere near that on 03 Nov? Back in September, I suspect that the health and medical agencies were stating worst case scenarios in order to provoke western nations into action. Stanley Oliver (talk) 22:01, 28 October 2014 (UTC)
OK, maybe she exaggerated. Maybe she didn't. 94,000 right now would be an undercount ratio of 8. In the absence of good data, is 2.5 in August, 5 in September, and 8 in October as good a guess as any? Art LaPella (talk) 22:47, 28 October 2014 (UTC)
I think this table should definitely be kept. It is usually more up to date than the CDC page or the WHO page. Otherwise, I have to go to the individual health ministries myself. One note: I don't think the % daily growth is calculated correctly. My intuition is that the number is the daily compounded growth for the period of days between the two rows. I am not sure what it is now, but it isn't that.Weanhall (talk) 20:44, 28 October 2014 (UTC)
Agree, calculation problem. More specifically: The only way to get the current rate to come out to 4.1% is to calculate 12,008-9,936=2,072; 2,072/9,936=0.2085; 0.2085/5 days=0.0417; truncating instead of rounding gives 4.1%. Compounding would require about 3.7%. The linear calculation matches the figures at the top of the table, but then October 5 comes out 1.8% not 1.7%, and then September 21 and everything older comes out higher than the given percentage; perhaps they were calculated with compounding. Art LaPella (talk) 21:34, 28 October 2014 (UTC)
Outbreak slowing down in Liberia - not in article?
Latest comment: 9 years ago14 comments11 people in discussion
Not sure if there's a reason this information has not been included in the article?
'Dr Christopher Dye, the director of strategy in the office of the director general at the World Health Organization, has the challenge of predicting the spread of Ebola.
"Things clearly have changed with respect to the trajectory of the epidemic," he told the BBC News website.
"What we've seen is, very clearly, a slowing down in the some of the affected areas in the three countries."
Dr Dye added: "When we look at the total epidemic now, with the best information we have got available I would guardedly say that the case incidence per week is not going to get larger than it is at the moment, so around 1,000 cases per week.
"In terms of the trend of the epidemic, it is possible it has flattened out.
"We know there's under-reporting so we have to emphasise caution, but broadly we're out of this big epidemic growth phase seen in August and September."
I just spoke to a contact in Liberia. He told me that the numbers (WHO statistic) are based on the urban regions. People are running away from infected areas to urban regions, so a new outbreak can easily start in these urban areas. There is also a serious outbreak in Grand Kru County now. The next Treatment center is 18 hours drive away. Malanoqa (talk) 22:24, 8 November 2014 (UTC)
Here is your answer and has been reported in many newspapers...[14].. Patient are no longer going fir treatment and rather go into hiding..We saw the same slump in Guinea only for it to flame up again. BrianGroen (talk) 05:17, 9 November 2014 (UTC)
I've now had a chance to read all of the suggestions above and several others as well, and I am thinking that this information could even go into a new section. One need not be African to understand the concept of the importance of burial ritual. My son-in-law recently lost his father and the family spent many thousands of dollars on the funeral. When their dad died the family washed his body and dressed him in his military outfit ("Dad held three things most dear: Family, God, and Country", my son-in-law said). Speaking at the funeral he spoke of his dad sailing off with the family all waving goodbye as the ship disappeared over the horizon and then of the ones who had preceded him waving hello on the other side. Just imagine if instead his body had just been taken away in a body bag never to be seen again and without even a grave site to visit.
One of the sources suggested a memorial site for the dead so at least the friends and family could have a place to go to remember their loved one. Think of, for instance, what a profound experience it is for friends a family to visit the Vietnam Memorial where it is not uncommon to see people sobbing with emotion. The only recent very large numbers of dead that were not allowed a "proper burial" is perhaps during the Bosnian war and they continue to hunt for the bodies. Whether or not the burial issue is related to the death toll numbers (and I'd guess it is), we should have a section about it. Gandydancer (talk) 14:11, 9 November 2014 (UTC)
Gandydancer, Agree too... Burial rituals are important in every religion and region of the world.. A section covering the issues with the locals (there are bits all over across the pages, and a consolidated piece sounds good).. Gremlinsa (talk) 07:27, 10 November 2014 (UTC)
The information about whether or not the rate of growth is slowing in Liberia is well covered in the last paragraph of the Liberia section. Didn't check when those edits were made, but it seems to be well covered right now IMO. I think that is the best place for it. I might add a small word about it in the Rate of Growth subsection of Timeline, later onGreenbe (talk) 02:19, 12 November 2014 (UTC).
Semi-protected edit request on 11 November 2014
Latest comment: 9 years ago4 comments4 people in discussion
Edit looks good. I would like to point out that the relevant information on R(t) may be more important than Ro for Ebola. I encourage those interested in the topic to try to find more and better sources of research on this. Why? Ro is essentially R(t) at t=0, or a characterization of the inherent rate at which a disease spreads. For example, flu has Ro>10. I haven't found much good explanation yet, but my understanding cobbled together from a bunch of reading is that for something like flu the R doesn't change much over time since we don't take many effective countermeasures. But for Ebola it seems that it does change over a number of weeks often starting near 2 and then declining well below 1. I don't know exactly why but it seems to me that the most effective countermeasures is aggressive contact following (see Nigeria). So once you realize you have a local outbreak and get organized to do contact following you push R(t) downwards. Doesn't mean that BRN/Ro is not valid, just needs to be in context of R(t).Greenbe (talk) 02:38, 12 November 2014 (UTC)
||Greenbe - too technical for this page Robertpedley (talk) 21:00, 12 November 2014 (UTC)
Reduced archived numbers
Latest comment: 9 years ago4 comments4 people in discussion
Hi all just checking, can i reduced the archived numbers on the timeline to bi weekly basis. will reduce the notes considerably and clean up the section. greetings Brian BrianGroen (talk) 19:59, 12 November 2014 (UTC)


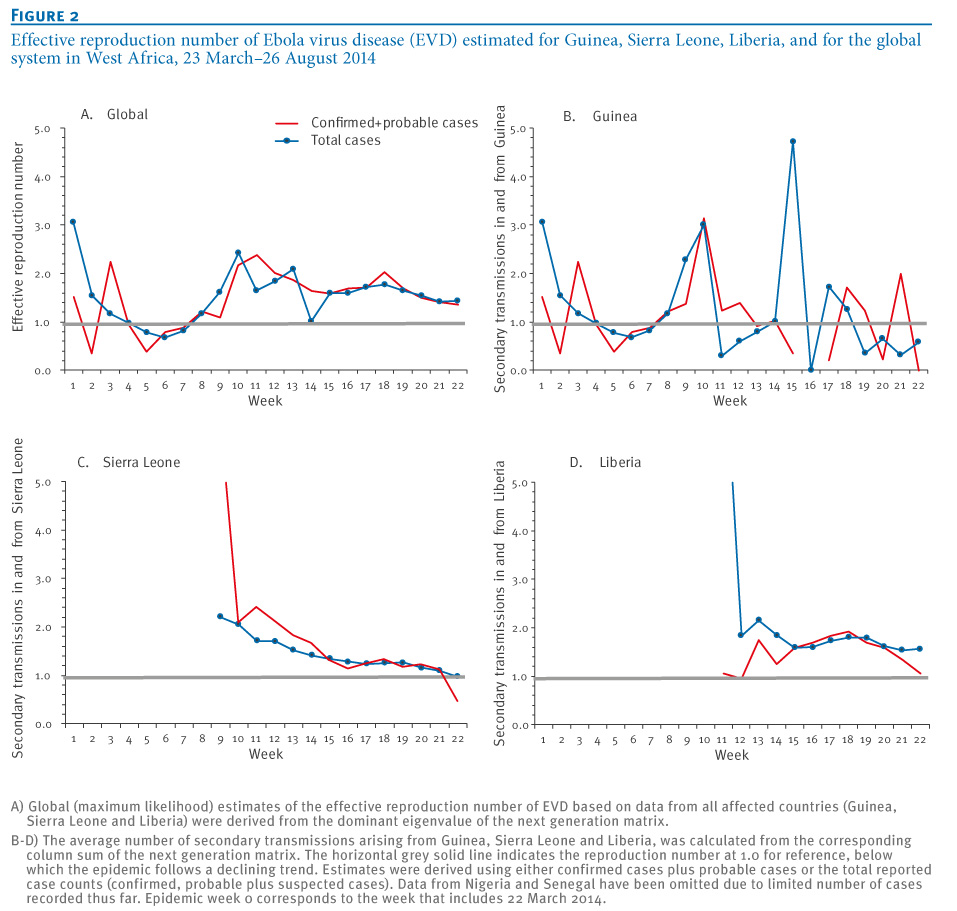

 Done by BrianGroen. Stickee (talk) 23:38, 11 November 2014 (UTC)