Wikipedia talk:WikiProject Maps/Archive 2010
| This is an archive of past discussions. Do not edit the contents of this page. If you wish to start a new discussion or revive an old one, please do so on the current talk page. |
| Archive 2005 | ← | Archive 2008 | Archive 2009 | Archive 2010 |
Coordinates format
 Done - asked for comments, done. → to archive Yug (talk) 06:24, 16 February 2010 (UTC)
Hello, I have traveled from WikiProject Geographical coordinates, where we seek wider opinions on whether {{coord}} should offer a N/S/E/W labeled format for decimal coordinates (example: 43°07′N 79°20′W / 43.12°N 79.34°W) either as an option or by default, or if the existing unlabeled format (example: 43°07′N 79°20′W / 43.12°N 79.34°W) is sufficient. Please comment there if you have an opinion on this. Thanks! --GregU (talk) 17:43, 17 January 2009 (UTC)
Question about locator maps
Extended content
|
|---|
|
{{{1}}}
|
- Done - asked help for template {Location map |USA |lat=37.0 |long=-110.1 |width=280 |caption=txt |alt=txt}, done. → to archive Yug (talk) 06:26, 16 February 2010 (UTC)
Locator maps: Need update
Extended content
|
|---|
|
Hello, I seen that the maps on the project page are not all up-to-date, some have a mistake in the orange value. I'm looking for up-to-date Locator maps. I found this :
but none is following the colours conventions. Indeed, they use a #D40000 red õ___O, the conventions never talked of this red. And same for the blue. I guess that all the map colours are not following the conventions.
...also don't follow the conventions on the red area for the Indian map, and on the orange AND red area for the Texas one. May someone correct them ? Or can I do so ? Yug (talk) 14:43, 24 January 2009 (UTC) I don't think we need to change anything for the moment. We don't have a deadline, and I think the effort should go into creating needed maps first before correcting colors in existing maps. In case a map has incorrect information the first place, then we should correct those maps and then make the colors follow the de facto convention at the same time. --seav (talk) 03:56, 25 January 2009 (UTC)
|


- - notice unconsistant map styles: not managed. Need harmonization. → to archive Yug (talk) 06:29, 16 February 2010 (UTC)
 Stale
Stale
Projection
Extended content
|
|---|
|
{{{1}}}
|
Summary: Question of the Projection used for the maps.
- Follow Usage: Follow usages by the German team for their (great) Location maps.
- Equirectangular: Mainly Equirectangular, except for poles. Since distortion become enourmous near poles.
- Exceptions & stretching: German map makers also stretch certain maps, or use specific projection to fit better large and famous countries/area (USA, Russia, China, Europe, Africa). → please, FOLLOW the GERMAN TEAM.
- Done - done. → put summary points in the map convention → then archive. Yug (talk) 06:38, 16 February 2010 (UTC)
GIS map formats
I would like to start a discussion about the possibility of bringing the GIS file formats into consideration for being the preferred medium of mapping data. Unlike SVG, which is a simple vector graphics file format, GIS file formats include geospatial and other data. The inclusion of this data could open up many possibilities for better integration of cartographic information with the other templates on a page, like linking the coord tag to a specific GIS data file, and who knows what else. I think there are people out there with the expertise in GIS to make this happen, if just a few people get the ball rolling. What do you guys think? GML (it is open and appears good, but is not widely supported)? ArcGIS formats (the Shapefile format is supposedly open, but not very good)? Int21h (talk) 22:48, 12 February 2009 (UTC)
- A so big question. Who will lead this ? Yug (talk) 08:20, 14 February 2009 (UTC)
- I think a STRONG & CLOSE collaboration with OpenStreetMap project (already using GIS) would be easier and more constructive. I requested a basic fearture, but I hope somes boss will involve the wikimedia foundation, to move to a STRONG & CLOSE Wikimedia-OpenStreetMap collaboration. Yug (talk) 08:22, 14 February 2009 (UTC)
- I'm not sure I understand this request, I think many of us doing maps already use GIS, but as far as I know Wikipedia isn't capable of displaying any GIS file formats directly - we still need to convert to SVG or PNG to display the maps. If you mean compiling a list of GIS sources, I agree that would be useful, I thought we already had one started, but just went looking for it and couldn't find it. Kmusser (talk) 07:39, 17 February 2009 (UTC)
- I think it was a list of sites you linked to in a talk page discussion a couple years ago? It would be good to have a huge list of resources map makers can use though. vıdıoman 07:54, 17 February 2009 (UTC)
- Perhaps, I have my GIS sources listed at User:Kmusser/Sources which could be used as a start. Kmusser (talk) 17:04, 17 February 2009 (UTC)
- I think creating a mechanism for direct use of GIS data would be optimal, but even a formal list of map sources (as in actual data, not links to data) would be a start. This would allow for easier auditing/verification of maps; at current it is difficult if not impossible to do so, even with visual comparison. (Again, I think this is just one benefit.) We could add support for conversion from GML to SVG on the back-end, possibly through the use of a XSLT. Granted, this might require MediaWiki patches/modules, but so be it; that is not so different from creating templates. I think now that GML has become better supported (I think ArcGIS even supports export to GML) it would be a good candidate because it is XML and so is SVG, which should make finding an properly licensed XSLT/XQuery transform easier. Int21h (talk) 18:46, 24 February 2009 (UTC)
- Having ready-to-use GIS data available on Commons would be a great gain of time in several cases for many map creators here. I was thinking about it some months ago on WP-fr but I let drop the project because there was the problem of a free format (for DEMs and vectors). I don't know if we can create a general data bank which would take a huge space on the servers, but some data would be very helpful for those who don't handle easily these software, like for example a map of the world, may be in different scales for different uses, with corrected and up-to-dated international boundaries (the ones from the WDBII are... quiet old!) and cleaned shorelines forming closed polygons (this will allow to create easily world maps with other projections or with specific central meridian), cleaned SWBD data as lines, etc.
- About GIS data resources, you can check on WP-fr the list I made to help our Wikicartographers to find data for their maps. It doesn't pretend, of course, to be complete but it lists the most important links which give access to free data and permit to draw almost all of our maps. I hope you too here will find it helpful. Sting-fr (talk) 23:26, 24 February 2009 (UTC)
- SVGs are fine for articles... maybe a GIS file as a form of metadata? But when choosing a format, we can't assume that everyone has access to an ArcGIS suite. It sounds like this data would be downloaded from the Commons and used, not manipulated online, so a format that is used by good, open, multi-platform GIS software would be nice. Spike the Dingo (talk) 15:52, 6 January 2010 (UTC)
Announcement: real OpenStreetMap integration into Wikimedia projects
Extended content
|
|---|
|
During the recent (April 4) MediaWiki Developer Meetup in Berlin, members of the MediaWiki and OpenStreetMap developer communities met up to discuss the integration of OpenStreetMap into Wikimedia projects, especially Wikipedias. Note that this is not the simple case of making screenshots of OSM maps and uploading them as static image files as suggested by the dormant WikiProject OpenStreetMap. This involves setting up a dedicated map toolserver under the supervision of Wikimedia which will grab the latest OSM map data regularly and render maps possibly on the fly. The central page for this coordination is at meta. Please go there and give your inputs. This is also the time to coordinate the development of the map "stylesheets" so that OSM-derived maps will look like the maps we have been creating for Wikipedia. --seav (talk) 01:43, 6 April 2009 (UTC)
|
- Done - Wikimedia / OpenStreetMap collaboration to display OSM maps within wikipedia articles. → meta:OpenStreetMap (see more - page not update) Yug (talk) 13:26, 17 February 2010 (UTC)
How to tag inaccurate maps?
- Done done, link broken. Yug (talk) 07:35, 16 February 2010 (UTC)
Please see my proposal for a map-related dispute templates here.--Piotr Konieczny aka Prokonsul Piotrus| talk 16:59, 12 April 2009 (UTC)
Featured countries
- Done - request done in December 2009. See upload logs. Yug (talk) 13:27, 17 February 2010 (UTC)
Hi, could a user with sophisticated ability in dealing with maps have a look at  ? It hasn't been updated in a year, and no longer reflects which countries are featured articles or not. There are comments on the file's talk page, and in the list of featured and good articles on WikiProject Countries' main page. YeshuaDavid • Talk • 21:14, 13 June 2009 (UTC)
Political division maps

When depicting national subdivisions, is it recommended to omit other countries (e.g., File:Bouches-du-Rhône-Position.svg) or include them (e.g., File:Basse-Normandie locator map.svg)? --Article editor (talk) 00:05, 15 December 2009 (UTC)
- I don't think we have a standard for that, I prefer including them. Kmusser (talk) 03:43, 15 December 2009 (UTC)
- Note: “ Don't wipe out your neighbor ” : a talk took place on the French Graphic lab on this matter. The consensus was something like : "we are not a country administration, our maps should not wipe out neighbor countries". But for administrative maps, that's a special case, where both are 'acceptable'. As cartographers and wikipedians, the German and French teams have moves toward the trend shown on the right picture. Regards, Yug (talk) 18:54, 17 December 2009 (UTC)
- I posted about this below, but I believe we should always include neighbors, and ideally their names as well. --AW (talk) 16:57, 4 February 2010 (UTC)
- Note: “ Don't wipe out your neighbor ” : a talk took place on the French Graphic lab on this matter. The consensus was something like : "we are not a country administration, our maps should not wipe out neighbor countries". But for administrative maps, that's a special case, where both are 'acceptable'. As cartographers and wikipedians, the German and French teams have moves toward the trend shown on the right picture. Regards, Yug (talk) 18:54, 17 December 2009 (UTC)
HELP! Colonial maping of Spanish Empire
Hi, (this was a message to User:Roke who has become inactive apparently which my friend tried to ask)
I noticed you have created maps of colonization of the great powers and created individual stills throughout history of all of them controlling the world such as this one and would like help. I am trying to created a detailed motion map of the Spanish Empire and its claims and I need good sources of information. I am having trouble getting information on how they got to the interior and when they breached as far as they did at certain points. Wikipedia is not being very helpful as they only list a few forts or cities and their foundation or saying that so-and-so sailed here and there without actually telling me what masses they claimed. This would be much appreciated!
If you can't help me can you lead me to a Wikipedian who could?
(Please answer question here.) asked by Maps & Lucy on the Commons where you should contact her. contacting her via File:LN member states animation.gif which she up loaded recently and is in use already.
TRANSFERED BY: Vadac (talk) 01:00, 21 January 2010 (UTC)
- I can try to help with specific questions. Spanish claims are fairly easy as almost all of them were derived from the Treaty of Tordesillas by which they claimed all of the Americas except Brazil. How far inland they really colonized is a much more subjective question and finding sources may be tricky. Kmusser (talk) 14:25, 21 January 2010 (UTC)
Locator maps without context


Something I notice a lot is that most locator maps are created without any context -- the district or city is just floating in space with nothing saying what's around it. The top map of Parwan province, Afghanistan is an example. It's better than many in that there's an inset and there are borders of other districts shown, but nothing says what those districts are. The bottom map of Akita Prefecture is another problem: it has the names of nearby districts, but no borders. Neither are particularly helpful. Are there any guidelines for this sort of map? Ideally the maps would have both borders of nearby areas and their names. --AW (talk) 16:58, 4 February 2010 (UTC)
- First, “ Don't wipe out your neighbor ” is widely accepted by 'confirmed' mapamakers on wikipedia. We already talked about that ;).
- Second, The conventions are tools that you can combine to create your map following your needs. /
- Here, you are actually looking for the location map conventions, with labels, and with one enlighten area.
- My advice is to use the location map of the area (provided by the German map makers). Then, enlighten the topic area and add the labels following the same Location map conventions.
- NB: Location maps are 90% of the time blank of text, because we now increasingly add labels using complex templates such as {template:Location map+}. To explain it, if you create label-blank location maps and use complexe templates, then, one location map may be used in several different articles, and by many wikipedias of different languages. In the ẃikipedia world, this is believed to be more sustainable since EVERYBODY can translate a template/wikicode, while just few can edit SVG maps and upload the translation to commons.
- But you can also add labels within the SVG, that's simply faster if you know how to edit SVG.
- Regards, Yug (talk) 08:09, 12 February 2010 (UTC)
-
 1st: Portugal location map.svg
 -
 2nd: Portugal administrative map-fr.svg , derivate and expansion of a Location map.
 -
 3rd: other example of labelled Location map


Map conventions and Map Project | |||
|---|---|---|---|
 | Conventions set |  | |
| Drafts | |||
| Others |
| ||
Proposal for blank maps
I have been noticing for some time now that all the blank maps have no standard for their coloring. If there is some consensus I have missed, please let me know. But since there doesn't seem to be a standard that I can find, I thought I would like to do something.
| Colour | Colorimetry ( hex / RGB ) | Used for | ||
|---|---|---|---|---|
| B | Black | #000000
R:0 G:0 B:0 |
Border | |
| Grey | #c8c8c8
R:200 G:200 B:200 |
Area | ||
| Light brown | #ffffff
R:255 G:255 B:255 |
Water |
This idea is only for blank maps such as File:BlankMap-World6.svg. I believe the borders should be black for two reasons. The first being to differentiate between water and borders. The second reason is because of smaller bodies (such as island nations), in which their outline covers their area to the point that you couldn't find it in Inkscape. If there is a predetermined reason why the borders are the same color as the oceans, please let me know. —NuclearVacuum 19:21, 11 February 2010 (UTC)

- First, this file is basically a TOOL to generate general colored world maps such as on the right. There, borders lines are not visible neither meaningful (the color and area make the meaning).
- Second, we actually already have such conventions with 'dark borders', see our Location maps convention, or derivate works such File:Nigeria_Bayelsa_State_map.png. This widely spread style come from the German Location map project (really active), have been systematically used by the French team and by part of English mapmakers. I believe it to be now the most spread style.
| Colour | Current convention ( hex / RGB ) | Used for | ||
|---|---|---|---|---|
| B | Grey | #646464
R:100 G:100 B:100 |
Border | |
| Grey | #E0E0E0
R:224 G:224 B:224 |
Area |
- The super-old grey/white style (~2003 or 2004) BlankMap-World6.svg map was not update because of reason 1 (not gain in the update for general world maps), and because I also expect resistances on this key file. So, No move need. Hoping my answer is satisfying. Yug (talk) 06:27, 12 February 2010 (UTC)
Query about how to create a map
Hi, I have a copy of a map of the City of London created by the British Inspectorate of Constabulary, regarding protests in the area on April 1, 2009 during the G-20 summit. The map marks out the areas of protest the police had to deal with on the day. I would like to include it in an article about the death of Ian Tomlinson during the protests, but I know if I upload it under fair use someone will complain that it's replaceable. However, I have no idea how to do that myself. Are there Wikipedians who are willing to reproduce maps on request, and if so, how do I find them? SlimVirgin TALK contribs 03:28, 14 February 2010 (UTC)
Talk page clean up
Hello, I will clean up the talkpage, which means :
- Read again all the posts
- Make very short summary : ideas we talked ; usefull ideas we forgot ; hide the full talks' text in {summarization|} templates.
- Include these ideas to the /to_do list.
- THEN archive sections.
I already made somes section. If you want to help (very welcome), start in the upper sections. See you Yug (talk) 06:50, 16 February 2010 (UTC)
China and Taiwan map in Cross Relations article
Would someone zoom in the map to China and Taiwan showing the Taiwan Strait? {{Help me}} --Mistakefinder (talk) 04:08, 12 March 2010 (UTC)
- I removed the 'helpme' thing, as I don't think this is really a helpme-type request.
- You might want to post your request in Wikipedia:Graphic Lab/Map workshop. Cheers, Chzz ► 04:34, 12 March 2010 (UTC)
Notice to mappers
Here is a brand new page to promote (french;) Geolocalisation. Have a look to "From image to its parametrization". (please fell free to fix my poor english)
I also want to (re)create Commons:Template:Map to document ... maps ;)
Finally, I'm looking for good maps to test fr:Modèle:Géolocalisation/Projection perspective (fr:Modèle:Géolocalisation/Stéréographique/0/0 is awful (unusable?) and too simple)
Best regards. <STyx @ (I promote Geolocation) 19:18, 13 March 2010 (UTC)
- This looks great! Especially for polar areas, supporting more projections will help a lot. Might be nice to do a test with Alaska. Kmusser (talk) 13:12, 15 March 2010 (UTC)
Usability of GeoTemplate
Comments on the usability of {{GeoTemplate}} (the page listing mapping services found by clicking on coordinates in articles) are invited, at Template talk:GeoTemplate#Usability redux. Andy Mabbett (User:Pigsonthewing); Andy's talk; Andy's edits 17:37, 17 March 2010 (UTC)
Afghanistan map help needed
Please see:
Map of the Lower Galilee

Please help me make a nicer looking version of this map which would have improved fonts (it might be a good idea to keep the color of titles within the Lower Galilee region in black and keep the rest of the titles in a less noticeable color) and which would have nicer colors in general (I would appreciate it if you would be able to still use standard topographical colors so that the other users would be able to understand where the mountainous regions are and where the valleys are). thanks in advance! TheCuriousGnome (talk) 19:26, 31 March 2010 (UTC)
Use of UK Ordnance Survey new API
Today (1st April) the UK government agency the Ordnance Survey (OS) has released a new API & totally changed the licencing agreements which should allow the use of the best UK mapping data free for non-commercial purposes. It would be great to be able to use this to illustrate UK place & geography articles. Further info is available, but the site to register is very busy. Has anyone managed to access this or have any advice? The new OS OpenSpace® Developer Agreement includes a requirement that "You must ensure that a copy of the EULA is made accessible to End Users through a hypertext link at the bottom of each page of Your Web application". Is there any way that wp articles which include OS maps developed under this systym could be made to display this agreement?— Rod talk 11:37, 1 April 2010 (UTC)
Biogeographical maps (1st round)


Are there any standards for plant range maps? Any conventional colours? I don't want to make too many and have to change'm all. Kahuroa (talk) 05:53, 23 April 2010 (UTC)
- There is a draft/proposal of Biologic map convention on the French Graphic Lab (here) (>Subpage here). The need of Biologic convention was repeatedly state, so I created this draft on the French wiki, but I'm not a biologist. A biologist is still need to tell us if better colors, and better categorization are in use within the real-life Biologists community's books. Need to contact the Biology Project to ask feedback. If you want to expand/improve this convention draft, go ahead, we need something better ! Yug (talk) 01:53, 25 April 2010 (UTC)
- Thanks Yug, the French page is some help. I will copy your question to the biology and plant project talk pages. Kahuroa (talk) 03:24, 26 April 2010 (UTC)
- Ok Yug, here is a map redone according to the French conventions (if I got it right) File:Cordyline-australis-natural-range.png compared to one done in the colours I was using File:Cordyline-australis-natural-range2.png. What do you think? Kahuroa (talk) 10:53, 26 April 2010 (UTC)
- Thanks Yug, the French page is some help. I will copy your question to the biology and plant project talk pages. Kahuroa (talk) 03:24, 26 April 2010 (UTC)
- I think it's no need to color the sea. Can you make a test-version without the sea, to have an easier comparison. After, you can fix this draft if you feel better choices may be better. Yug (talk) 12:01, 26 April 2010 (UTC)
- Done. I think maybe the French draft convention colours are a little too dull? Not easy to see when the map is small? Kahuroa (talk) 18:32, 26 April 2010 (UTC)
As I said elsewhere, "this should also be run past our accessibility project; for instance, difficulties caused by colour-blindness may be overcome by using hatching or dots".
In both of the above examples, but especially the first, there is insufficient contrast between the two colours. Andy Mabbett (User:Pigsonthewing); Andy's talk; Andy's edits 18:47, 26 April 2010 (UTC)
- Sounds like we need to set up a working group - involving accessibility people, Yug/the French wikipedia, plant people, animal people, map people etc etc - to come up with some recommendations and try various colours out?? Kahuroa (talk) 20:45, 26 April 2010 (UTC)
- The standard for animal distribution maps has always been pure green on grey. See Wikipedia:Distribution maps. Kaldari (talk) 22:08, 26 April 2010 (UTC)
- The example given on that page is a good one, it has significantly more contrast than the NZ maps here, I don't think there's anything wrong with green on grey, but for a map with only two colors Andy has a point, there's no reason not to make them high contrast - the simple test I sometimes use is if you convert the image to grayscale the two colors should still be sharply different. Kmusser (talk) 01:11, 27 April 2010 (UTC)
- Take your point about the contrast on these two maps. But to me the green on that page looks a bit OTT IMHO when it covers most of the image --- I tried it out on the NZ maps, very electric, lol. Maybe I'll go for somewhere in between since there doesn't really seem to be a plant range map convention and I can see this becoming an endless story, as long as it works when greyscaled.Kahuroa (talk) 01:27, 27 April 2010 (UTC)
- The example given on that page is a good one, it has significantly more contrast than the NZ maps here, I don't think there's anything wrong with green on grey, but for a map with only two colors Andy has a point, there's no reason not to make them high contrast - the simple test I sometimes use is if you convert the image to grayscale the two colors should still be sharply different. Kmusser (talk) 01:11, 27 April 2010 (UTC)
- The standard for animal distribution maps has always been pure green on grey. See Wikipedia:Distribution maps. Kaldari (talk) 22:08, 26 April 2010 (UTC)
- Sounds like we need to set up a working group - involving accessibility people, Yug/the French wikipedia, plant people, animal people, map people etc etc - to come up with some recommendations and try various colours out?? Kahuroa (talk) 20:45, 26 April 2010 (UTC)
- Sea: look better without the sea. Sea is need in blue for topographic maps, and so on, where the sea is meaningful as a physical featuere, or a way of transport/trade. Here, color is not need. :D
- Chartjunk free: again, the dilemma is to have contrast, without having an 'electric' (too attractive) color. not easy.
- Constrast test: yes, conversion to grayscale is a good test, especially need for 2 colors maps such here. Also need for several colors maps, if possible.
- Long term project: need a dedicated team to improve convention toward: 1. convenience to draw ; 2. nice look ; 3. colorblinds proof / accessibility. That's both a long term NECESSITY, and need a skilled & devoted user(s). Not easy to get in the free world.
- Now: so the best is to move on on one issue: biologic maps. :D
- Yug (talk) 04:11, 27 April 2010 (UTC)
- Agree with you Yug. I've added a third map with the green brighter than the other two, but not the electric green I mention above. And the grey is darker. Contrast well in grayscale. Thoughts?? Kahuroa (talk) 05:32, 27 April 2010 (UTC)
The greyscale test is useful one, but there are tools, such as Jez Lemon's contrast ratio analyser which will give a more definitive answer. Andy Mabbett (User:Pigsonthewing); Andy's talk; Andy's edits 10:23, 27 April 2010 (UTC)
- What colours would you suggest then Andy? Kahuroa (talk) 12:44, 27 April 2010 (UTC)
- I think your new one looks pretty good - the tool that Andy linked to is specifically for testing text which requires a drastically higher contrast than images do. Kmusser (talk) 14:03, 27 April 2010 (UTC)
- Colour contrast is just as significant in images; especially when they are data visualisations. The green (#3DC94F) and grey (#969B9D) in the third image above have a contrast ratio of just 1.29:1 - we should be aiming for 4.5`:1. Andy Mabbett (User:Pigsonthewing); Andy's talk; Andy's edits 15:01, 27 April 2010 (UTC)
- It does not - for maps like these you just need to be able to tell there are 2 different colors, that doesn't require nearly the amount of contrast that distinguishing readable text does. I ran these images though the color-blind simulators you have linked from your user page and all 3 versions looked pretty decent. Kmusser (talk) 15:16, 27 April 2010 (UTC)
- They may well be discernible to colourblind users; but colourblindness is not the only type of visual disability. Andy Mabbett (User:Pigsonthewing); Andy's talk; Andy's edits 15:28, 27 April 2010 (UTC)
- True, but it's the one that having a simulator was useful for since I'm not colorblind. I can simulate low vision just by taking off my glasses (applying my own without glasses test, versions 2 and 3 look good, version 1 not so much). W3C's 4.5:1 ratio is specific to text, while we still need high contrast, I don't think applying that standard is justified. Kmusser (talk) 16:00, 27 April 2010 (UTC)
- They may well be discernible to colourblind users; but colourblindness is not the only type of visual disability. Andy Mabbett (User:Pigsonthewing); Andy's talk; Andy's edits 15:28, 27 April 2010 (UTC)
- It does not - for maps like these you just need to be able to tell there are 2 different colors, that doesn't require nearly the amount of contrast that distinguishing readable text does. I ran these images though the color-blind simulators you have linked from your user page and all 3 versions looked pretty decent. Kmusser (talk) 15:16, 27 April 2010 (UTC)
- Colour contrast is just as significant in images; especially when they are data visualisations. The green (#3DC94F) and grey (#969B9D) in the third image above have a contrast ratio of just 1.29:1 - we should be aiming for 4.5`:1. Andy Mabbett (User:Pigsonthewing); Andy's talk; Andy's edits 15:01, 27 April 2010 (UTC)
- I think your new one looks pretty good - the tool that Andy linked to is specifically for testing text which requires a drastically higher contrast than images do. Kmusser (talk) 14:03, 27 April 2010 (UTC)
- What colours would you suggest then Andy? Kahuroa (talk) 12:44, 27 April 2010 (UTC)
http://colorbrewer2.org/ is another tool that may be useful as a guide to contrast levels recommended by cartographers. Kmusser (talk) 16:01, 27 April 2010 (UTC)
- Agree with you Kmusser, the contrast required for text doesn't apply here - we have to be realistic or we'd end up with only two colours allowed - black and white. Andy you still haven't told us what colours you would suggest. And I like that second tool - very handy. Kahuroa (talk) 18:46, 27 April 2010 (UTC)
- Nobody has advocated monochrome maps; you're using a Slippery slope argument. I haven't suggested colours because I have no view in that regard; I don't care whether the maps are blue, green, red or whatever. I'm only concerned that the colours used should make the maps as accessible as possible. Andy Mabbett (User:Pigsonthewing); Andy's talk; Andy's edits 18:58, 27 April 2010 (UTC)
- For the sake of argument I played around a bit, even the simplest maps are going to have at least 3 colors (if you count the transparent background which is going to render to white), and I couldn't come up with any combination of 3 that achieved a 4.5:1 contrast between the 3 colors, even with resorting to grayscale only. So if you have an example that actually accomplishes that it would be quite welcome. Kmusser (talk) 19:48, 27 April 2010 (UTC)
- Realistic consensus: our objective is improvement, not perfection. We humbly want to improve a bit the style for more eyes-comfort/accessibility/credibility. 100% consensual agreement and technical perfection is not possible.
- Green: I personally like all them (sorry, that don't help at all)
- Be bold: from my overview and understanding of this talk, Kmusser, you have both technical expertise (colorblind, mapmaking experience) and understanding of the management objective (end with a proposal), so you have the best global view to lead this issue. So let's go, I encourage you to be bold make a proposition ! :D
- Yug (talk) 02:56, 28 April 2010 (UTC)
- If I can be so bold to squeeze in here, I kind of like the middle one as far as shades of green go, but I can live with no 3 green. I think maybe the middle one is about right as far as shade of grey goes, the last one is a little dark.Kahuroa (talk) 03:49, 28 April 2010 (UTC)
- For the sake of argument I played around a bit, even the simplest maps are going to have at least 3 colors (if you count the transparent background which is going to render to white), and I couldn't come up with any combination of 3 that achieved a 4.5:1 contrast between the 3 colors, even with resorting to grayscale only. So if you have an example that actually accomplishes that it would be quite welcome. Kmusser (talk) 19:48, 27 April 2010 (UTC)
- Nobody has advocated monochrome maps; you're using a Slippery slope argument. I haven't suggested colours because I have no view in that regard; I don't care whether the maps are blue, green, red or whatever. I'm only concerned that the colours used should make the maps as accessible as possible. Andy Mabbett (User:Pigsonthewing); Andy's talk; Andy's edits 18:58, 27 April 2010 (UTC)
- I'm not sure if this was covered already, but to me the maps given here make me think the green is where the species is, and the gray is where it isn't. It wasn't until I clicked one and saw the legend that I realized I had it backwards. Just a thought. Pfly (talk) 03:04, 28 April 2010 (UTC)
- No - the legend says the green is where the species is, and the grey is where it isn't.Kahuroa (talk) 03:45, 28 April 2010 (UTC)
As a member of the accessibility project, I have to say that the contrast guidelines only apply to text. See G18: Ensuring that a contrast ratio of at least 4.5:1 exists between text (and images of text) and background behind the text, WCAG 2.0, W3C. If text is part of the image, we have to ensure the text has sufficient contrast with the background color. But apart from this case there are absolutely no guidelines about color contrast within images. Alt text is here to compensate for the image if one can't see it.
It is useful to ensure a minimum contrast however, so the average user can easily and quickly understand the image. But this contrast should rather be measured by your common sense and feelings than color contrast analysers. The examples n°2 and n°3 are fine. I would say the example n°1 doesn't have enough contrast. Yours, Dodoïste (talk) 10:12, 28 April 2010 (UTC)
- Thanks for your helpful input Dodoïste. Kahuroa (talk) 11:01, 28 April 2010 (UTC)
I have "ordinary" vision, with no color-blindness, and only Nº3 looks good to me.--Curtis Clark (talk) 13:23, 28 April 2010 (UTC)
- You're welcome Kahuroa. :-) Well, the n°2 and n°3 have similar contrast as the professional maps we can find on the market. Yours, Dodoïste (talk) 18:26, 28 April 2010 (UTC)
- Choice
- Ok, all have been said. Andy warned us about accessibility issue, Kmusser, Kahuroa, & Dodoïste have made notable contributions : former Distribution maps usage exclude, n⁰1 exclude, stay n⁰2 & 3. That's just a color choice, so let's move fast.
n⁰0: #00FF00R:0 G:255 B:0from Wikipedia:Distribution maps, comments said "frankly too electric" n⁰1: #98CC98R:152 G:204 B:152comments said: too gray, not enough contrast compare to gray land-background n⁰2: #32CC65R:50 G:204 B:101comments said "ok" n⁰3: #32CC32R:50 G:204 B:50comments said "ok" n⁰4: #55CC55R:85 G:204 B:85(new test, mix between 2 & 3) n⁰5: #55DD55R:85 G:255 B:85(new test) n⁰6: #AAC590R:170 G:197 B:144(new test) grey #E0E0E0R:224 G:224 B:224Grey: should always follow Location_maps's convention.
- I just made some "nearby tests" as you can see. Well, I personnally currently surpport n⁰3 (#32CC32). On my screen, I would prefer a bit softer (less electric), something such n⁰4 #55CC55, but that now too close, and the difference will mainly depend on user's screen and display settings. So, Well, I support the n⁰3, and a bit the n⁰4.
- Kmusser, Kahuroa, Dodoïste, may you help me to close this issue before friday: choice between n⁰3 & n⁰4 according to what you feel in front of your screen. Let's finish that ! Yug (talk) 06:15, 4 May 2010 (UTC)
- On comparing the maps I like n⁰3 [
Once this is settled, we need to decide about the grey.And what about range maps that need multiple colours]. Kahuroa (talk) 08:09, 4 May 2010 (UTC) - (The grey is already decide: have to be #E0E0E0, since we most of time use Location maps to create derivative Area / Biology / etc maps) Yug (talk) 07:08, 4 May 2010 (UTC)
- I think anything from No. 2 to 5 would be acceptable, my preference would be whichever of those has the highest contrast with our gray, at a glance I think that's 3. Kmusser (talk) 11:19, 4 May 2010 (UTC)
- On comparing the maps I like n⁰3 [


- comment the base map I used for making distribution maps are sourced off Commons, generally they have a grey landmass and transparent water. On a single subject distribution I use a red(got no idea of hex code) see example map gn1, the red then allows for a wider range of complimentary but contrasting colour shifts that make looking at information on thumbnail size views easy. The biggest issue with doing maps is making it obvious that the map isnt a copyright violation and colour choice is a significant factor in that, I've seen too much time consumed over this issue on Commons. Gnangarra 10:28, 4 May 2010 (UTC)
- Can we get this moving again? I wouldn't mind some expansion of what garra says about copyright issues, since I use books as sources on the few I have done so far - does that rule out having standard colours for these maps? Kahuroa (talk) 19:41, 8 May 2010 (UTC)
Ok ! So let's confirm the n⁰3 :
| n⁰3: | #32CC32
R:50 G:204 B:50 |
Yug (talk) 08:20, 8 June 2010 (UTC) [then need to move on]
Copyright/derivatives question
Is a vectorization of a map considered a derivative work? Specifically, I'm wondering about File:Urumqiriots2009-map.svg, which is loosely based on [1]. Is a general arrangement of streets, buildings, etc., copyrightable? rʨanaɢ (talk) 18:01, 7 May 2010 (UTC)
- It's a gray area - locations of stuff aren't copyrightable, but graphical representations of them are, that is the specific combination of colors, fonts, and other graphical elements used on the map - there is a nebulous guideline of if it's different enough it's ok. A straight vectorization would be questionable, but you've changed the styles around so you're probably ok. Kmusser (talk) 21:01, 7 May 2010 (UTC)
- Ok, thanks for the input! rʨanaɢ (talk) 13:59, 8 May 2010 (UTC)
Location map with multiple dots?
Is it possible to do a location map (bottom of the article) with multiple dots?Kurzon (talk) 06:58, 8 May 2010 (UTC)
- Yes. See July 2009 Urumqi riots#Immediate causes for an example. rʨanaɢ (talk) 13:56, 8 May 2010 (UTC)
OS OpenData
Apologies if this has been asked and answered elsewhere, and please feel free to direct me to a more appropriate board, but am I right in thinking that maps released under the Ordnance Survey's OS OpenData banner can be used in Wikipedia articles? The OS OpenData licence (PDF) says (right at the end) that derivative works of OpenData material can be distributed as cc-by-3.0, which does not prevent either further derivative works or commercial usage and so should be okay for Wikipedia use.
As a specific example: could I get hold of the 1,250:000 raster mapping of National Grid square SH, crop it to the bit showing Holy Island, possibly clean it up a bit and/or annotate it, then upload it to the Holy Island article? I don't see why not, but I'm not experienced at this and may well be missing something obvious! Also, the required OS attribution is "Contains Ordnance Survey data © Crown copyright and database right 2010" - would this go in the "Licensing" section of the File: page, or somewhere else? Thanks in advance. Loganberry (Talk) 17:52, 18 May 2010 (UTC)
- Yes, the OS OpenData license is brand new, so it doesn't look like anyone's made a specific tag for it yet, but see File:National Grid square TF at 1 in 250 000 scale.jpg as a way to present the licensing. Kmusser (talk) 18:09, 18 May 2010 (UTC)
- Thank you. I note that the example you give does not explicitly quote the attribution text, but merely links to the licence itself. Is that considered sufficient? Loganberry (Talk) 18:50, 18 May 2010 (UTC)
- I'm not sure, I would think so, but you might want to do both to be on the safe side. Kmusser (talk) 00:18, 19 May 2010 (UTC)
- That seems sensible advice. I imagine that eventually there'll be a pre-done tag, as for the Geograph stuff, but until then I'll follow your suggestion. Thanks again. Loganberry (Talk) 22:56, 19 May 2010 (UTC)
- I'm not sure, I would think so, but you might want to do both to be on the safe side. Kmusser (talk) 00:18, 19 May 2010 (UTC)
- Thank you. I note that the example you give does not explicitly quote the attribution text, but merely links to the licence itself. Is that considered sufficient? Loganberry (Talk) 18:50, 18 May 2010 (UTC)
Biogeographic maps (Round 2)
| n⁰3: | #32CC32
R:50 G:204 B:50 |
- Move on !
The wonderful thing with the web is that there is out of there people with more taste than me to create nice drawing kits. I thus randomly found a very helpful source (Tango-palette.svg) to set up a range of area colors. I'm pretty busy currently with courses and a Chinese relate free project, but I will propose a first palette draft hopefully within one / two weeks. Kmusser, Kahuroa, Dodoïste, MapMaster, your review will be need for contrast, accessibility, etc.
- Do you have color-blind maps/resources ?
I especially look for color-blind maps, or color-blind palettes to look at : if you have some maps/links/sources, please share them ! PS: With this range of complexity, we can't look for 100% perfect, but for 'good enough' and 'color-blind enough-friendly'. This palette will actually fit current gaps in /Areas maps conventions, /Historical maps conventions, and the last month requested /Biogeographical maps conventions. :] Yug (talk) 11:12, 8 June 2010 (UTC)
- Nice work Yug, and thanks for the "round one" that you closed off above - I will start converting my maps to use it and the location-map grey background. I like the tango pallette too, I think it gives quite a nice range of colours to use in maps that need multicolours. Kahuroa (talk) 18:56, 8 June 2010 (UTC)
- Thanks~ For the round 1, we went slowly and not bold enough, 3 users (Kmusser > Kahura ≃ Yug) all had the understanding/expertise to lead all the game, propose a satisfying color, and close the debate promptly choising randomly between 3 & 4. Well, we went slower... and close it late ;) But this is wiki. That a nice try. I hope this helped to state that « 1. each user can build up his personal tool-kit, 2. then show it to others, 3. fix it according to comments/proposals, and 4. eventually, we accept it as new, still editable convention ». :D I will follow this way with the color palette, be a bit bolder :]
- PS: I remember I seen somewhere a 'blind-friendly' world map, does someone have a file name to give me ? Yug (talk) 08:49, 11 June 2010 (UTC)
- End of my final exams: tuesday ! I'm hunger to start !! Yug (talk) 13:06, 23 June 2010 (UTC)
OS OpenData maps
I've been playing with the Ordnance Survey OpenData release for a while, specifically looking at the boundary-line product to create a large number of new locator maps. The images below are derived from that product (which consists of several shapefiles), and I'd like thoughts before I take this any further.
-
 Blank Great Britain SVG
 -
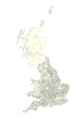 Blank Great Britain PNG
 -
 Blank Isles of Scilly SVG
 -
 Blank Isles of Scilly PNG
 -


My real concern is that I can easily produce PNG maps, but SVG maps will be much harder. Specific problems are:
- The source data is very detailed, and I have repeatedly run into memory issues with Inkscape.
- The boundaries of the administrative regions do not respect the coastline, this can be seen by comparing the two Isles of Scilly maps. Fixing that greatly increases value (the high-water mark is in a separate shapefile), but requires extensive editing to combine the data-sets.
- And to cap that off, my SVG skills are firmly in the "beginner" category.
Irrespective of the SVG/PNG issue, not entirely sure about another couple of issues:
- Is the colour scheme appropriate?
- Is the projection of the map acceptable - if not I'll have to figure out how to transform datums...
I'm tempted to just go ahead and do the bulk uploading as PNG, simply because that way I know I can get it done, and in a reasonable time.--Nilfanion (talk) 22:52, 9 June 2010 (UTC)
- I can produce SVG maps easily enough (though the code will be inefficient), if I ignore the coastline issue entirely. However I'm reluctant to do that chiefly because the boundaries for Bristol, Liverpool and Torbay (amongst others) are radically different to the true coastline.--Nilfanion (talk) 23:17, 9 June 2010 (UTC)
- Looks great. It looks like the Bristol Channel is showing up as an example of the coastline problem you mention.
- If you're using OSGB36 National Grid coordinates (as supplied by OS OpenData itself), it would be helpful to convert to WGS84 (or should that be ETRS89 in this context?) so the maps are equirectangular to work with WP:GEO location maps. That shouldn't be a major visual distortion at GB latitudes, but without the reprojection, there woudl be some significant pinpointing issues.
- Either way, it would also be best practice to specify the map boundaries and projection on the file description pages.
- Sorry for responding only to the more superficial points in your posting, but hope that's helpful.
- — Richardguk (talk) 23:45, 9 June 2010 (UTC)
- Thanks for info, worked out how to convert datum (and more importantly projection) and can specify the corner points. If I can get the coastline issue sorted I'll be done I think. My obvious preference is to try and do this correctly (and with SVG), so there's no need to redo it in future.--Nilfanion (talk) 08:59, 10 June 2010 (UTC)
I've redone the blank Isles of Scilly map, addressing all serious concerns now (coastline and projection), thanks for feedback. Also, tested its use in {{Location map}} here. Managed to figure out how to sort the rest of the country, so I can get on with it now. I do have a few issues that need thinking about still (but won't interfere with map generation).
- Colours: Should I use #F6E1B9 for other counties in the same country and #E0E0E0 for other constituent countries; so for a map of Bristol, Somerset would be #F6E1B9 and Wales #E0E0E0?
- Would insets (like in the existing pngs be beneficial?--Nilfanion (talk) 10:53, 11 June 2010 (UTC)
I've resolved the technical problems I had initially with this and got a workflow of sorts going (I'll do a bot upload later on). I've notified WP:UK (as the relevant national noticeboard) of the work in progress - see this diff, which also links to some files from a test upload I've done. Further feedback always appreciated of course. :)--Nilfanion (talk) 21:17, 22 June 2010 (UTC)
ESRI conference: San Diego, California
Anyone else here going to the ESRI International User Conference next month? Any interest in a meetup? Kmusser (talk) 19:20, 10 June 2010 (UTC)
- Place: San Diego, California ;) , Exact date: ? Price : ?
- Yug (talk) 08:21, 11 June 2010 (UTC)
- Well I'd hope most people going are already registered. I don't expect anyone to go unless they're already being sent there by their employers :-) but it's July 12-16, cost for the week is $1,395, for a day is $495.Kmusser (talk) 12:58, 11 June 2010 (UTC)
Place: San Diego, California, USA
Exact date: July 12-16
Price : Week =  $1,395 ; day = $495.
Commons:Commons:IUCN red list graphic partnership
A partnership is about creating distribution maps for species, genus, etc. based on the IUCN red list spatial data. The spatial data itself will not be licensed, but the maps will. More details in the aforementioned page.
I thought this partnership over at commons might interest the members of this project. I would appreciate comments on visual guidelines, automation of production, or others. Cheers, GoEThe (talk) 09:55, 18 June 2010 (UTC)
Some of the maps shown in that article - here - do not seem to have any key to indicate the actual proportions shown by different tones. This issue has arisen at Scottish people, where there are moves to remove File:Scottish1346.gif from the article. Can someone respond helpfully to the discussion on that page? Ghmyrtle (talk) 08:34, 14 July 2010 (UTC)
Ancestry map for Scottish people article
Is it possible for someone to copy the legend from this map to the one that was on the Scottish people article previously? [2] It was removed from the article due to the lack of a legend/key. Thanks. Jack 1314 (talk) 11:49, 20 July 2010 (UTC)
![[2]](https://en.wikipedia.org/wiki/File:Scottish1346.gif)
- I've copied your request over to the map lab. It's also possible to include a legend in the map caption rather than within the map itself, see Human Development Index for an example of that in action. Kmusser (talk) 13:09, 20 July 2010 (UTC)
- Thanks, Kmusser. Much appreciated. Jack 1314 (talk) 13:16, 20 July 2010 (UTC)
Maps banned as Featured Pictures?
There is a discussion at Wikipedia_talk:Featured_picture_candidates#Categories_of_nominations_that_are_defacto_banned that may interest you. Papa Lima Whiskey (talk) 13:52, 23 July 2010 (UTC)
- Note that the discussion is about categories that are "de facto banned." That means there is not (nor is there being considered) a policy for banning these categories. It's just that images that fall into these categories rarely, if ever, get nominated. I'm fairly certain that if someone were to suggest a well-illustrated, significant, artistic map that also met all the technical and legal requirements, it would get due consideration. (For example, if there were not copyright restrictions prohibiting our use of it, I could see an image of Howard Higbee's Pennsylvania Stream Map as meeting the visual qualifications.) — Michael J 14:24, 23 July 2010 (UTC)
- No, the discussion is about them rarely succeeding, when nominated. I'm just the messenger, but let's get the facts right about the content of the discussion. Papa Lima Whiskey (talk) 14:58, 23 July 2010 (UTC)
Maps for federal courthouses.
I'd like to make maps to accompany the various lists of United States federal courthouses by state, with dots in one color representing locations in the state for current federal courthouses, and in another color for former federal courthouses, but which can be updated in some automated fashion when existing courthouses are retired or new ones are built. Can this be done? bd2412 T 03:10, 25 July 2010 (UTC)
- How many courthouses are there? It would be great to sync this data with what's in OpenStreetMap. [3] I see in List of United States federal courthouses in Virginia that some have missing information. With the data and OSM database available on the toolserver, this might be possible to autogenerate maps. (there might be some other way, but would be neat to see how OSM can be useful for such) --Aude (talk) 04:20, 25 July 2010 (UTC)
- Thanks for your response. Nationally, there are about 600 current and former federal courthouses, about a dozen per state on average (although some states have had only three or four, and some have had dozens; Texas has had about 50). Although there is missing data on the names and dates of use, the one piece of data we consistently have for all of them is the city in which they are or were located. bd2412 T 04:58, 25 July 2010 (UTC)
- Having just cities would work for a map on the state-level. If any of the courthouses are notable enough to have their own article and we have addresses, coordinates or they are in OSM, then it should be possible to do a more detailed locator map. I need to figure out more specifically how to automate all this... give me a couple days. --Aude (talk) 04:07, 26 July 2010 (UTC)
- Thanks! Most purpose-built federal courthouses currently in use are notable, and many are in the NRHP. Older courthouses that have been razed or sold off are iffier, and address information is harder to come by. At the moment, I am particularly interested in state-level maps for the state lists. bd2412 T 10:14, 26 July 2010 (UTC)
- I have not forgotten. I am working on basic map styles that would be suitable for these types of maps. --Aude (talk) 23:11, 4 August 2010 (UTC)
- Thanks! Most purpose-built federal courthouses currently in use are notable, and many are in the NRHP. Older courthouses that have been razed or sold off are iffier, and address information is harder to come by. At the moment, I am particularly interested in state-level maps for the state lists. bd2412 T 10:14, 26 July 2010 (UTC)
- Having just cities would work for a map on the state-level. If any of the courthouses are notable enough to have their own article and we have addresses, coordinates or they are in OSM, then it should be possible to do a more detailed locator map. I need to figure out more specifically how to automate all this... give me a couple days. --Aude (talk) 04:07, 26 July 2010 (UTC)
- Thanks for your response. Nationally, there are about 600 current and former federal courthouses, about a dozen per state on average (although some states have had only three or four, and some have had dozens; Texas has had about 50). Although there is missing data on the names and dates of use, the one piece of data we consistently have for all of them is the city in which they are or were located. bd2412 T 04:58, 25 July 2010 (UTC)
Orthographic projections
I've added my guess at conventions for the grey-green orthographic projections. Linked to from here (more detail). Please update / expand as necessary. In particular, I'm not convinced that bright green is the best for countries in the same political unity, but I'm not quite sure what the best colour would be (perhaps halfway between the light grey and the dark green?). gringer (talk) 02:18, 1 September 2010 (UTC)
- Well done ! thanks :D Yug (talk) 17:38, 3 September 2010 (UTC)
River Severn
The map of the River Severn is very poor. Some, please replace it or re-work it. Kdammers (talk) 08:01, 18 September 2010 (UTC)
North Carolina map help
I created a map for Wikipedia, but I do not know where a blank North Carolina map is. Could you point me in the correct direction? Also, does anyone have any tips? I created this one
![]() but needless to say, it didn't come out too well. The counties have white space within the red, and for some reason the background is black. I have a few more I want to create, but I don't want to produce a subpar map. Since I don't check this page often, could whoever please respond on my talkpage? Thanks, PGPirate 21:17, 20 October 2010 (UTC)
but needless to say, it didn't come out too well. The counties have white space within the red, and for some reason the background is black. I have a few more I want to create, but I don't want to produce a subpar map. Since I don't check this page often, could whoever please respond on my talkpage? Thanks, PGPirate 21:17, 20 October 2010 (UTC)
National extrinsic properties represented by colours
There are a lot of maps colour coded for national extrinsic quantitative properties on Wikipedia. Population, GDP, total number of troops etc.
This isn't good practice. It's misleading, it's inappropriate. You should use colour coding for intrinsic properties: population density, GDP per capita, troops as a percentage of population.
Overlaying paths on maps
I've used the template:location map+ to place markers and now paths on a map Ibn_Battuta#Places_visited_by_Ibn_Battuta
The next step is to place a path or route on a map. I've worked up a nice and simple solution to this problem of routes or path using a transparent overlay. I've sandboxed it and I'm very happy with a first cut testing. I'll move on to cross-browser testing tomorrow. Can somebody with a LOT more experience with templates than me, give me some guidance on the following questions:
- Should I cut a new template for my changes or roll them into Location map+ (I really don't want to fork unnecessarily, but I don't want to mess up anybody elses use of that template...)
- Is there any sort of process for "approving" / testing this template for use, or do I just throw it up and start dropping it on pages??
I have an example here if anybody wants to take a look: User:Sladew/Ibn
Many thanks for your help with this. Sladew (talk) 11:25, 4 November 2010 (UTC)
- I don't have an answer for you, but just wanted to say that looks awesome! Great job. Hopefully someone with more experience with templates can help you out. Kmusser (talk) 13:17, 4 November 2010 (UTC)
- Hey, thanks Kmusser. I didn't really get much in the way of answers to my questions, so I just threw it up at Template:Location_map+overlay. So, using this template you can multiple markers to a map and then overlay an image as another "layer". If you make the overlay "mostly" transparent and the same dimensions as the underlying map it becomes possible to easily add paths or routes to maps and markers. For an example see the map on this page Ibn_Battuta#Places_visited_by_Ibn_Battuta. If you have any suggestions or questions, let me know. Sladew (talk) 07:27, 5 November 2010 (UTC)
- This is nice... but there is a problem: The basemap has to be only one click away for license reasons... I am preparing something similar in de:WP, look here: [4]. Links to the templates on my userpage: [5]. Uwe Dedering (talk) 10:37, 5 November 2010 (UTC)
- Thanks for the feedback, I'll certainly check out your templates page... I'm pretty sure I should be able to adjust the template to restore the click through for the base map. I have a real question though, I'd hoped that this would be an easier way of apply templates, but am I actually saving anything in the end? Should I just be editing copies of the base SVG maps and adding new layers for the paths, or is that going to get me wrapped up in licensing again?? Sladew (talk) 11:24, 5 November 2010 (UTC)