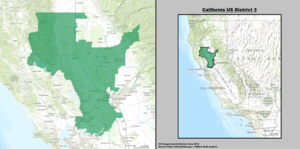
California's 3rd congressional district is a U.S. congressional district in California. It includes the northern Sierra Nevada and northeastern suburbs of Sacramento, stretching south to Death Valley. It encompasses Alpine, Inyo, Mono, Nevada, Placer, Plumas, and Sierra counties, as well as parts of El Dorado, Sacramento, and Yuba counties. It includes the Sacramento suburbs of Roseville (the district's largest city), Folsom, Orangevale, Rocklin, and Lincoln, and the mountain towns of Quincy, South Lake Tahoe, Truckee, Mammoth Lakes, and Bishop.[1] The district is represented by Republican Kevin Kiley.
| California's 3rd congressional district | |||
|---|---|---|---|
Interactive map of district boundaries since 2023 (Used in the 2022 elections) | |||
| Representative |
| ||
| Population (2022) | 773,866[1] | ||
| Median household income | $98,689[2] | ||
| Ethnicity |
| ||
| Cook PVI | R+4[3] | ||
.svg)

Prior to redistricting in 2020, the 3rd district encompassed most of the Sacramento Valley north and west of Sacramento. It covered all of Colusa, Sutter and Yuba counties, most of Glenn, Lake, Solano and Yolo counties and a portion of Sacramento County.[4] The district was represented by John Garamendi, a Democrat.
Recent election results from statewide races edit
| Election results from statewide races | ||
|---|---|---|
| Year | Office | Results |
| 2012 | President | Obama (D) 54.3–43.1% |
| Senator | Feinstein (D) 56.5–43.55 | |
| 2014 | Governor | Brown (D) 56.0–44.0% |
| 2016 | President | Clinton (D) 53.0–40.4% |
| Senator | Harris (D) 62.4–37.6% | |
| 2018 | Governor | Newsom (D) 52.4–47.6% |
| Senator | De León (D) 52.8–47.2% | |
| 2020 | President | Biden (D) 54.9–42.7% |
| 2021 | Recall[5] | |
| 2022 | Governor[6] | Dahle (R) 56.8–43.2% |
| Senator | Meuser (R) 54.1–45.9% | |
Recent history edit
The 3rd district once extended up the Sacramento Valley from Sacramento to take in rural territory up to Tehama County. Once a Democratic bastion, the district was pushed into more rural and Republican-leaning territory after the 1990 census, and finally elected a Republican in 1998. The 2001 reapportionment made the district more compact and Republican than its predecessor, though it was far less Republican than the neighboring 4th district. Although there was some movement in registration in favor of the Democrats, it still had a strong GOP flavor as most of the Sacramento area's Democratic voters lived in the neighboring 5th district.
While George W. Bush carried the district in 2004 with 58.2% of the vote, the district swung rapidly in the Democratic column in 2008 with Barack Obama narrowly winning a plurality with 49.28% of the vote over John McCain's 48.81%. However, despite Obama's win, in the congressional election held on the same day the Republicans retained the seat.
After redistricting, this district essentially became the 7th district, while a new 3rd was created with lines similar to what the old 3rd had in the 1990s. This version of the 3rd was considered a swing district, though the bulk of its population lives in Democratic-leaning areas in the outer Bay Area and in the closer-in suburbs of Sacramento. 
Election results from statewide races before 2012 edit
| Election results from statewide races | ||
|---|---|---|
| Year | Office | Results |
| 1992 | President | Clinton (D) 40.9–37.2% |
| Senator | Herschensohn (R) 45.2–44.2% | |
| Senator | Feinstein (D) 49.3–41.7% | |
| 1994 | Governor | Wilson (R) 60.2–35.1% |
| Senator | Feinstein (D) 46.7-44.8% | |
| 1996 | President | Clinton (D) 45.2–44.4% |
| 1998 | Governor | Davis (D) 58.0-38.4% |
| Senator | Boxer (D) 53.1-43.0% | |
| 2000 | President[7] | Bush (R) 51.1–43.6% |
| Senator[8] | Feinstein (D) 48.9–43.4% | |
| 2002 | Governor[9] | Simon (R) 54.5–34.0% |
| 2003 | Recall[10][11] | |
| Schwarzenegger (R) 58.2–20.3% | ||
| 2004 | President[12] | Bush (R) 58.2–40.8% |
| Senator[13] | Jones (R) 51.1–46.7% | |
| 2006 | Governor[14] | Schwarzenegger (R) 68.6–26.8% |
| Senator[15] | Feinstein (D) 48.8–46.1% | |
| 2008 | President[16] | Obama (D) 49.3–48.8% |
| 2010 | Governor[17] | Brown (D) 47.6–47.4% |
| Senator[18] | Fiorina (R) 52.9–40.7% | |
Composition as of 2023 edit
| # | County | Seat | Population |
|---|---|---|---|
| 3 | Alpine | Markleeville | 1,235 |
| 27 | Inyo | Independence | 18,970 |
| 51 | Mono | Bridgeport | 13,247 |
| 57 | Nevada | Nevada City | 103,487 |
| 61 | Placer | Auburn | 412,300 |
| 63 | Plumas | Quincy | 19,915 |
| 91 | Sierra | Downieville | 3,283 |
As of the 2020 redistricting, California's 3rd congressional district is located in the Sierra Nevada region. It encompasses Alpine, Inyo, Mono, Nevada, Placer, Plumas, and Sierra Counties, as well as parts of El Dorado, Sacramento, and Yuba Counties.
El Dorado County is split between this district and the 5th district. They are partitioned by Scott Creek, Perry Creek, Perry Creek Rd, Rocky Bar Rd, Grizzly Flat Rd, Happy Valley Rd, Canon Creek, E16 Highway, Pleasant Valley Rd, Cedar Ravine Rd, Woodland Dr, Weber Creek, Highway 50, Chili Bar Reservoir, South Fork American River, Marshall Rd, Hastings Creek, Highway 49, Pilot Creek, North Fork American River, and the Folsom Lake State Recreation Area. The 3rd district takes in the city of South Lake Tahoe and the census-designated place of Pollock Pines.
Sacramento County is split between this district and both the 6th district and 7th district. The 6th and 3rd districts are partitioned by Latrobe Rd, Scott Rd, Deer Creek, Carson Creek, Nimbus Rd, E3 Highway, Illinois Ave, Madison Ave, Kenneth Ave, Wachtel Way, and Old Auburn Rd. The 3rd district takes in the city of Folsom and the census-designated place of Orangevale.
Yuba County is split between this district and the 1st district. They are partitioned by State Highway 70, Ellis Rd, and Union Pacific. The 3rd district takes in the city of Wheatland, and the census-designated places of Linda, Olivehurst, and Plumas Lake.
Cities & CDP with 10,000 or more people edit
- Roseville - 141,500
- Rocklin - 68,823
- Lincoln - 48,275
- South Lake Tahoe - 21,330
- Granite Bay - 20,402
- Truckee - 16,735
- Auburn - 13,776
- North Auburn - 13,022
- Grass Valley - 12,817
2,500-10,000 people edit
- Alta Sierra - 7,204
- Mammoth Lakes - 7,191
- Pollock Pines - 7,112
- Loomis - 6,836
- Lake Wildwood - 4,991
- Lake of the Pines - 3,917
- Bishop - 3,819
- Nevada City - 3,148
- Dixon Lane-Meadow Creek - 2,780
- West Bishop - 2,607
List of members representing the district edit

.jpg)


.jpg)
.jpg)

.jpg)


.jpg)


_(new_version).svg)
Election results edit
1864 edit
| Party | Candidate | Votes | % | |
|---|---|---|---|---|
| Republican | John Bidwell | 18,255 | 56.1 | |
| Democratic | Jack Temple | 14,273 | 43.9 | |
| Total votes | 32,528 | 100.0 | ||
| Republican hold | ||||
1867 edit
| Party | Candidate | Votes | % | |||
|---|---|---|---|---|---|---|
| Democratic | James A. Johnson | 14,767 | 50.6 | |||
| Republican | Chancellor Hartson | 14,394 | 49.4 | |||
| Total votes | 29,161 | 100.0 | ||||
| Democratic gain from Republican | ||||||
1868 edit
| Party | Candidate | Votes | % | |
|---|---|---|---|---|
| Democratic | James A. Johnson (Incumbent) | 15,792 | 50.4 | |
| Republican | Chancellor Hartson | 15,528 | 49.6 | |
| Total votes | 31,320 | 100.0 | ||
| Democratic hold | ||||
1871 edit
| Party | Candidate | Votes | % | |||
|---|---|---|---|---|---|---|
| Republican | John M. Coghlan | 18,503 | 51.7 | |||
| Democratic | George Pearce | 17,309 | 48.3 | |||
| Total votes | 35,812 | 100.0 | ||||
| Republican gain from Democratic | ||||||
1872 edit
| Party | Candidate | Votes | % | |||
|---|---|---|---|---|---|---|
| Democratic | John K. Luttrell | 14,032 | 51.7 | |||
| Republican | John M. Coghlan (Incumbent) | 13,105 | 48.3 | |||
| Total votes | 27,137 | 100.0 | ||||
| Democratic gain from Republican | ||||||
1875 edit
| Party | Candidate | Votes | % | |
|---|---|---|---|---|
| Democratic | John K. Luttrell (Incumbent) | 18,468 | 55.1 | |
| Republican | C. B. Denio | 8,284 | 24.7 | |
| Independent | Charles F. Reed | 6,761 | 20.2 | |
| Total votes | 33,513 | 100.0 | ||
| Democratic hold | ||||
1876 edit
| Party | Candidate | Votes | % | |
|---|---|---|---|---|
| Democratic | John K. Luttrell (Incumbent) | 19,846 | 51.1 | |
| Republican | Joseph McKenna | 18,990 | 48.9 | |
| Total votes | 38,836 | 100.0 | ||
| Democratic hold | ||||
1879 edit
| Party | Candidate | Votes | % | |
|---|---|---|---|---|
| Democratic | Campbell Polson Berry | 20,019 | 50.2 | |
| Republican | Joseph McKenna | 19,800 | 49.6 | |
| Workingman's | George T. Elliott | 93 | 0.2 | |
| Total votes | 39,912 | 100.0 | ||
| Democratic hold | ||||
1880 edit
| Party | Candidate | Votes | % | |
|---|---|---|---|---|
| Democratic | Campbell Polson Berry (Incumbent) | 21,743 | 51.1 | |
| Republican | George A. Knight | 20,494 | 48.2 | |
| Independent | W. A. Howe | 172 | 0.4 | |
| Greenback | A. Musselman | 85 | 0.2 | |
| Independent | A. G. Clark | 26 | 0.1 | |
| Total votes | 42,520 | 100.0 | ||
| Democratic hold | ||||
1882 edit
| Party | Candidate | Votes | % | |
|---|---|---|---|---|
| Democratic | Barclay Henley | 21,807 | 51.3 | |
| Republican | John J. De Haven | 19,473 | 45.8 | |
| Prohibition | H. S. Graves | 862 | 2.0 | |
| Greenback | W. Howe | 401 | 0.9 | |
| Total votes | 42,543 | 100.0 | ||
| Democratic hold | ||||
1884 edit
| Party | Candidate | Votes | % | ||
|---|---|---|---|---|---|
| Republican | Joseph McKenna | 17,435 | 55.8 | ||
| Democratic | John R. Glascock (Incumbent) | 13,197 | 42.3 | ||
| Prohibition | Joshua B. Wills | 322 | 1.0 | ||
| Populist | A. B. Burns | 273 | 0.9 | ||
| Total votes | 31,227 | 100.0 | |||
| Republican win (new seat) | |||||
1886 edit
| Party | Candidate | Votes | % | |
|---|---|---|---|---|
| Republican | Joseph McKenna (Incumbent) | 15,801 | 53.0 | |
| Democratic | Henry C. McPike | 13,277 | 44.5 | |
| Prohibition | W. W. Smith | 707 | 2.4 | |
| Independent | W. J. Cuthbertson | 32 | 0.1 | |
| Total votes | 29,817 | 100.0 | ||
| Republican hold | ||||
1888 edit
| Party | Candidate | Votes | % | |
|---|---|---|---|---|
| Republican | Joseph McKenna (Incumbent) | 19,912 | 56.0 | |
| Democratic | Ben Morgan | 14,633 | 41.2 | |
| Prohibition | W. W. Smith | 657 | 1.9 | |
| Know Nothing | S. Solon Hall | 338 | 1.0 | |
| Total votes | 35,540 | 100.0 | ||
| Republican hold | ||||
1890 edit
| Party | Candidate | Votes | % | |
|---|---|---|---|---|
| Republican | Joseph McKenna (Incumbent) | 20,834 | 55.4 | |
| Democratic | John P. Irish | 15,997 | 42.5 | |
| Prohibition | O. O. Felkner | 774 | 2.1 | |
| Total votes | 37,605 | 100.0 | ||
| Republican hold | ||||
1892 (Special) edit
| Party | Candidate | Votes | % | |
|---|---|---|---|---|
| Republican | Samuel G. Hilborn | 13,163 | 43.2 | |
| Democratic | Warren B. English | 13,138 | 43.1 | |
| Populist | J. L. Lyon | 3,495 | 11.5 | |
| Prohibition | L. B. Scranton | 671 | 2.2 | |
| Total votes | 30,467 | 100.0 | ||
| Republican hold | ||||
1894 edit
| Party | Candidate | Votes | % | |||
|---|---|---|---|---|---|---|
| Republican | Samuel G. Hilborn | 15,795 | 45.5 | |||
| Democratic | Warren B. English (Incumbent) | 13,103 | 37.8 | |||
| Populist | W. A. Vann | 5,162 | 14.9 | |||
| Prohibition | L. B. Scranton | 637 | 1.8 | |||
| Total votes | 34,697 | 100.0 | ||||
| Republican gain from Democratic | ||||||
1896 edit
| Party | Candidate | Votes | % | |
|---|---|---|---|---|
| Republican | Samuel Hilborn (Incumbent) | 19,778 | 54.0 | |
| Democratic | Warren B. English | 16,119 | 44.0 | |
| Socialist | John H. Eustice | 387 | 1.1 | |
| Prohibition | W. Shafer | 327 | 0.9 | |
| Total votes | 36,611 | 100.0 | ||
| Republican hold | ||||
1898 edit
| Party | Candidate | Votes | % | |
|---|---|---|---|---|
| Republican | Victor H. Metcalf | 20,592 | 57.3 | |
| Democratic | John A. Jones | 14,051 | 39.1 | |
| Socialist Labor | Thomas F. Burns | 1,309 | 3.6 | |
| Total votes | 35,952 | 100.0 | ||
| Republican hold | ||||
1900 edit
| Party | Candidate | Votes | % | |
|---|---|---|---|---|
| Republican | Victor H. Metcalf (Incumbent) | 22,109 | 58.9 | |
| Democratic | Frank Freeman | 14,408 | 38.4 | |
| Socialist | R. A. Dague | 596 | 1.6 | |
| Prohibition | Alvin W. Holt | 431 | 1.1 | |
| Total votes | 37,544 | 100.0 | ||
| Republican hold | ||||
1902 edit
| Party | Candidate | Votes | % | |
|---|---|---|---|---|
| Republican | Victor H. Metcalf (Incumbent) | 20,532 | 66.2 | |
| Democratic | Calvin B. White | 8,574 | 27.7 | |
| Socialist | M. W. Wilkins | 1,556 | 5.0 | |
| Prohibition | T. H. Montgomery | 338 | 1.1 | |
| Total votes | 31,000 | 100.0 | ||
| Republican hold | ||||
1904 (Special) edit
| Party | Candidate | Votes | % | |
|---|---|---|---|---|
| Republican | Joseph R. Knowland (Incumbent) | 24,637 | 68.6 | |
| Democratic | Henry C. McPike | 7,210 | 20.1 | |
| Socialist | M. Lesser | 3,617 | 10.1 | |
| Prohibition | Bates Morris | 471 | 1.3 | |
| Total votes | 35,935 | 100.0 | ||
| Republican hold | ||||
1906 edit
| Party | Candidate | Votes | % | |
|---|---|---|---|---|
| Republican | Joseph R. Knowland (Incumbent) | 21,510 | 60.0 | |
| Democratic | Hugh W. Brunk | 7,716 | 21.5 | |
| Independence | Charles C. Boynton | 3,614 | 10.1 | |
| Socialist | William McDevitt | 2,514 | 7.0 | |
| Prohibition | T. H. Montgomery | 482 | 1.4 | |
| Total votes | 35,836 | 100.0 | ||
| Republican hold | ||||
1908 edit
| Party | Candidate | Votes | % | |
|---|---|---|---|---|
| Republican | Joseph R. Knowland (Incumbent) | 27,857 | 64.1 | |
| Democratic | George Peckham | 9,889 | 22.8 | |
| Socialist | O. W. Philbrick | 4,052 | 9.3 | |
| Independence | John A. Sands | 923 | 2.1 | |
| Prohibition | T. H. Montgomery | 717 | 1.7 | |
| Total votes | 43,438 | 100.0 | ||
| Republican hold | ||||
1910 edit
| Party | Candidate | Votes | % | |
|---|---|---|---|---|
| Republican | Joseph R. Knowland (Incumbent) | 34,291 | 81.9 | |
| Socialist | S. Miller | 6,653 | 15.9 | |
| Prohibition | James N. Christian | 906 | 2.2 | |
| Total votes | 41,850 | 100.0 | ||
| Republican hold | ||||
1912 edit
| Party | Candidate | Votes | % | |
|---|---|---|---|---|
| Republican | Charles F. Curry | 31,060 | 58.8 | |
| Democratic | Gilbert M. Ross | 15,197 | 28.8 | |
| Socialist | William L. Wilson | 6,522 | 12.4 | |
| Total votes | 52,779 | 100.0 | ||
| Republican hold | ||||
1914 edit
| Party | Candidate | Votes | % | |
|---|---|---|---|---|
| Republican | Charles F. Curry (Incumbent) | 66,034 | 85.0 | |
| Socialist | David T. Ross | 6,752 | 8.7 | |
| Prohibition | Edwin F. Van Vlear | 4,911 | 6.3 | |
| Total votes | 77,697 | 100.0 | ||
| Republican hold | ||||
1916 edit
| Party | Candidate | Votes | % | |
|---|---|---|---|---|
| Republican | Charles F. Curry (Incumbent) | 48,193 | 66.7 | |
| Democratic | O. W. Kennedy | 16,900 | 23.4 | |
| Socialist | Ben Cooper | 4,455 | 6.2 | |
| Prohibition | Edwin F. Van Vlear | 2,694 | 3.7 | |
| Total votes | 72,242 | 100.0 | ||
| Republican hold | ||||
1918 edit
| Party | Candidate | Votes | % | |
|---|---|---|---|---|
| Republican | Charles F. Curry (Incumbent) | 51,690 | 91.6 | |
| Socialist | Allen K. Gifford | 4,746 | 8.4 | |
| Total votes | 56,436 | 100.0 | ||
| Republican hold | ||||
1920 edit
| Party | Candidate | Votes | % | |
|---|---|---|---|---|
| Republican | Charles F. Curry (Incumbent) | 54,984 | 74.7 | |
| Democratic | J. W. Struckenbruck | 14,964 | 20.4 | |
| Socialist | Miles William Beck | 3,631 | 4.9 | |
| Total votes | 73,579 | 100.0 | ||
| Republican hold | ||||
1922 edit
| Party | Candidate | Votes | % | |
|---|---|---|---|---|
| Republican | Charles F. Curry (Incumbent) | 71,316 | 91.6 | |
| Socialist | Marcus H. Steely | 6,561 | 8.4 | |
| Total votes | 77,877 | 100.0 | ||
| Republican hold | ||||
1924 edit
| Party | Candidate | Votes | % | |
|---|---|---|---|---|
| Republican | Charles F. Curry (Incumbent) | 61,512 | 80.7 | |
| Socialist | James H. Barkley | 14,665 | 19.3 | |
| Total votes | 76,177 | 100.0 | ||
| Republican hold | ||||
1926 edit
| Party | Candidate | Votes | % | |
|---|---|---|---|---|
| Republican | Charles F. Curry (Incumbent) | 72,912 | 100.0 | |
| Republican hold | ||||
1928 edit
| Party | Candidate | Votes | % | |
|---|---|---|---|---|
| Republican | Charles F. Curry (Incumbent) | 77,750 | 100.0 | |
| Republican hold | ||||
1930 edit
| Party | Candidate | Votes | % | |
|---|---|---|---|---|
| Republican | Charles F. Curry Jr. | 43,336 | 53.4 | |
| Republican | J. M. Inman | 26,785 | 33.0 | |
| Democratic | Frank H. Buck | 9,172 | 11.3 | |
| Independent | Katherine Braddock | 1,753 | 2.2 | |
| Independent | E. M. Turner | 49 | 0.1 | |
| Total votes | 80,095 | 100.0 | ||
| Republican hold | ||||
1932 edit
| Party | Candidate | Votes | % | |||
|---|---|---|---|---|---|---|
| Democratic | Frank H. Buck | 61,694 | 56.8 | |||
| Republican | Charles F. Curry (Incumbent) | 46,887 | 43.2 | |||
| Total votes | 108,581 | 100.0 | ||||
| Democratic gain from Republican | ||||||
1934 edit
| Party | Candidate | Votes | % | |
|---|---|---|---|---|
| Democratic | Frank H. Buck (Incumbent) | 66,566 | 53.3 | |
| Republican | J. M. Inman | 56,222 | 45.7 | |
| Communist | Albert Hougardy | 1,167 | 1.0 | |
| Total votes | 122,955 | 100.0 | ||
| Democratic hold | ||||
1936 edit
| Party | Candidate | Votes | % | |
|---|---|---|---|---|
| Democratic | Frank H. Buck (Incumbent) | 93,110 | 90.6 | |
| Independent | Walter Schaefer (write-in) | 5,310 | 5.2 | |
| Communist | Perry Hill | 4,390 | 4.2 | |
| Total votes | 98,810 | 100.0 | ||
| Democratic hold | ||||
1938 edit
| Party | Candidate | Votes | % | |
|---|---|---|---|---|
| Democratic | Frank H. Buck (Incumbent) | 119,236 | 93.3 | |
| Communist | Nora Conklin | 8,271 | 6.5 | |
| Independent | Walter Schaefer (write-in) | 327 | 0.2 | |
| Total votes | 127,834 | 100.0 | ||
| Democratic hold | ||||
1940 edit
| Party | Candidate | Votes | % | |
|---|---|---|---|---|
| Democratic | Frank H. Buck (Incumbent) | 135,461 | 91.0 | |
| Prohibition | C. H. Farman | 10,539 | 7.1 | |
| Communist | Charles Gricus | 2,751 | 1.8 | |
| No party | George Kimber (write-in) | 122 | 0.1 | |
| Total votes | 148,873 | 100.0 | ||
| Democratic hold | ||||
1942 edit
| Party | Candidate | Votes | % | |
|---|---|---|---|---|
| Republican | Justin L. Johnson (Incumbent) | 63,982 | 54.5 | |
| Democratic | Joseph B. O'Neil | 53,521 | 45.5 | |
| Total votes | 117,503 | 100.0 | ||
| Republican hold | ||||
1944 edit
| Party | Candidate | Votes | % | |
|---|---|---|---|---|
| Republican | Justin L. Johnson (Incumbent) | 131,705 | 100.0 | |
| Republican hold | ||||
1946 edit
| Party | Candidate | Votes | % | |
|---|---|---|---|---|
| Republican | Justin L. Johnson (Incumbent) | 116,792 | 100.0 | |
| Republican hold | ||||
1948 edit
| Party | Candidate | Votes | % | |
|---|---|---|---|---|
| Republican | Justin L. Johnson (Incumbent) | 166,571 | 84.4 | |
| Progressive | James B. "Bert" Willard | 30,878 | 15.6 | |
| Total votes | 197,449 | 100.0 | ||
| Republican hold | ||||
1950 edit
| Party | Candidate | Votes | % | |
|---|---|---|---|---|
| Republican | Justin L. Johnson (Incumbent) | 177,269 | 100.0 | |
| Republican hold | ||||
1952 edit
| Party | Candidate | Votes | % | |
|---|---|---|---|---|
| Democratic | John E. Moss | 87,335 | 50.8 | |
| Republican | Leslie E. Wood | 82,133 | 47.8 | |
| Progressive | Helen C. Thomsen | 2,443 | 1.4 | |
| Total votes | 171,911 | 100.0 | ||
| Democratic hold | ||||
1954 edit
| Party | Candidate | Votes | % | |
|---|---|---|---|---|
| Democratic | John E. Moss (Incumbent) | 96,238 | 65.3 | |
| Republican | James H. Phillips | 51,111 | 34.7 | |
| Total votes | 147,349 | 100.0 | ||
| Democratic hold | ||||
1956 edit
| Party | Candidate | Votes | % | |
|---|---|---|---|---|
| Democratic | John E. Moss (Incumbent) | 132,930 | 68.6 | |
| Republican | Noel C. Stevenson | 60,889 | 31.4 | |
| Total votes | 193,819 | 100.0 | ||
| Democratic hold | ||||
1958 edit
| Party | Candidate | Votes | % | |
|---|---|---|---|---|
| Democratic | John E. Moss (Incumbent) | 169,727 | 100.0 | |
| Democratic hold | ||||
1960 edit
| Party | Candidate | Votes | % | |
|---|---|---|---|---|
| Democratic | John E. Moss (Incumbent) | 200,439 | 100.0 | |
| Democratic hold | ||||
1962 edit
| Party | Candidate | Votes | % | |
|---|---|---|---|---|
| Democratic | John E. Moss (Incumbent) | 138,257 | 74.8 | |
| Republican | George W. G. Smith | 46,510 | 25.2 | |
| Total votes | 184,767 | 100.0 | ||
| Democratic hold | ||||
1964 edit
| Party | Candidate | Votes | % | |
|---|---|---|---|---|
| Democratic | John E. Moss (Incumbent) | 166,688 | 74.3 | |
| Republican | Einer B. Gjelsteen | 57,630 | 25.7 | |
| Total votes | 224,318 | 100.0 | ||
| Democratic hold | ||||
1966 edit
| Party | Candidate | Votes | % | |
|---|---|---|---|---|
| Democratic | John E. Moss (Incumbent) | 143,177 | 67.5 | |
| Republican | Terry G. Feil | 69,057 | 32.5 | |
| Total votes | 212,234 | 100.0 | ||
| Democratic hold | ||||
1968 edit
| Party | Candidate | Votes | % | |
|---|---|---|---|---|
| Democratic | John E. Moss (Incumbent) | 106,694 | 56.0 | |
| Republican | Elmore J. Duffy | 79,717 | 41.8 | |
| American Independent | James Tarleton Slaughter | 4,188 | 2.2 | |
| Total votes | 190,599 | 100.0 | ||
| Democratic hold | ||||
1970 edit
| Party | Candidate | Votes | % | |
|---|---|---|---|---|
| Democratic | John E. Moss (Incumbent) | 117,496 | 61.6 | |
| Republican | Elmore J. Duffy | 69,811 | 36.6 | |
| American Independent | Allen E. Priest | 3,554 | 1.8 | |
| Total votes | 190,861 | 100.0 | ||
| Democratic hold | ||||
1972 edit
| Party | Candidate | Votes | % | |
|---|---|---|---|---|
| Democratic | John E. Moss (Incumbent) | 151,035 | 69.9 | |
| Republican | John Rakus | 64,949 | 30.1 | |
| Total votes | 215,984 | 100.0 | ||
| Democratic hold | ||||
1974 edit
| Party | Candidate | Votes | % | |
|---|---|---|---|---|
| Democratic | John E. Moss (Incumbent) | 121,842 | 72.3 | |
| Republican | Ivaldo Lenci | 46,585 | 27.7 | |
| Total votes | 168,427 | 100.0 | ||
| Democratic hold | ||||
1976 edit
| Party | Candidate | Votes | % | |
|---|---|---|---|---|
| Democratic | John E. Moss (Incumbent) | 139,779 | 72.9 | |
| Republican | George R. Marsh Jr. | 52,075 | 27.1 | |
| Total votes | 191,854 | 100.0 | ||
| Democratic hold | ||||
1978 edit
| Party | Candidate | Votes | % | |
|---|---|---|---|---|
| Democratic | Bob Matsui | 105,537 | 53.4 | |
| Republican | Sandy Smoley | 91,966 | 46.6 | |
| Total votes | 197,503 | 100.0 | ||
| Democratic hold | ||||
1980 edit
| Party | Candidate | Votes | % | |
|---|---|---|---|---|
| Democratic | Robert Matsui (Incumbent) | 170,670 | 70.6 | |
| Republican | Joseph Murphy | 64,215 | 26.5 | |
| Libertarian | Bruce A. Daniel | 6,980 | 2.9 | |
| Total votes | 241,865 | 100.0 | ||
| Democratic hold | ||||
1982 edit
| Party | Candidate | Votes | % | |
|---|---|---|---|---|
| Democratic | Robert Matsui (Incumbent) | 194,680 | 89.6 | |
| Libertarian | Bruce A. Daniel | 16,222 | 7.5 | |
| Peace and Freedom | John Newmeyer | 6,294 | 2.9 | |
| Total votes | 217,196 | 100.0 | ||
| Democratic hold | ||||
1984 edit
| Party | Candidate | Votes | % | |
|---|---|---|---|---|
| Democratic | Robert Matsui (Incumbent) | 131,369 | 100.0 | |
| Democratic hold | ||||
1986 edit
| Party | Candidate | Votes | % | |
|---|---|---|---|---|
| Democratic | Robert Matsui (Incumbent) | 158,709 | 75.9 | |
| Republican | Lowell Patrick Landowski | 50,265 | 24.1 | |
| Total votes | 208,974 | 100.0 | ||
| Democratic hold | ||||
1988 edit
| Party | Candidate | Votes | % | |
|---|---|---|---|---|
| Democratic | Robert Matsui (Incumbent) | 183,470 | 71.2 | |
| Republican | Lowell Patrick Landowski | 74,296 | 28.8 | |
| Total votes | 257,766 | 100.0 | ||
| Democratic hold | ||||
1990 edit
| Party | Candidate | Votes | % | |
|---|---|---|---|---|
| Democratic | Robert Matsui (Incumbent) | 132,143 | 60.3 | |
| Republican | Lowell Patrick Landowski | 76,148 | 34.8 | |
| Libertarian | David M. McCann | 10,797 | 4.9 | |
| Total votes | 219,088 | 100.0 | ||
| Democratic hold | ||||
1992 edit
| Party | Candidate | Votes | % | |
|---|---|---|---|---|
| Democratic | Vic Fazio (Incumbent) | 112,149 | 51.2 | |
| Republican | H. L. Richardson | 96,092 | 40.3 | |
| Libertarian | Ross Crain | 20,444 | 8.6 | |
| Total votes | 228,685 | 100.0 | ||
| Democratic hold | ||||
1994 edit
| Party | Candidate | Votes | % | |
|---|---|---|---|---|
| Democratic | Vic Fazio (Incumbent) | 97,093 | 49.75 | |
| Republican | Tim Lefever | 89,964 | 46.10 | |
| Libertarian | Ross Crain | 8,100 | 4.15 | |
| Total votes | 195,157 | 100.0 | ||
| Democratic hold | ||||
1996 edit
| Party | Candidate | Votes | % | |
|---|---|---|---|---|
| Democratic | Vic Fazio (Incumbent) | 118,663 | 53.6 | |
| Republican | Tim Lefever | 91,134 | 41.1 | |
| Reform | Timothy Erich | 7,701 | 3.4 | |
| Libertarian | Erin Donelle | 4,239 | 1.9 | |
| Total votes | 221,737 | 100.0 | ||
| Democratic hold | ||||
1998 edit
| Party | Candidate | Votes | % | |||
|---|---|---|---|---|---|---|
| Republican | Doug Ose | 100,621 | 52.41 | |||
| Democratic | Sandie Dunn | 86,471 | 45.04 | |||
| Libertarian | Ross Crain | 4,914 | 2.56 | |||
| Total votes | 192,006 | 100.0 | ||||
| Republican gain from Democratic | ||||||
2000 edit
| Party | Candidate | Votes | % | |
|---|---|---|---|---|
| Republican | Doug Ose (Incumbent) | 129,254 | 56.2 | |
| Democratic | Bob Kent | 93,067 | 40.4 | |
| Libertarian | Douglas Arthur Tuma | 5,227 | 2.2 | |
| Natural Law | Channing E. Jones | 2,634 | 1.1 | |
| Total votes | 230,182 | 100.0 | ||
| Republican hold | ||||
2002 edit
| Party | Candidate | Votes | % | |
|---|---|---|---|---|
| Republican | Doug Ose (Incumbent) | 117,466 | 62.4 | |
| Democratic | Howard Beeman | 64,990 | 34.5 | |
| Libertarian | Douglas Arthur Tuma | 5,847 | 3.1 | |
| Total votes | 188,303 | 100.0 | ||
| Republican hold | ||||
2004 edit
| Party | Candidate | Votes | % | |
|---|---|---|---|---|
| Republican | Dan Lungren | 177,113 | 61.9 | |
| Democratic | Gabe Castillo | 99,750 | 34.9 | |
| Libertarian | Douglas Tuma | 9,274 | 3.2 | |
| Total votes | 286,137 | 100.0 | ||
| Republican hold | ||||
2006 edit
| Party | Candidate | Votes | % | |
|---|---|---|---|---|
| Republican | Dan Lungren (Incumbent) | 135,709 | 59.5 | |
| Democratic | William E. Durston | 86,318 | 37.8 | |
| Libertarian | Douglas A. Tuma | 3,772 | 1.6 | |
| Peace and Freedom | Michael L. Roskey | 2,370 | 1.0 | |
| Total votes | 228,169 | 100.0 | ||
| Republican hold | ||||
2008 edit
| Party | Candidate | Votes | % | |
|---|---|---|---|---|
| Republican | Dan Lungren (Incumbent) | 155,424 | 49.5 | |
| Democratic | William E. Durston | 137,971 | 44.0 | |
| Libertarian | Douglas A. Tuma | 7,273 | 2.3 | |
| Peace and Freedom | Dina J. Padilla | 13,378 | 4.2 | |
| Total votes | 314,046 | 100.0 | ||
| Republican hold | ||||
2010 edit
| Party | Candidate | Votes | % | |
|---|---|---|---|---|
| Republican | Dan Lungren (Incumbent) | 131,169 | 50 | |
| Democratic | Ami Bera | 113,128 | 43 | |
| American Independent | Jerry L. Leidecker | 6,577 | 3% | |
| Libertarian | Douglas Arthur Tuma | 6,275 | 2% | |
| Peace and Freedom | Mike Roskey | 4,789 | 2% | |
| Total votes | 261,938 | 100 | ||
| Republican hold | ||||
2012 edit
| Party | Candidate | Votes | % | |
|---|---|---|---|---|
| Democratic | John Garamendi (Incumbent) | 126,882 | 54.2% | |
| Republican | Kim Vann | 107,086 | 45.8% | |
| Total votes | 233,968 | 100.0% | ||
| Democratic hold | ||||
2014 edit
| Party | Candidate | Votes | % | |
|---|---|---|---|---|
| Democratic | John Garamendi (Incumbent) | 79,224 | 52.7% | |
| Republican | Dan Logue | 71,036 | 47.3% | |
| Total votes | 150,260 | 100.0% | ||
| Democratic hold | ||||
2016 edit
| Party | Candidate | Votes | % | |
|---|---|---|---|---|
| Democratic | John Garamendi (Incumbent) | 152,513 | 59.4% | |
| Republican | Eugene Cleek | 104,453 | 40.6% | |
| Total votes | 256,966 | 100.0% | ||
| Democratic hold | ||||
2018 edit
| Party | Candidate | Votes | % | |
|---|---|---|---|---|
| Democratic | John Garamendi (Incumbent) | 134,875 | 58.1 | |
| Republican | Charlie Schaupp | 97,376 | 41.9 | |
| Total votes | 232,251 | 100.0 | ||
| Democratic hold | ||||
2020 edit
| Party | Candidate | Votes | % | |
|---|---|---|---|---|
| Democratic | John Garamendi (incumbent) | 176,036 | 54.7 | |
| Republican | Tamika Hamilton | 145,941 | 45.3 | |
| Total votes | 321,977 | 100.0 | ||
| Democratic hold | ||||
2022 edit
| Party | Candidate | Votes | % | ||
|---|---|---|---|---|---|
| Republican | Kevin Kiley | 181,438 | 53.6 | ||
| Democratic | Kermit Jones | 156,761 | 46.4 | ||
| Total votes | 338,199 | 100.0 | |||
| Republican win (new seat) | |||||
Historical district boundaries edit

See also edit
References edit
- ^ a b "CA 2022 Congressional". Dave's Redistricting. January 4, 2022. Retrieved November 11, 2022.
- ^ "My Congressional District: Congressional District 3 (118th Congress), California". United States Census Bureau.
- ^ "2022 Cook PVI: District Map and List". Cook Political Report. Retrieved January 10, 2023.
- ^ "Maps: Final Congressional Districts". Citizens Redistricting Commission. Archived from the original on March 10, 2013. Retrieved February 24, 2013.
- ^ "Counties by Congressional District for Recall Question" (PDF). sos.ca.gov. September 14, 2021. Retrieved May 2, 2022.
- ^ "Counties by Congressional Districts for Governor" (PDF). sos.ca.gov. November 8, 2022. Retrieved May 4, 2023.
- ^ "Statement of Vote (2000 President)" (PDF). Archived from the original (PDF) on May 20, 2011. Retrieved September 17, 2008.
- ^ "Statement of Vote (2000 Senator)" (PDF). Archived from the original (PDF) on May 20, 2011. Retrieved September 17, 2008.
- ^ "Statement of Vote (2002 Governor)" (PDF). Archived from the original (PDF) on November 11, 2010. Retrieved April 5, 2023.
- ^ "Statement of Vote (2003 Recall Question)" (PDF). Archived from the original (PDF) on May 20, 2011. Retrieved October 8, 2007.
- ^ "Statement of Vote (2003 Governor)" (PDF). Archived from the original (PDF) on May 20, 2011. Retrieved October 8, 2007.
- ^ "Statement of Vote (2004 President)" (PDF). Archived from the original (PDF) on May 20, 2011. Retrieved August 8, 2007.
- ^ "Statement of Vote (2004 Senator)" (PDF). Archived from the original (PDF) on August 10, 2011. Retrieved April 5, 2023.
- ^ "Statement of Vote (2006 Governor)" (PDF). Archived from the original (PDF) on August 10, 2011. Retrieved April 5, 2023.
- ^ "Statement of Vote (2006 Senator)" (PDF). Archived from the original (PDF) on August 10, 2011. Retrieved April 5, 2023.
- ^ "(2008 President)". Archived from the original on June 26, 2009. Retrieved March 5, 2009.
- ^ "Statement of Vote (2010 Governor)" (PDF). Archived from the original (PDF) on May 20, 2011. Retrieved May 6, 2011.
- ^ "Statement of Vote (2010 Governor" (PDF). Archived from the original (PDF) on May 20, 2011. Retrieved May 6, 2011.
- ^ 1920 general election results
- ^ "1922 general election results" (PDF). Retrieved April 5, 2023.
- ^ 1924 general election results
- ^ 1926 general election results
- ^ 1928 general election results
- ^ 1930 general election results
- ^ 1932 general election results
- ^ 1934 general election results
- ^ 1936 general election results
- ^ 1938 general election results
- ^ 1940 general election results
- ^ 1942 general election results
- ^ 1944 general election results
- ^ 1946 general election results
- ^ 1948 general election results
- ^ 1950 general election results
- ^ 1952 general election results
- ^ 1954 general election results
- ^ 1956 general election results
- ^ 1958 general election results
- ^ 1960 general election results
- ^ 1962 general election results
- ^ 1964 general election results
- ^ 1966 general election results
- ^ 1968 general election results
- ^ 1970 general election results
- ^ 1972 general election results
- ^ 1974 general election results
- ^ 1976 general election results
- ^ 1978 general election results
- ^ 1980 general election results
- ^ 1982 general election results
- ^ 1984 general election results
- ^ 1986 general election results
- ^ 1988 general election results
- ^ 1990 general election results
- ^ 1992 general election results
- ^ 1994 general election results
- ^ 1996 general election results
- ^ 1998 general election results
- ^ 2000 general election results
- ^ 2002 general election results Archived February 3, 2009, at the Wayback Machine
- ^ 2004 general election results Archived August 21, 2008, at the Wayback Machine
- ^ 2006 general election results Archived November 27, 2008, at the Wayback Machine
- ^ 2008 general election results Archived December 21, 2008, at the Wayback Machine
- ^ 2010 general election results[permanent dead link]
- ^ https://elections.cdn.sos.ca.gov/sov/2012-general/06-sov-summary.xls
- ^ https://elections.cdn.sos.ca.gov/sov/2014-general/xls/06-summary.xls
- ^ https://elections.cdn.sos.ca.gov/sov/2016-general/sov/csv-candidates.xls
External links edit
- GovTrack.us: California's 3rd congressional district
- RAND California Election Returns: District Definitions (out of date)
- California Voter Foundation map - CD03 (out of date)
- California Citizens Redistricting Commission, final districts [1]