Wikipedia talk:Using maps and similar sources in Wikipedia articles
| Essays Low‑impact | ||||||||||
| ||||||||||


The discussion of whether or not maps are source material resulted in an article in User:Moabdave's area. This essay was known to a few Wikipedia editors, while others debated the issue. I have moved this article into WP: space so that everybody with an interest in the use of maps as sources can see it and debate it. Martinvl (talk) 07:32, 5 June 2011 (UTC)
Some comments on the essay
edit- "Editor created maps should be careful to only depict details supported by reliable sources in the article and common information that would appear on any published map relating to the subject."
- We must remember that a map might be used to illustrate several articles and it would be onerous if all the sources of the map have to be cited each time the map is used. I think it should be sufficient if the reliable sources on which the map is based are cited on the image description page. On the last part of this sentence, I don't know why that should be required. For example a user might base a map on a detailed published source and include information not on less detailed published sources.
- "It is quite in order to state the “Valley X is ‘U’ shaped".
- I really think that would be original research, since there is a continuum of valley shapes and some judgment (or even careful measurement of contours) would be needed to decide whether the valley is U-shaped.
Here are some things that I think would be OK to source to a (reliably published) map.
- 1. "Cities X and Y are about 80km apart" (in a straight line) — provided the map has a scale and the precision claimed is within reason for this map.
- 2. "Road X crosses river Y"
- 3. "River R passes though the built up area of city Z" — provided the map shows the extent of the built up area
And some things that I think would be NOT OK.
- 1. "City X lies on the slopes of Mount Y" — because "slopes" is not an objectively defined concept.
- 2. "The length of road A (or river B) is 20km" — unless the map indicates the length of the road (this could be relaxed if only a very rough length is derived).
- 3. "From village V it is possible to see the ocean" — because this needs careful measurement and even calculation to derive from the map.
Zerotalk 10:29, 5 June 2011 (UTC)
- Response to above
- I agree with what is written above apart from:
- I see no problem with an editor citing a map to support the assertion that a valley is "U-shaped" if the map shows this as obviously the case. The test for this is a standard part of the geography syllabus at most secondary schools. Consensus should centre around the word "obvious", not the word "map".
- I disagree abouth the statement "City X lies on the slopes of Mount Y" - as with my previous comment, other editors should be able challenge this statement on grounds that it is not obvious from the map, not on the grounds that a map was used. Again, the test for this is taught at schools.
- I would relax the condition of the length of a road a little more - if the road is very close to being straight, then I see no problem with measuring its length off a map - again subject to the consensus described above.
- Martinvl (talk)
- I agree that consensus can take care of boundary cases lots of the time. The difficulty with the rules is when specialist expertise is required for something to be "obvious". It would appear to be against WP:OR for someone who is an expert in real life to insist that something is obvious from a map when others cannot see it. Zerotalk 03:15, 6 June 2011 (UTC)
- I have added a "Two disciplines" test, giving a Saddle point as an example - both mathematicians and geographers use the same techniques to identify saddle points. Similarly, all sorts of people talk about gradients and use closeness of contours to define the gradient - I do it when I teach physics to 17 & 18 year-old students with reference to electric fields. The rules are exactly the same in geography. Martinvl (talk) 16:51, 7 June 2011 (UTC)
Line Charts
editMy only comment on the recent addition of line charts, is I wonder how big of a deal this is with line charts. I'm absolutely sure that somewhere out there a policy nazi is screaming original research about them. However, unlike maps, a line chart is useful for one purpose and one purpose only, to show a trend of the relationship between (usually) 2 variables. Any other use would be original research. Whereas with maps that scope of use is less clear. Dave (talk) 14:11, 8 May 2012 (UTC)
- Dave, I am inclined to agree with you, but somebody has been crying out "original research" which is why I extended this essay. Fortunately we had been sufficiently general in our description that I did not have to adapt any of the concepts. I have done the honourable thing and invited them to this discussion. Martinvl (talk) 14:50, 8 May 2012 (UTC)
- Good luck with that battle. I've had to fight it a few times during my FAC nominations. There are some people who do not understand that not everything has to be spelled out in prose. Pulling data from a table is not original research, unless you made the table. =-) Dave (talk) 15:54, 8 May 2012 (UTC)
- I have taken the liberty of adding a map that I have used, and others have used for both purposes, source and illustration. Hopefully having some examples will help. Feel free to tweak or undo if this was not a step in the right direction. Dave (talk) 16:19, 8 May 2012 (UTC)
- Dave, I like your map and I have taken the librty of promoting it into the lede. Martinvl (talk) 16:35, 8 May 2012 (UTC)
Leap seconds
edit"Remember that people who have good spacial visualisation ability have no problem using maps, but people who have poor spacial visualisation ability may find it difficult to relate to maps. This is often the underlying reason for disputes as to what constitutes original research and what does not."
I take issue with the above statement. I don't know whether I'm good or bad at reading maps and charts but I know there are many ways to misread and there are many ways to build charts with the intention of misleading.
Sometimes the data is complicated enough to defy a visual read. Here's a line chart we've been discussing in the context of WP:OR. Is this trending up, down or flat? Am I allowed to choose the interval of interest or must I consider the whole dataset? In either case, how can I stay clear of Cherry picking (fallacy) issues? If I use regression analysis to help cut the noise and if that does not meet WP:CALC criteria, I have to conclude that is it WP:OR. --Kvng (talk) 19:17, 8 May 2012 (UTC)
- Please look at the graph in this paper and compare it to the reference that you gave me. The one that you gave me is incorporated into the one that I mentioned. The big picture highlights the anomaly for the eighteenth century and it is the sort of thing that I would expect a school-child to pick up, which is why I do not regsard it as WP:OR - remember WP:OR is defined as "Wikipedia articles must not contain original research", so is something that we woudl expect s schoolboy topick up original research or is it something to which the author of the paper said "That is not really relevant to what I am writing and it is so damned obvious I am not going to waste time memtioning it". Martinvl (talk) 19:58, 8 May 2012 (UTC)
- It would be nice if one of you could either copy or point to the disputed statement that lead to this discussion. Just looking at the graph at the bottom of [1], I think the graph safely supports any of the following statements:
- Between 1623 and the early 1700s the average duration of the day has increased by approximately 12 milliseconds.
- From the early 1700s to 2005 the duration of the day has trended slightly upward; increasing by a fraction of a millisecond.
- There was a decline in day duration during the latter half of the 19th century.
- Dave (talk) 21:13, 8 May 2012 (UTC)
- It would be nice if one of you could either copy or point to the disputed statement that lead to this discussion. Just looking at the graph at the bottom of [1], I think the graph safely supports any of the following statements:
Using the data from the IERS page would simply be inadequate research. It clearly states that the data came from Stephenson and Morrison (1984). Much better is to find the data Stephenson and Morrison(1995) and Morrison and Stephenson (2001) wherein it is evident that the LOD value for 1623 was an aberration either because it was a very early observation or during a large decadal variation of faster rotation.Steven L Allen (talk) 22:09, 8 May 2012 (UTC)
- The graph in [2] includes data points derived using various means. There is a flat spot from 1735 to 1860. There also are no error bars, no indication of how many data points there are at various points along the graph or where they came from. Now Steven Allen has chimed in and informed that there may be bad data in the graph. My assertion is that it really does take more than a school child to extract reliable information from this raw data. And I don't believe this is an exceptional case. --Kvng (talk) 01:36, 9 May 2012 (UTC)
- I'm not disputing any of the above points, however the reliability and completeness of the source are separate issues from the original claim, which was of original research. The above statements I made are what could, in my opinion, be safely extracted from the graph without violating the principle of "no original research." If the source is incomplete or inaccurate is a separate issue that goes to a different policy. It is for that exact reason that I requested that someone link to the actual statement that is the source of this controversy, so those wishing to participate could learn the full context. I'm still waiting for someone to link to that statement. Dave (talk) 03:34, 9 May 2012 (UTC)
- The graph in [2] includes data points derived using various means. There is a flat spot from 1735 to 1860. There also are no error bars, no indication of how many data points there are at various points along the graph or where they came from. Now Steven Allen has chimed in and informed that there may be bad data in the graph. My assertion is that it really does take more than a school child to extract reliable information from this raw data. And I don't believe this is an exceptional case. --Kvng (talk) 01:36, 9 May 2012 (UTC)
- Dave, visit Talk:Leap_second#Slowing_of_earth_and_leap_seconds_in_Unix_time for that discussion. If you don't find it there, leave a note and I'll point it out more specifically. --Kvng (talk) 12:49, 9 May 2012 (UTC)
western sahara
edithi all - there is a considerable amount of maps being used on wikipedia that i believe are in breach of exiting policies on disputed borders, and territorial claims of colonised countries. i believe this is hugely the case for western sahara (a forgotten conflict in the desert, with 200k+ displaced refugees, and 20k deaths, over the last 50 years or so..).
listing few examples here, but would love to get a view on what can be done to allow an accurate representation of things.
-
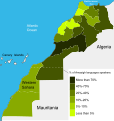 maroco claims the territory, with limited recognition

quoting this page: `Any cultural bias apparent in a map (such as a disputed boundary or a territory claimed by two entities) should be clearly explained in a neutral fashion.`
id appreciate some guidance on how this could be handled?
- My apologies, I don't understand the situation. This isn't worded very clearly. But I would say if this map shows data from the point of view of the Moroccan Government, there are numerous ways to state that in the article without showing bias yourself. "Map showing the region as defined by the Moroccan Government", or "Disputed area shown with Moroccan names" or "Moroccan produced map of x, called y by separatists" or something like that. The idea is to word it so the reader can still infer value from the map, but knows the map is biased and somewhere out there are maps showing different boundaries or regional names. If you can clarify your question I can try to give a more specific opinion. I would look to the article on the Falkland Islands sovereignty dispute, they've been dealing with this issue for years. What they have done is at the bottom of the article are two maps presented side by side, one with the British point of view, the other with the Argentina POV. Dave (talk) 19:39, 24 February 2022 (UTC)
Proposed changes to this essay
editFYI, there is a debate about both the content of this essay, as well as if it merits elevation to policy. This is occurring at
I've made some (hopefully innocent) improvements and clarifications based on that discussion. Dave (talk) 22:39, 4 December 2022 (UTC)
- Hi @Moabdave. FYI, there's a related discussion here: Wikipedia_talk:No_original_research#Maps,_OR,_and_SYNTHESIS (and if you want to jump to its conclusions). A455bcd9 (talk) 08:41, 5 December 2022 (UTC)
- Thanks. Yeah, so we've got 3 simultaneous debates that directly or tangentially touch upon the issues in this essay. I'll chime in, and let's hope some good comes out of this.Dave (talk) 14:26, 5 December 2022 (UTC)