| |||||||||||||||||||||||||||||||||||||||||||||||||||||||||||||||||||||||||||||
All 650 seats in the House of Commons[1] 326 seats needed for a majority | |||||||||||||||||||||||||||||||||||||||||||||||||||||||||||||||||||||||||||||
|---|---|---|---|---|---|---|---|---|---|---|---|---|---|---|---|---|---|---|---|---|---|---|---|---|---|---|---|---|---|---|---|---|---|---|---|---|---|---|---|---|---|---|---|---|---|---|---|---|---|---|---|---|---|---|---|---|---|---|---|---|---|---|---|---|---|---|---|---|---|---|---|---|---|---|---|---|---|
| Opinion polls | |||||||||||||||||||||||||||||||||||||||||||||||||||||||||||||||||||||||||||||
| Registered | 46,354,197 | ||||||||||||||||||||||||||||||||||||||||||||||||||||||||||||||||||||||||||||
| Turnout | 66.4%[2] ( | ||||||||||||||||||||||||||||||||||||||||||||||||||||||||||||||||||||||||||||
| |||||||||||||||||||||||||||||||||||||||||||||||||||||||||||||||||||||||||||||
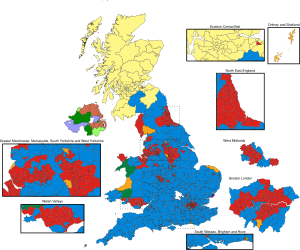
 Colours denote the winning party, as shown in the main table of results. † Figure does not include the Speaker of the House of Commons John Bercow, who was included in the Conservative seat total by some media outlets. | |||||||||||||||||||||||||||||||||||||||||||||||||||||||||||||||||||||||||||||
 Composition of the House of Commons after the election | |||||||||||||||||||||||||||||||||||||||||||||||||||||||||||||||||||||||||||||
| |||||||||||||||||||||||||||||||||||||||||||||||||||||||||||||||||||||||||||||
- ^ UK 2015 general election results in full The Guardian (retrieved 5 May 2024)
- ^ "The May 2015 UK elections: Report on the administration of the 7 May 2015 elections, including the UK Parliamentary general election" (PDF). p. 3. Archived (PDF) from the original on 22 February 2017. Retrieved 15 May 2016.
Cite error: There are <ref group=n> tags on this page, but the references will not show without a {{reflist|group=n}} template (see the help page).


