User:DukeOfDelTaco/sandbox/Results of the 2016 United States presidential election
| This is not a Wikipedia article: This is a workpage, a collection of material and work in progress that may or may not be incorporated into an article. It should not necessarily be considered factual or authoritative. |
| |||||||||||||||||||||||||||||
538 members of the Electoral College 270 electoral votes needed to win | |||||||||||||||||||||||||||||
|---|---|---|---|---|---|---|---|---|---|---|---|---|---|---|---|---|---|---|---|---|---|---|---|---|---|---|---|---|---|
| |||||||||||||||||||||||||||||
| |||||||||||||||||||||||||||||

.jpg)
2016 U.S. presidential election | |
|---|---|
| Republican Party | |
| Democratic Party | |
| Third parties | |
| Related races | |
| |
This workpage details the results of the 2016 United States presidential election, which was the 58th quadrennial presidential election held on November 8, 2016. Republican nominee Donald Trump, a businessman from New York, defeated Democratic nominee Hillary Clinton, the former secretary of state.
Clinton led in almost every nationwide and swing-state poll with some experts predicting a landslide, however as the election neared her margins decreased. On Election Day, Trump over-performed his polls, winning several key swing-states, while losing the popular vote by 2.87 million votes. Trump received the majority in the Electoral College and won upset victories in the pivotal Rust Belt region. Ultimately, Trump received 304 electoral votes and Clinton 227, as two faithless electors defected from Trump and five from Clinton. Trump was the first president with neither prior public service nor military experience.
Trump flipped six states that voted Democratic in 2012: Florida, Iowa, Michigan, Ohio, Pennsylvania, and Wisconsin, as well as Maine's 2nd congressional district. He was the first Republican to win the presidency without Colorado or Nevada since 1908; he was also the first Republican to win without Virginia since 1924. As of 2024, this was the last time that Arizona, Georgia, Michigan, Pennsylvania, Wisconsin, and Nebraska's 2nd congressional district voted for the Republican nominee.
Overview edit
-
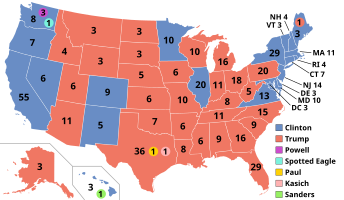
Presidential election results map. Red denotes states won by Trump/Pence and blue denotes those won by Clinton/Kaine. Numbers indicate electoral votes cast by each state and the District of Columbia. On election night, Trump won 306 electors and Clinton 232. However, because of seven faithless electors (five Democratic and two Republican), Trump received just 304 votes to Clinton's 227. -
 Results by state, shaded according to winning candidate's margin of victory. Trump performed best in Wyoming, while Clinton performed the best in the District of Columbia. The closest state was Michigan.
 -
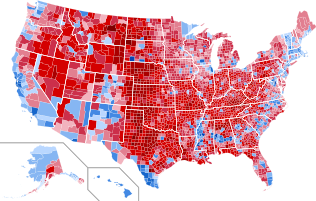 Results by county, shaded according to winning candidate's percentage of the vote.
 -
 Change in vote margins at the county level from the 2012 election to the 2016 election.


Results edit
| 227 | 304 | |
| Hillary Clinton | Donald Trump |
| Presidential candidate | Party | Home state | Popular vote | Electoral vote |
Running mate | |||
|---|---|---|---|---|---|---|---|---|
| Count | Percentage | Vice-presidential candidate | Home state | Electoral vote | ||||
| Donald Trump | Republican | New York | 62,984,828 | 46.09% | 304 | Mike Pence | Indiana | 304 |
| Hillary Clinton | Democratic | New York | 65,853,514 | 48.18% | 227 | Tim Kaine | Virginia | 227 |
| Gary Johnson | Libertarian | New Mexico | 4,489,341 | 3.28% | 0 | Bill Weld | Massachusetts | 0 |
| Jill Stein | Green | Massachusetts | 1,457,218 | 1.07% | 0 | Ajamu Baraka | Illinois | 0 |
| Evan McMullin | Independent | Utah | 731,991 | 0.54% | 0 | Mindy Finn | Texas | 0 |
| Darrell Castle | Constitution | Tennessee | 203,090 | 0.15% | 0 | Scott Bradley | Utah | 0 |
| Gloria La Riva | Socialism and Liberation | California | 74,401 | 0.05% | 0 | Eugene Puryear | District of Columbia | 0 |
| Rocky De La Fuente | American Delta | California | 33,136 | 0.02% | 0 | Michael Steinberg | Florida | 0 |
| Richard Duncan | Independent | Ohio | 24,307 | 0.02% | 0 | Ricky Johnson | Pennsylvania | 0 |
| Dan Vacek | Legal Marijuana Now | Minnesota | 13,537 | 0.01% | 0 | Mark Elworth Jr. | Nebraska | 0 |
| Alyson Kennedy | Socialist Workers | Illinois | 12,467 | 0.01% | 0 | Osborne Hart | Pennsylvania | 0 |
| Mike Smith | Independent | – | 9,338 | 0.01% | 0 | Daniel White | – | 0 |
| Chris Keniston | Veterans | Texas | 7,211 | 0.01% | 0 | Deacon Taylor | Florida | 0 |
| Other | 874,893 | 0.64% | — | Other | — | |||
| Total | 136,669,276 | 100% | 538 | 538 | ||||
| Needed to win | 270 | 270 | ||||||
Summary table edit
State or
district |
Donald Trump Republican |
Hillary Clinton Democratic |
Gary Johnson Libertarian |
Jill Stein Green |
Evan McMullin Independent |
Darrell Castle Constitution |
Others | Margin | Margin swing |
Total votes | |||||||||||||||
|---|---|---|---|---|---|---|---|---|---|---|---|---|---|---|---|---|---|---|---|---|---|---|---|---|---|
| Votes | % | EV
|
Votes | % | EV
|
Votes | % | EV
|
Votes | % | EV
|
Votes | % | EV
|
Votes | % | EV
|
Votes | % | EV
|
Votes | % | % | ||
| Alabama | 1,318,255 | 62.08% | 9 | 729,547 | 34.36% | – | 44,467 | 2.09% | – | 9,391 | 0.44% | – | – | – | – | – | – | – | 21,712 | 1.02% | – | 588,708 | 27.72% | 5.53% | 2,123,372 |
| Alaska | 163,387 | 51.28% | 3 | 116,454 | 36.55% | – | 18,725 | 5.88% | – | 5,735 | 1.80% | – | – | – | – | 3,866 | 1.21% | – | 10,441 | 3.28% | – | 46,933 | 14.73% | 0.74% | 318,608 |
| Arizona | 1,252,401 | 48.67% | 11 | 1,161,167 | 45.13% | – | 106,327 | 4.13% | – | 34,345 | 1.33% | – | 17,449 | 0.68% | – | 1,058 | 0.04% | – | 418 | 0.02% | – | 91,234 | 3.55% | -5.51% | 2,573,165 |
| Arkansas | 684,872 | 60.57% | 6 | 380,494 | 33.65% | – | 29,949 | 2.65% | – | 9,473 | 0.84% | – | 13,176 | 1.17% | – | 4,613 | 0.41% | – | 8,099 | 0.72% | – | 304,378 | 26.92% | 3.23% | 1,130,676 |
| California | 4,483,814 | 31.62% | – | 8,753,792 | 61.73% | 55 | 478,500 | 3.37% | – | 278,658 | 1.96% | – | 39,596 | 0.28% | – | – | – | – | 147,244 | 1.04% | – | -4,269,978 | -30.11% | -6.99% | 14,181,604 |
| Colorado | 1,202,484 | 43.25% | – | 1,338,870 | 48.16% | 9 | 144,121 | 5.18% | – | 38,437 | 1.38% | – | 28,917 | 1.04% | – | 11,699 | 0.42% | – | 15,719 | 0.56% | – | -136,386 | -4.90% | 0.46% | 2,780,247 |
| Connecticut | 673,215 | 40.93% | – | 897,572 | 54.57% | 7 | 48,676 | 2.96% | – | 22,841 | 1.39% | – | 2,108 | 0.13% | – | 147 | 0.01% | – | 361 | 0.02% | – | -224,357 | -13.64% | 3.69% | 1,644,920 |
| Delaware | 185,127 | 41.71% | – | 235,603 | 53.09% | 3 | 14,757 | 3.33% | – | 6,103 | 1.38% | – | 706 | 0.16% | – | 74 | 0.02% | – | 37 | 0.01% | – | -50,476 | -11.37% | 7.26% | 443,814 |
| D.C. | 12,723 | 4.09% | – | 282,830 | 90.86% | 3 | 4,906 | 1.58% | – | 4,258 | 1.37% | – | – | – | – | – | – | – | 6,551 | 2.10% | – | -270,107 | -86.78% | -3.15% | 311,268 |
| Florida | 4,617,886 | 49.02% | 29 | 4,504,975 | 47.82% | – | 207,043 | 2.20% | – | 64,399 | 0.68% | – | – | – | – | 16,475 | 0.17% | – | 9,261 | 0.10% | – | 112,911 | 1.20% | 2.08% | 9,420,039 |
| Georgia | 2,089,104 | 50.77% | 16 | 1,877,963 | 45.64% | – | 125,306 | 3.05% | – | 7,674 | 0.19% | – | 13,017 | 0.32% | – | 1,110 | 0.03% | – | 558 | 0.01% | – | 211,141 | 5.13% | -2.69% | 4,114,732 |
| Hawaii | 128,847 | 30.04% | – | 266,891 | 62.22% | 3 | 15,954 | 3.72% | – | 12,737 | 2.97% | – | – | – | – | 4,508 | 1.05% | – | – | – | 1 | -138,044 | -32.18% | 10.53% | 428,937 |
| Idaho | 409,055 | 59.26% | 4 | 189,765 | 27.49% | – | 28,331 | 4.10% | – | 8,496 | 1.23% | – | 46,476 | 6.73% | – | 4,403 | 0.64% | – | 3,729 | 0.54% | – | 219,290 | 31.77% | -0.14% | 690,255 |
| Illinois | 2,146,015 | 38.76% | – | 3,090,729 | 55.83% | 20 | 209,596 | 3.79% | – | 76,802 | 1.39% | – | 11,655 | 0.21% | – | 1,138 | 0.02% | – | 489 | 0.01% | – | -944,714 | -17.06% | -0.19% | 5,536,424 |
| Indiana | 1,557,286 | 56.94% | 11 | 1,033,126 | 37.77% | – | 133,993 | 4.90% | – | 7,841 | 0.29% | – | – | – | – | 1,937 | 0.07% | – | 775 | 0.03% | – | 524,160 | 19.16% | 8.96% | 2,734,958 |
| Iowa | 800,983 | 51.15% | 6 | 653,669 | 41.74% | – | 59,186 | 3.78% | – | 11,479 | 0.73% | – | 12,366 | 0.79% | – | 5,335 | 0.34% | – | 23,013 | 1.47% | – | 147,314 | 9.41% | 15.22% | 1,566,031 |
| Kansas | 671,018 | 56.65% | 6 | 427,005 | 36.05% | – | 55,406 | 4.68% | – | 23,506 | 1.98% | – | 6,520 | 0.55% | – | 646 | 0.05% | – | 301 | 0.02% | – | 244,013 | 20.60% | -1.12% | 1,184,402 |
| Kentucky | 1,202,971 | 62.52% | 8 | 628,854 | 32.68% | – | 53,752 | 2.79% | – | 13,913 | 0.72% | – | 22,780 | 1.18% | – | 438 | 0.02% | – | 1,441 | 0.07% | – | 574,117 | 29.84% | 7.15% | 1,924,149 |
| Louisiana | 1,178,638 | 58.09% | 8 | 780,154 | 38.45% | – | 37,978 | 1.87% | – | 14,031 | 0.69% | – | 8,547 | 0.42% | – | 3,129 | 0.15% | – | 6,555 | 0.32% | – | 398,484 | 19.64% | 2.43% | 2,029,032 |
| Maine | 335,593 | 44.87% | – | 357,735 | 47.83% | 2 | 38,105 | 5.09% | – | 14,251 | 1.91% | – | 1,887 | 0.25% | – | 333 | 0.04% | – | 23 | 0.00% | – | -22,142 | -2.96% | 12.33% | 747,927 |
| ME-01 | 154,384 | 39.15% | – | 212,774 | 53.96% | 1 | 18,592 | 4.71% | – | 7,563 | 1.92% | – | 807 | 0.20% | – | 203 | 0.05% | – | 6 | 0.00% | – | -58,390 | -14.81% | % | 394,329 |
| ME-02 | 181,177 | 51.26% | 1 | 144,817 | 40.98% | – | 19,510 | 5.52% | – | 6,685 | 1.89% | – | 1,080 | 0.31% | – | 130 | 0.04% | – | 17 | 0.00% | – | 36,360 | 10.29% | % | 353,416 |
| Maryland | 943,169 | 33.91% | – | 1,677,928 | 60.33% | 10 | 79,605 | 2.86% | – | 35,945 | 1.29% | – | 9,630 | 0.35% | – | 566 | 0.02% | – | 34,603 | 1.24% | – | -734,759 | -26.42% | -0.34% | 2,781,446 |
| Massachusetts | 1,090,893 | 32.81% | – | 1,995,196 | 60.01% | 11 | 138,018 | 4.15% | – | 47,661 | 1.43% | – | 2,719 | 0.08% | – | – | – | – | 50,599 | 1.52% | – | -904,303 | -27.20% | -4.06% | 3,325,046 |
| Michigan | 2,279,543 | 47.50% | 16 | 2,268,839 | 47.27% | – | 172,136 | 3.59% | – | 51,463 | 1.07% | – | 8,177 | 0.17% | – | 16,139 | 0.34% | – | 2,987 | 0.06% | – | 10,704 | 0.22% | 9.72% | 4,799,284 |
| Minnesota | 1,322,951 | 44.92% | – | 1,367,716 | 46.44% | 10 | 112,972 | 3.84% | – | 36,985 | 1.26% | – | 53,076 | 1.80% | – | 9,456 | 0.32% | – | 41,657 | 1.41% | – | -44,765 | -1.52% | 6.17% | 2,944,813 |
| Mississippi | 700,714 | 57.94% | 6 | 485,131 | 40.11% | – | 14,435 | 1.19% | – | 3,731 | 0.31% | – | – | – | – | 3,987 | 0.33% | – | 1,359 | 0.11% | – | 215,583 | 17.83% | 6.33% | 1,209,357 |
| Missouri | 1,594,511 | 56.77% | 10 | 1,071,068 | 38.14% | – | 97,359 | 3.47% | – | 25,419 | 0.91% | – | 7,071 | 0.25% | – | 13,092 | 0.47% | – | 85 | 0.00% | – | 523,443 | 18.64% | 9.26% | 2,808,605 |
| Montana | 279,240 | 56.17% | 3 | 177,709 | 35.75% | – | 28,037 | 5.64% | – | 7,970 | 1.60% | – | 2,297 | 0.46% | – | 296 | 0.06% | – | 1,598 | 0.32% | – | 101,531 | 20.42% | 6.77% | 497,147 |
| Nebraska | 495,961 | 58.75% | 2 | 284,494 | 33.70% | – | 38,946 | 4.61% | – | 8,775 | 1.04% | – | – | – | – | – | – | – | 16,051 | 1.90% | – | 211,467 | 25.05% | 3.27% | 844,227 |
| NE-01 | 158,642 | 56.18% | 1 | 100,132 | 35.46% | – | 14,033 | 4.97% | – | 3,374 | 1.19% | – | – | – | – | – | – | – | 6,181 | 2.19% | – | 58,510 | 20.72% | % | 282,362 |
| NE-02 | 137,564 | 47.16% | 1 | 131,030 | 44.92% | – | 13,245 | 4.54% | – | 3,347 | 1.15% | – | – | – | – | – | – | – | 6,494 | 2.23% | – | 6,534 | 2.24% | % | 291,680 |
| NE-03 | 199,755 | 73.91% | 1 | 53,332 | 19.73% | – | 11,668 | 4.32% | – | 2,054 | 0.76% | – | – | – | – | – | – | – | 3,451 | 1.28% | – | 146,423 | 54.18% | % | 270,260 |
| Nevada | 512,058 | 45.50% | – | 539,260 | 47.92% | 6 | 37,384 | 3.32% | – | – | – | – | – | – | – | 5,268 | 0.47% | – | 31,415 | 2.79% | – | -27,202 | -2.42% | 4.26% | 1,125,385 |
| New Hampshire | 345,790 | 46.46% | – | 348,526 | 46.83% | 4 | 30,777 | 4.14% | – | 6,496 | 0.87% | – | 1,064 | 0.14% | – | – | – | – | 11,643 | 1.56% | – | -2,736 | -0.37% | 5.21% | 744,296 |
| New Jersey | 1,601,933 | 41.35% | – | 2,148,278 | 55.45% | 14 | 72,477 | 1.87% | – | 37,772 | 0.98% | – | – | – | – | 6,161 | 0.16% | – | 7,425 | 0.19% | – | -546,345 | -14.10% | 3.69% | 3,874,046 |
| New Mexico | 319,667 | 40.04% | – | 385,234 | 48.26% | 5 | 74,541 | 9.34% | – | 9,879 | 1.24% | – | 5,825 | 0.73% | – | 1,514 | 0.19% | – | 1,659 | 0.21% | – | -65,567 | -8.21% | 1.94% | 798,319 |
| New York | 2,819,533 | 36.52% | – | 4,556,118 | 59.01% | 29 | 176,598 | 2.29% | – | 107,935 | 1.40% | – | 10,397 | 0.13% | – | 955 | 0.01% | – | 49,906 | 0.65% | – | -1,736,585 | -22.49% | 5.69% | 7,721,442 |
| North Carolina | 2,362,631 | 49.83% | 15 | 2,189,316 | 46.17% | – | 130,126 | 2.74% | – | 12,105 | 0.26% | – | – | – | – | – | – | – | 47,386 | 1.00% | – | 173,315 | 3.65% | 1.61% | 4,741,564 |
| North Dakota | 216,794 | 62.96% | 3 | 93,758 | 27.23% | – | 21,434 | 6.22% | – | 3,780 | 1.10% | – | – | – | – | 1,833 | 0.53% | – | 6,761 | 1.96% | – | 123,036 | 35.73% | 16.10% | 344,360 |
| Ohio | 2,841,005 | 51.69% | 18 | 2,394,164 | 43.56% | – | 174,498 | 3.17% | – | 46,271 | 0.84% | – | 12,574 | 0.23% | – | 1,887 | 0.03% | – | 26,088 | 0.47% | – | 446,841 | 8.13% | 11.11% | 5,496,487 |
| Oklahoma | 949,136 | 65.32% | 7 | 420,375 | 28.93% | – | 83,481 | 5.75% | – | – | – | – | – | – | – | – | – | – | – | – | – | 528,761 | 36.39% | 2.85% | 1,452,992 |
| Oregon | 782,403 | 39.09% | – | 1,002,106 | 50.07% | 7 | 94,231 | 4.71% | – | 50,002 | 2.50% | – | – | – | – | – | – | – | 72,594 | 3.63% | – | -219,703 | -10.98% | 1.11% | 2,001,336 |
| Pennsylvania | 2,970,733 | 48.18% | 20 | 2,926,441 | 47.46% | – | 146,715 | 2.38% | – | 49,941 | 0.81% | – | 6,472 | 0.10% | – | 21,572 | 0.35% | – | 43,604 | 0.71% | – | 44,292 | 0.72% | 6.10% | 6,165,478 |
| Rhode Island | 180,543 | 38.90% | – | 252,525 | 54.41% | 4 | 14,746 | 3.18% | – | 6,220 | 1.34% | – | 773 | 0.17% | – | 52 | 0.01% | – | 9,285 | 2.00% | – | -71,982 | -15.51% | 11.95% | 464,144 |
| South Carolina | 1,155,389 | 54.94% | 9 | 855,373 | 40.67% | – | 49,204 | 2.34% | – | 13,034 | 0.62% | – | 21,016 | 1.00% | – | 5,765 | 0.27% | – | 3,246 | 0.15% | – | 300,016 | 14.27% | 3.80% | 2,103,027 |
| South Dakota | 227,721 | 61.53% | 3 | 117,458 | 31.74% | – | 20,850 | 5.63% | – | – | – | – | – | – | – | 4,064 | 1.10% | – | – | – | – | 110,263 | 29.79% | 11.77% | 370,093 |
| Tennessee | 1,522,925 | 60.72% | 11 | 870,695 | 34.72% | – | 70,397 | 2.81% | – | 15,993 | 0.64% | – | 11,991 | 0.48% | – | 1,584 | 0.06% | – | 14,442 | 0.58% | – | 652,230 | 26.01% | 5.61% | 2,508,027 |
| Texas | 4,685,047 | 52.23% | 36 | 3,877,868 | 43.24% | – | 283,492 | 3.16% | – | 71,558 | 0.80% | – | 42,366 | 0.47% | – | 4,261 | 0.05% | – | 4,634 | 0.05% | 2 | 807,179 | 9.00% | -6.78% | 8,969,226 |
| Utah | 515,231 | 45.54% | 6 | 310,676 | 27.46% | – | 39,608 | 3.50% | – | 9,438 | 0.83% | – | 243,690 | 21.54% | – | 8,032 | 0.71% | – | 4,755 | 0.42% | – | 204,555 | 18.08% | -29.96% | 1,131,430 |
| Vermont | 95,369 | 30.27% | – | 178,573 | 56.68% | 3 | 10,078 | 3.20% | – | 6,758 | 2.14% | – | 640 | 0.20% | – | 63 | 0.02% | – | 23,586 | 7.49% | – | -83,204 | -26.41% | 9.19% | 315,067 |
| Virginia | 1,769,443 | 44.41% | – | 1,981,473 | 49.73% | 13 | 118,274 | 2.97% | – | 27,638 | 0.69% | – | 54,054 | 1.36% | – | – | – | – | 33,749 | 0.85% | – | -212,030 | -5.32% | -1.45% | 3,984,631 |
| Washington | 1,221,747 | 36.83% | – | 1,742,718 | 52.54% | 8 | 160,879 | 4.85% | – | 58,417 | 1.76% | – | – | – | – | 17,623 | 0.53% | – | 115,635 | 3.49% | 4 | -520,971 | -15.71% | -0.84% | 3,317,019 |
| West Virginia | 489,371 | 68.50% | 5 | 188,794 | 26.43% | – | 23,004 | 3.22% | – | 8,075 | 1.13% | – | 1,104 | 0.15% | – | 3,807 | 0.53% | – | 268 | 0.04% | – | 300,577 | 42.07% | 15.31% | 714,423 |
| Wisconsin | 1,405,284 | 47.22% | 10 | 1,382,536 | 46.45% | – | 106,674 | 3.58% | – | 31,072 | 1.04% | – | 11,855 | 0.40% | – | 12,162 | 0.41% | – | 26,567 | 0.89% | – | 22,748 | 0.76% | 7.70% | 2,976,150 |
| Wyoming | 174,419 | 68.17% | 3 | 55,973 | 21.88% | – | 13,287 | 5.19% | – | 2,515 | 0.98% | – | – | – | – | 2,042 | 0.80% | – | 7,613 | 2.98% | – | 118,446 | 46.29% | 5.47% | 255,849 |
| Total | 62,984,828 | 46.09% | 304 | 65,853,514 | 48.18% | 227 | 4,489,341 | 3.28% | – | 1,457,218 | 1.07% | – | 731,991 | 0.54% | – | 203,090 | 0.15% | – | 949,294 | 0.69% | 7 | -2,868,686 | -2.10% | 1.76% | 136,669,276 |
| Donald Trump Republican |
Hillary Clinton Democratic |
Gary Johnson Libertarian |
Jill Stein Green |
Evan McMullin Independent |
Darrell Castle Constitution |
Others | Margin | Margin swing | Total votes | ||||||||||||||||

Close states edit
States where the margin of victory was under 1% (50 electoral votes):
- Michigan, 0.22% (10,704 votes)
- New Hampshire, 0.37% (2,736 votes)
- Pennsylvania, 0.72% (44,292 votes)
- Wisconsin, 0.76% (22,748 votes)
States where the margin of victory was under 5% (85 electoral votes):
- Florida, 1.20% (112,911 votes)
- Minnesota, 1.52% (44,765 votes)
- Nebraska's 2nd congressional district, 2.24% (6,534 votes)
- Nevada, 2.42% (27,202 votes)
- Maine, 2.96% (22,142 votes)
- Arizona, 3.55% (91,234 votes)
- North Carolina, 3.65% (173,315 votes)
- Colorado, 4.90% (136,386 votes)
States where the margin of victory was under 10% (96 electoral votes):
- Georgia, 5.13% (211,141 votes)
- Virginia, 5.32% (212,030 votes)
- Ohio, 8.13% (446,841 votes)
- New Mexico, 8.21% (65,567 votes)
- Texas, 9.00% (807,179 votes)
- Iowa, 9.41% (147,314 votes)
County statistics edit
Results by state edit
Nebraska edit

- Trump: 40–50% 50–60% 60–70% 70–80% 80–90% 90-100%
- Clinton: 40–50%

- Trump: 40–50% 50–60% 70–80%
| Party | Candidate | Votes | % | ±% | |
|---|---|---|---|---|---|
| Republican | Donald Trump | 495,961 | 58.75% | ||
| Democratic | Hillary Clinton | 284,494 | 33.70% | ||
| Libertarian | Gary Johnson | 38,946 | 4.61% | ||
| Independent | Jill Stein | 8,775 | 1.04% | N/A | |
| Write-in | 16,051 | 1.90% | |||
| Margin of victory | 211,467 | 25.05% | |||
| Turnout | 844,227 | 72.54% | |||
| Registered electors | 1,163,871 | ||||
| Republican win | |||||
1st congressional district edit
| Party | Candidate | Votes | % | ±% | |
|---|---|---|---|---|---|
| Republican | Donald Trump | 158,642 | 56.18% | ||
| Democratic | Hillary Clinton | 100,132 | 35.46% | ||
| Libertarian | Gary Johnson | 14,033 | 4.97% | ||
| Independent | Jill Stein | 3,374 | 1.19% | N/A | |
| Write-in | 6,181 | 2.19% | |||
| Margin of victory | 58,510 | 20.72% | |||
| Turnout | 282,362 | ||||
| Registered electors | |||||
| Republican win | |||||
2nd congressional district edit
| Party | Candidate | Votes | % | ±% | |
|---|---|---|---|---|---|
| Republican | Donald Trump | 137,564 | 47.16% | ||
| Democratic | Hillary Clinton | 131,030 | 44.92% | ||
| Libertarian | Gary Johnson | 13,245 | 4.54% | ||
| Independent | Jill Stein | 3,347 | 1.15% | N/A | |
| Write-in | 6,494 | 2.23% | |||
| Margin of victory | 6,534 | 2.24% | |||
| Turnout | 291,680 | ||||
| Registered electors | |||||
| Republican win | |||||
3rd congressional district edit
| Party | Candidate | Votes | % | ±% | |
|---|---|---|---|---|---|
| Republican | Donald Trump | 199,755 | 73.91% | ||
| Democratic | Hillary Clinton | 53,332 | 19.73% | ||
| Libertarian | Gary Johnson | 11,668 | 4.32% | ||
| Independent | Jill Stein | 2,054 | 0.76% | N/A | |
| Write-in | 3,451 | 1.28% | |||
| Margin of victory | 146,423 | 54.18% | |||
| Turnout | 270,260 | ||||
| Registered electors | |||||
| Republican win | |||||
Nevada edit

- Clinton: 40–50% 50–60%
- Trump: 50–60% 60–70% 70–80% 80–90%
| Party | Candidate | Votes | % | ±% | |
|---|---|---|---|---|---|
| Democratic | Hillary Clinton | 539,260 | 47.92% | ||
| Republican | Donald Trump | 512,058 | 45.50% | ||
| Libertarian | Gary Johnson | 37,384 | 3.32% | ||
| None of These Candidates | 28,863 | 2.56% | |||
| Independent American Party (Nevada) | Darrell Castle | 5,268 | 0.47% | ||
| Independent | Rocky De La Fuente | 2,552 | 0.23% | N/A | |
| Margin of victory | 27,202 | 2.42% | |||
| Turnout | 1,125,385 | ||||
| Registered electors | |||||
| Democratic win | |||||
New Hampshire edit

- Clinton: 40–50% 50–60%
- Trump: 40–50% 50–60%
| Party | Candidate | Votes | % | ±% | |
|---|---|---|---|---|---|
| Democratic | Hillary Clinton | 348,526 | 46.83% | ||
| Republican | Donald Trump | 345,790 | 46.46% | ||
| Libertarian | Gary Johnson | 30,777 | 4.14% | ||
| Green | Jill Stein | 6,496 | 0.87% | N/A | |
| American Delta | Rocky De La Fuente | 678 | 0.09% | N/A | |
| Write-in | 12,029 | 1.62% | |||
| Margin of victory | 2,736 | 0.37% | |||
| Turnout | 744,296 | ||||
| Registered electors | |||||
| Democratic win | |||||
New Jersey edit

- Clinton: 50–60% 60–70% 70–80%
- Trump: 40–50% 50–60% 60–70%
| Party | Candidate | Votes | % | ±% | |
|---|---|---|---|---|---|
| Democratic | Hillary Clinton | 2,148,278 | 55.45% | ||
| Republican | Donald Trump | 1,601,933 | 41.35% | ||
| Libertarian | Gary Johnson | 72,477 | 1.87% | ||
| Green | Jill Stein | 37,772 | 0.98% | ||
| Constitution | Darrell Castle | 6,161 | 0.16% | ||
| Socialist Workers | Alyson Kennedy | 2,156 | 0.06% | ||
| American Delta | Rocky De La Fuente | 1,838 | 0.05% | N/A | |
| Workers World | Monica Moorehead | 1,749 | 0.05% | N/A | |
| Socialism and Liberation | Gloria La Riva | 1,682 | 0.04% | ||
| Margin of victory | 546,345 | 14.10% | |||
| Turnout | 3,874,076 | ||||
| Registered electors | |||||
| Democratic win | |||||
New Mexico edit

- Clinton: 40–50% 50–60% 60–70% 70–80%
- Trump: 40–50% 50–60% 60–70% 70–80%
| Party | Candidate | Votes | % | ±% | |
|---|---|---|---|---|---|
| Democratic | Hillary Clinton | 385,234 | 48.26% | ||
| Republican | Donald Trump | 319,667 | 40.04% | ||
| Libertarian | Gary Johnson | 74,541 | 9.34% | ||
| Green | Jill Stein | 9,879 | 1.24% | ||
| Independent | Evan McMullin | 5,825 | 0.73% | N/A | |
| Constitution | Darrell Castle | 1,514 | 0.19% | ||
| Socialism and Liberation | Gloria La Riva | 1,184 | 0.15% | N/A | |
| American Delta | Rocky De La Fuente | 475 | 0.06% | N/A | |
| Margin of victory | 65,567 | 8.21% | |||
| Turnout | 798,319 | 61.91% | |||
| Registered electors | 1,289,420 | ||||
| Democratic win | |||||
New York edit

- Clinton: 40–50% 50–60% 60–70% 70–80% 80–90%
- Trump: 40–50% 50–60% 60–70% 70–80%
| Party | Candidate | Votes | % | ±% | |
|---|---|---|---|---|---|
| Democratic | Hillary Clinton | 4,379,783 | 56.72% | ||
| Working Families | Hillary Clinton | 140,043 | 1.81% | ||
| Women's Equality | Hillary Clinton | 36,292 | 0.47% | N/A | |
| Total | Hillary Clinton | 4,556,118 | 59.01% | ||
| Republican | Donald Trump | 2,527,141 | 32.73% | ||
| Conservative | Donald Trump | 292,392 | 3.79% | ||
| Total | Donald Trump | 2,819,533 | 36.52% | ||
| Independence | Gary Johnson | 119,160 | 1.54% | N/A | |
| Libertarian | Gary Johnson | 57,438 | 0.74% | ||
| Total | Gary Johnson | 176,598 | 2.29% | ||
| Green | Jill Stein | 107,935 | 1.40% | ||
| Write-in | 61,258 | 0.79% | |||
| Margin of victory | 1,736,585 | 22.49% | |||
| Turnout | 7,721,442 | 61.80% | |||
| Registered electors | 12,493,250 | ||||
| Democratic win | |||||
North Carolina edit

- Trump: 40–50% 50–60% 60–70% 70–80%
- Clinton: 40–50% 50–60% 60–70% 70–80%
| Party | Candidate | Votes | % | ±% | |
|---|---|---|---|---|---|
| Republican | Donald Trump | 2,362,631 | 49.83% | ||
| Democratic | Hillary Clinton | 2,189,316 | 46.17% | ||
| Libertarian | Gary Johnson | 130,216 | 2.74% | ||
| Write-in | 59,491 | 1.25% | |||
| Margin of victory | 173,315 | 3.65% | |||
| Turnout | 4,741,564 | 68.75% | |||
| Registered electors | 6,896,349 | ||||
| Republican win | |||||
North Dakota edit

- Trump: 40–50% 50–60% 60–70% 70–80% 80–90%
- Clinton: 50–60% 60–70%
| Party | Candidate | Votes | % | ±% | |
|---|---|---|---|---|---|
| Republican | Donald Trump | 216,794 | 62.96% | ||
| Democratic–NPL | Hillary Clinton | 93,758 | 27.23% | ||
| Libertarian | Gary Johnson | 21,434 | 6.22% | ||
| Green | Jill Stein | 3,780 | 1.10% | ||
| Constitution | Darrell Castle | 1,833 | 0.53% | ||
| American Delta | Rocky De La Fuente | 364 | 0.11% | N/A | |
| Write-in | 6,397 | 1.86% | |||
| Margin of victory | 123,036 | 35.73% | |||
| Turnout | 344,360 | 60.31% | |||
| Registered electors | 570,955 | ||||
| Republican win | |||||
Ohio edit

- Trump: 40–50% 50–60% 60–70% 70–80% 80–90%
- Clinton: 40–50% 50–60% 60–70%
| Party | Candidate | Votes | % | ±% | |
|---|---|---|---|---|---|
| Republican | Donald Trump | 2,841,005 | 51.69% | ||
| Democratic | Hillary Clinton | 2,394,164 | 43.56% | ||
| Independent | Gary Johnson | 174,498 | 3.17% | ||
| Green | Jill Stein | 46,271 | 0.84% | ||
| Independent | Richard Duncan | 24,235 | 0.44% | ||
| Write-in | 16,314 | 0.30% | |||
| Margin of victory | 446,841 | 8.13% | |||
| Turnout | 5,496,487 | 69.92% | |||
| Registered electors | 7,861,025 | ||||
| Republican win | |||||
Oklahoma edit

- Trump: 50–60% 60–70% 70–80% 80–90%
| Party | Candidate | Votes | % | ±% | |
|---|---|---|---|---|---|
| Republican | Donald Trump | 949,136 | 65.32% | ||
| Democratic | Hillary Clinton | 420,375 | 28.93% | ||
| Libertarian | Gary Johnson | 83,481 | 5.75% | N/A | |
| Margin of victory | 528,761 | 36.39% | |||
| Turnout | 1,452,992 | 67.35% | |||
| Registered electors | 2,157,450 | ||||
| Republican win | |||||
Oregon edit

- Clinton: 40–50% 50–60% 70–80%
- Trump: 40–50% 50–60% 60–70% 70–80%
| Party | Candidate | Votes | % | ±% | |
|---|---|---|---|---|---|
| Democratic | Hillary Clinton | 1,002,106 | 50.07% | ||
| Republican | Donald Trump | 782,403 | 39.09% | ||
| Libertarian | Gary Johnson | 94,231 | 4.71% | ||
| Pacific Green | Jill Stein | 50,002 | 2.50% | ||
| Write-in | 72,594 | 3.63% | |||
| Margin of victory | 219,703 | 10.98% | |||
| Turnout | 2,001,336 | ||||
| Registered electors | |||||
| Democratic win | |||||
Pennsylvania edit

- Trump: 40–50% 50–60% 60–70% 70–80% 80–90%
- Clinton: 40–50% 50–60% 80–90%
| Party | Candidate | Votes | % | ±% | |
|---|---|---|---|---|---|
| Republican | Donald Trump | 2,970,733 | 48.18% | ||
| Democratic | Hillary Clinton | 2,926,441 | 47.46% | ||
| Libertarian | Gary Johnson | 146,715 | 2.38% | ||
| Green | Jill Stein | 49,941 | 0.81% | ||
| Constitution | Darrell Castle | 21,572 | 0.35% | N/A | |
| Write-in | 50,076 | 0.81% | |||
| Margin of victory | 44,292 | 0.72% | |||
| Turnout | 6,165,478 | 70.68% | |||
| Registered electors | 8,722,977 | ||||
| Republican win | |||||
| Candidate | Votes | % | |
|---|---|---|---|
| Scattering | 37,239 | 0.60% | |
| Evan McMullin | 6,472 | 0.10% | |
| Bernie Sanders | 6,060 | 0.10% | |
| John Kasich | 302 | 0.00% | |
| Lynn Kahn | 3 | 0.00% | |
| Total votes | 50,076 | 0.81% | |
Rhode Island edit

- Clinton: 50–60%
- Trump: 40–50%
| Party | Candidate | Votes | % | ±% | |
|---|---|---|---|---|---|
| Democratic | Hillary Clinton | 252,525 | 54.41% | ||
| Republican | Donald Trump | 180,543 | 38.90% | ||
| Libertarian | Gary Johnson | 14,746 | 3.18% | ||
| Green | Jill Stein | 6,220 | 1.34% | ||
| American Delta | Rocky De La Fuente | 671 | 0.14% | N/A | |
| Write-in | 9,439 | 2.03% | |||
| Margin of victory | 71,982 | 15.51% | |||
| Turnout | 464,144 | 59.30% | |||
| Registered electors | 782,693 | ||||
| Democratic win | |||||
South Carolina edit

- Trump: 50–60% 60–70% 70–80%
- Clinton: 40–50% 50–60% 60–70% 70–80%
| Party | Candidate | Votes | % | ±% | |
|---|---|---|---|---|---|
| Republican | Donald Trump | 1,155,389 | 54.94% | ||
| Democratic | Hillary Clinton | 855,373 | 40.67% | ||
| Libertarian | Gary Johnson | 49,204 | 2.34% | ||
| Independence | Evan McMullin | 21,016 | 1.00% | N/A | |
| Green | Jill Stein | 13,034 | 0.62% | ||
| Constitution | Darrell Castle | 5,765 | 0.27% | ||
| American | Peter Skewes | 3,246 | 0.15% | N/A | |
| Margin of victory | 300,016 | 14.27% | |||
| Turnout | 2,103,027 | 67.20% | |||
| Registered electors | 3,129,467 | ||||
| Republican win | |||||
South Dakota edit

- Trump: 40–50% 50–60% 60–70% 70–80% 80–90% 90–100%
- Clinton: 50–60% 60–70% 70–80% 80–90%
| Party | Candidate | Votes | % | ±% | |
|---|---|---|---|---|---|
| Republican | Donald Trump | 227,721 | 61.53% | ||
| Democratic | Hillary Clinton | 117,458 | 31.74% | ||
| Libertarian | Gary Johnson | 20,850 | 5.63% | ||
| Constitution | Darrell Castle | 4,064 | 1.10% | ||
| Margin of victory | 110,263 | 29.79% | |||
| Turnout | 370,093 | 62.19% | |||
| Registered electors | 595,126 | ||||
| Republican win | |||||
Tennessee edit

- Trump: 50–60% 60–70% 70–80% 80–90%
- Clinton: 50–60% 60–70%
| Party | Candidate | Votes | % | ±% | |
|---|---|---|---|---|---|
| Republican | Donald Trump | 1,522,925 | 60.72% | ||
| Democratic | Hillary Clinton | 870,695 | 34.72% | ||
| Independent | Gary Johnson | 70,397 | 2.81% | ||
| Independent | Jill Stein | 15,993 | 0.64% | ||
| Independent | Mike Smith | 7,276 | 0.29% | N/A | |
| Independent | Rocky De La Fuente | 4,075 | 0.16% | ||
| Independent | Alyson Kennedy | 2,877 | 0.11% | N/A | |
| Write-in | 13,789 | 0.55% | |||
| Margin of victory | 652,230 | 26.01% | |||
| Turnout | 2,508,027 | 61.02% | |||
| Registered electors | 4,110,318 | ||||
| Republican win | |||||
| Candidate | Votes | % | |
|---|---|---|---|
| Evan McMullin | 11,991 | 0.48% | |
| Darrell Castle | 1,584 | 0.06% | |
| Tom Hoefling | 132 | 0.01% | |
| David Limbaugh | 53 | 0.00% | |
| Laurence Kotlikoff | 20 | 0.00% | |
| Cherunda Fox | 6 | 0.00% | |
| Marshall Schoenke | 3 | 0.00% | |
| Total votes | 13,789 | 0.55% | |
Texas edit

- Trump: 40–50% 50–60% 60–70% 70–80% 80–90% 90–100%
- Clinton: 40–50% 50–60% 60–70% 70–80%
| Party | Candidate | Votes | % | ±% | |
|---|---|---|---|---|---|
| Republican | Donald Trump | 4,685,047 | 52.23% | ||
| Democratic | Hillary Clinton | 3,877,868 | 43.24% | ||
| Libertarian | Gary Johnson | 283,492 | 3.16% | ||
| Green | Jill Stein | 71,558 | 0.80% | ||
| Write-in | 51,261 | 0.57% | |||
| Margin of victory | 807,179 | 9.00% | |||
| Turnout | 8,969,226 | 65.73% | |||
| Registered electors | 13,646,226 | ||||
| Republican win | |||||
| Candidate | Votes | % | |
|---|---|---|---|
| Evan McMullin | 42,366 | 0.47% | |
| Darrell Castle | 4,261 | 0.05% | |
| Mike Maturen | 1,401 | 0.02% | |
| Laurence Kotlikoff | 1,037 | 0.01% | |
| Tom Hoefling | 932 | 0.01% | |
| Tony Valdivia | 428 | 0.00% | |
| Scott Cubbler | 314 | 0.00% | |
| Robert Morrow | 145 | 0.00% | |
| Monica Moorehead | 122 | 0.00% | |
| Mimi Soltysik | 72 | 0.00% | |
| Dale Steffes | 71 | 0.00% | |
| Jonathan Lee | 67 | 0.00% | |
| Cherunda Fox | 45 | 0.00% | |
| Total votes | 51,261 | 0.57% | |
Utah edit

- Trump: 40–50% 50–60% 60–70% 70–80% 80–90%
- Clinton: 40–50% 50–60%
| Party | Candidate | Votes | % | ±% | |
|---|---|---|---|---|---|
| Republican | Donald Trump | 515,231 | 45.54% | ||
| Democratic | Hillary Clinton | 310,676 | 27.46% | ||
| Independent | Evan McMullin | 243,690 | 21.54% | N/A | |
| Libertarian | Gary Johnson | 39,608 | 3.50% | ||
| Independent | Jill Stein | 9,438 | 0.83% | ||
| Constitution | Darrell Castle | 8,032 | 0.71% | ||
| Independent American | Rocky Giordani | 2,752 | 0.24% | N/A | |
| Independent | Rocky De La Fuente | 883 | 0.08% | N/A | |
| Independent | Monica Moorehead | 544 | 0.05% | N/A | |
| Independent | Alyson Kennedy | 521 | 0.05% | N/A | |
| Write-in | 55 | 0.00% | |||
| Margin of victory | 204,555 | 18.08% | |||
| Turnout | 1,131,430 | ||||
| Registered electors | |||||
| Republican win | |||||
| Candidate | Votes | % | |
|---|---|---|---|
| Mike Smith | 19 | 0.00% | |
| Dustin Baird | 9 | 0.00% | |
| Laurence Kotlikoff | 9 | 0.00% | |
| Tom Hoefling | 6 | 0.00% | |
| Andrew D. Basiago | 4 | 0.00% | |
| Mimi Soltysik | 4 | 0.00% | |
| Robert L. Buchanan | 1 | 0.00% | |
| Jamin Burton | 1 | 0.00% | |
| Sheila Tittle | 1 | 0.00% | |
| Tony Valdivia | 1 | 0.00% | |
| Total votes | 55 | 0.00% | |
Vermont edit

- Clinton: 40–50% 50–60% 60–70%
- Trump: 50–60%
| Party | Candidate | Votes | % | ±% | |
|---|---|---|---|---|---|
| Democratic | Hillary Clinton | 178,573 | 56.68% | ||
| Republican | Donald Trump | 95,369 | 30.27% | ||
| Libertarian | Gary Johnson | 10,078 | 3.20% | ||
| Green | Jill Stein | 6,758 | 2.14% | N/A | |
| Independent | Rocky De La Fuente | 1,063 | 0.34% | N/A | |
| Liberty Union | Gloria La Riva | 327 | 0.10% | ||
| Write-in | 22,899 | 7.27% | |||
| Margin of victory | 83,204 | 26.41% | |||
| Turnout | 315,067 | ||||
| Registered electors | |||||
| Democratic win | |||||
| Candidate | Votes | % | |
|---|---|---|---|
| Bernie Sanders | 18,218 | 5.78% | |
| Scattered | 1,478 | 0.47% | |
| John Kasich | 827 | 0.26% | |
| Evan McMullin | 640 | 0.20% | |
| Mike Pence | 298 | 0.09% | |
| No Name | 255 | 0.08% | |
| Paul Ryan | 208 | 0.07% | |
| Mitt Romney | 120 | 0.04% | |
| Marco Rubio | 93 | 0.03% | |
| Jeb Bush | 79 | 0.03% | |
| John McCain | 76 | 0.02% | |
| Jim Douglas | 75 | 0.02% | |
| Darrell Castle | 63 | 0.02% | |
| Ted Cruz | 63 | 0.02% | |
| Ben Carson | 61 | 0.02% | |
| Joe Biden | 57 | 0.02% | |
| Rand Paul | 26 | 0.01% | |
| Ron Paul | 25 | 0.01% | |
| Colin Powell | 25 | 0.01% | |
| Michael Bloomberg | 22 | 0.01% | |
| Condoleeza Rice | 18 | 0.01% | |
| Tulsi Gabbard | 17 | 0.01% | |
| Michelle Obama | 15 | 0.00% | |
| Mike Maturen | 14 | 0.00% | |
| Elizabeth Warren | 13 | 0.00% | |
| Theo Epstein | 11 | 0.00% | |
| Carly Fiorina | 11 | 0.00% | |
| Mike Huckabee | 11 | 0.00% | |
| Vermin Supreme | 10 | 0.00% | |
| Tom Brady | 9 | 0.00% | |
| Barack Obama | 8 | 0.00% | |
| David Ortiz | 8 | 0.00% | |
| Bill Belichick | 7 | 0.00% | |
| Patrick Leahy | 7 | 0.00% | |
| Ralph Nader | 7 | 0.00% | |
| Fred Tuttle | 6 | 0.00% | |
| Bill Weld | 5 | 0.00% | |
| Chris Keniston | 3 | 0.00% | |
| Lawrence Kotlikoff | 3 | 0.00% | |
| Alyson Kennedy | 2 | 0.00% | |
| Mimi Soltysik | 2 | 0.00% | |
| Jerry White | 2 | 0.00% | |
| Mike Smith | 1 | 0.00% | |
| Total votes | 22,899 | 7.27% | |
Virginia edit

- Clinton: 40–50% 50–60% 60–70% 70–80% 80–90%
- Trump: 40–50% 50–60% 60–70% 70–80% 80–90%
| Party | Candidate | Votes | % | ±% | |
|---|---|---|---|---|---|
| Democratic | Hillary Clinton | 1,981,473 | 49.73% | ||
| Republican | Donald Trump | 1,769,443 | 44.41% | ||
| Libertarian | Gary Johnson | 118,274 | 2.97% | ||
| Independent | Evan McMullin | 54,054 | 1.36% | N/A | |
| Green | Jill Stein | 27,638 | 0.69% | ||
| Write-in | 33,749 | 0.85% | |||
| Margin of victory | 212,030 | 5.32% | |||
| Turnout | 3,984,631 | 72.05% | |||
| Registered electors | 5,529,742 | ||||
| Democratic win | |||||
Washington edit

- Clinton: 40–50% 50–60% 60–70%
- Trump: 40–50% 50–60% 60–70% 70–80%
| Party | Candidate | Votes | % | ±% | |
|---|---|---|---|---|---|
| Democratic | Hillary Clinton | 1,742,718 | 52.54% | ||
| Republican | Donald Trump | 1,221,747 | 36.83% | ||
| Libertarian | Gary Johnson | 160,879 | 4.85% | ||
| Green | Jill Stein | 58,417 | 1.76% | ||
| Constitution | Darrell Castle | 17,623 | 0.53% | ||
| Socialist Workers | Alyson Kennedy | 4,307 | 0.13% | ||
| Socialism and Liberation | Gloria La Riva | 3,523 | 0.11% | ||
| Write-in | 107,805 | 3.25% | |||
| Margin of victory | 520,971 | 15.71% | |||
| Turnout | 3,317,019 | 68.08% | N/A | ||
| Registered electors | 4,872,385 | ||||
| Democratic win | |||||
West Virginia edit

- Trump: 50–60% 60–70% 70–80% 80–90%
| Party | Candidate | Votes | % | ±% | |
|---|---|---|---|---|---|
| Republican | Donald Trump | 489,371 | 68.50% | ||
| Democratic | Hillary Clinton | 188,794 | 26.43% | ||
| Libertarian | Gary Johnson | 23,004 | 3.22% | ||
| Mountain | Jill Stein | 8,075 | 1.13% | ||
| Constitution | Darrell Castle | 3,807 | 0.53% | N/A | |
| Write-in | 1,372 | 0.19% | |||
| Margin of victory | 300,577 | 42.07% | |||
| Turnout | 714,423 | 56.04% | N/A | ||
| Registered electors | 1,274,887 | ||||
| Republican win | |||||
| Candidate | Votes | % | |
|---|---|---|---|
| Evan McMullin | 1,104 | 0.15% | |
| Kevin Moreau | 216 | 0.03% | |
| William Roger Smith | 13 | 0.00% | |
| Tom Hoefling | 10 | 0.00% | |
| Andrew D. Basiago | 4 | 0.00% | |
| Laurence Kotlikoff | 4 | 0.00% | |
| Robert L. Buchanan | 3 | 0.00% | |
| Rocky De La Fuente | 3 | 0.00% | |
| David Limbaugh | 3 | 0.00% | |
| Gloria La Riva | 2 | 0.00% | |
| Darryl W. Perry | 2 | 0.00% | |
| Mike Smith | 2 | 0.00% | |
| Jerry White | 2 | 0.00% | |
| Richard Duncan | 1 | 0.00% | |
| Ben Hartnell | 1 | 0.00% | |
| Joseph Maldonado | 1 | 0.00% | |
| Mitchell Williams | 1 | 0.00% | |
| Total votes | 1,372 | 0.19% | |
Wisconsin edit

- Trump: 40–50% 50–60% 60–70% 70–80%
- Clinton: 40–50% 50–60% 60–70% 70–80%
| Party | Candidate | Votes | % | ±% | |
|---|---|---|---|---|---|
| Republican | Donald Trump | 1,405,284 | 47.22% | ||
| Democratic | Hillary Clinton | 1,382,536 | 46.45% | ||
| Libertarian | Gary Johnson | 106,674 | 3.58% | ||
| Green | Jill Stein | 31,072 | 1.04% | ||
| Constitution | Darrell Castle | 12,162 | 0.41% | ||
| Workers World | Monica Moorehead | 1,770 | 0.06% | N/A | |
| American Delta | Rocky De La Fuente | 1,502 | 0.05% | N/A | |
| Write-in | 35,150 | 1.18% | |||
| Margin of victory | 22,748 | 0.76% | |||
| Turnout | 2,976,150 | 83.63% | |||
| Registered electors | 3,558,877 | ||||
| Republican win | |||||
| Candidate | Votes | % | |
|---|---|---|---|
| Scattered | 22,764 | 0.76% | |
| Evan McMullin | 11,855 | 0.40% | |
| Mike Maturen | 284 | 0.01% | |
| Tom Hoefling | 80 | 0.00% | |
| Chris Keniston | 67 | 0.00% | |
| Cherunda Fox | 47 | 0.00% | |
| Mimi Soltysik | 33 | 0.00% | |
| Laurence Kotlikoff | 15 | 0.00% | |
| Joseph Maldonado | 4 | 0.00% | |
| Marshall Schoenke | 1 | 0.00% | |
| Total votes | 35,150 | 1.18% | |
Wyoming edit

- Trump: 40–50% 60–70% 70–80% 80–90%
- Clinton: 50–60%
| Party | Candidate | Votes | % | ±% | |
|---|---|---|---|---|---|
| Republican | Donald Trump | 174,419 | 68.17% | ||
| Democratic | Hillary Clinton | 55,973 | 21.88% | ||
| Libertarian | Gary Johnson | 13,287 | 5.19% | ||
| Independent | Jill Stein | 2,515 | 0.98% | N/A | |
| Constitution | Darrell Castle | 2,042 | 0.80% | ||
| Independent | Rocky De La Fuente | 709 | 0.28% | N/A | |
| Write-in | 6,904 | 2.70% | |||
| Margin of victory | 118,446 | 46.29% | |||
| Turnout | 255,849 | 57.21% | |||
| Registered electors | 447,212 | ||||
| Republican win | |||||
See also edit
References edit
- ^ "Voter Registration Statistics". North Carolina State Board of Elections.
- ^ Summary of North Dakota Election Statistics 1980-Present
- ^ "Turnout and Voter Registration Figures (1970-current)". Texas Secretary of State.
- ^ "Registration/Turnout Reports". Virginia Department of Elections.
- ^ "2016 General Election Turnout". www.sos.wv.gov. Archived from the original on July 13, 2017. Retrieved June 28, 2019.
- ^ "Voter Registration Statistics". Wisconsin Elections Commission.
- ^ Wyoming Voter Registration and Voter Turnout Statistics