If you're interested in both statistics and Wikipedia:Requests for adminship, you might well have seen such works as User:Majorly/RfA/Stats, User:WereSpielChequers/RFA by month and the plethora of pages under User:NoSeptember/The NoSeptember Admin Project. If you haven't, read them – they're quite interesting. All three projects presented historical and/or chronological data on areas such as the number of admins passing RfA each month, the number of active admins, resysopping of former admins and others. However, there is one area which has yet to be examined in detail: total participation at RfA. This is addressed below.
Data edit
Data comes from Wikipedia:Successful requests for adminship and Wikipedia:Unsuccessful adminship candidacies (Chronological). RfAs which were withdrawn or closed early are ignored as unrepresentative since they didn't run for the whole time period; only those listed on the latter as "consensus not reached", "no consensus", "failed" or "unsuccessful" are included in the unsuccessful column. A separate column tallies the number of RfAs closed early in each year following a (very good) suggestion by another user. Since unsuccessful RfAs were not recorded until 2004, the study begins there.
Data is presented in a year-by-year format. I worked out most of it manually; since this involved looking through every completed RfA since records began, it's quite likely I got something wrong somewhere, although I did double check everything where possible. In addition, the original source pages were also created manually, and may also contain some mistakes. I fixed a few that I spotted, so hopefully this shouldn't be too big an issue.
Table 1: Changes in RfA numbers by year edit
| Year | Number of successful RfAs | Number of completed unsuccessful RfAs | % success rate of completed RfAs | Number of RfAs closed early | % of RfAs completed |
|---|---|---|---|---|---|
| 2004 | 240 | 41 | 85.4 | 22 | 92.7 |
| 2005 | 387 | 116 | 76.0 | 87 | 85.3 |
| 2006 | 353 | 154 | 69.6 | 388 | 56.7 |
| 2007 | 408 | 135 | 75.1 | 377 | 59.0 |
| 2008 | 201 | 67 | 75.0 | 325 | 45.2 |
| 2009 | 121 | 50 | 70.8 | 184 | 48.2 |
| 2010 | 75 | 18 | 80.6 | 137 | 40.4 |
Table 2: Voting rates edit
| Year | Mean number of !votes (successful) | Standard deviation (successful) | Mean number of !votes (unsuccessful) | Standard deviation (unsuccessful) | Total number of !votes on completed RfAs (to nearest 10) |
|---|---|---|---|---|---|
| 2004 | 21.9 | 12.1 | 25.8 | 15.4 | 6310 |
| 2005 | 40.6 | 21.3 | 29.3 | 20.9 | 19110 |
| 2006 | 78.0 | 33.4 | 69.7 | 35.5 | 38270 |
| 2007 | 66.8 | 34.0 | 70.7 | 41.2 | 36800 |
| 2008 | 85.5 | 34.4 | 88.8 | 48.3 | 23140 |
| 2009 | 99.1 | 34.6 | 99.7 | 41.9 | 18670 |
| 2010 | 115.8 | 32.9 | 109.5 | 47.1 | 10660 |
Table 3: Changes in RfA !votes edit
| Year span | Actual change in mean (successful) | % change in mean (successful) | Actual change in mean (unsuccessful) | % change in mean (unsuccessful) | Actual change in total !votes | % change in total !votes |
|---|---|---|---|---|---|---|
| 2004–05 | +18.7 | +85.4% | +3.5 | +13.6% | +12800 | +203% |
| 2005–06 | +37.4 | +92.1% | +40.4 | +137.9% | +19160 | +100% |
| 2006–07 | −11.2 | −14.4% | +1.0 | +1.4% | −1470 | −4% |
| 2007–08 | +18.7 | +28.0% | +18.1 | +25.6% | −13660 | −37% |
| 2008–09 | +13.6 | +15.9% | +10.9 | +12.2% | −4470 | −19% |
| 2009–2010 | +26.7 | +16.9% | +9.8 | +9.8% | −8010 | −43% |
Summary edit
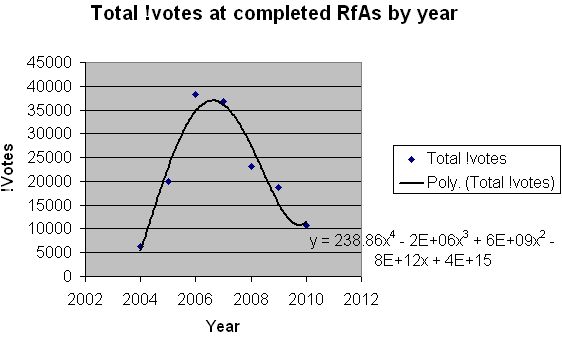
- The total number of !votes cast in all RfAs has been decreasing since reaching a peak in 2006. The large percentage decreases show that participation in RfA as a whole is falling at a quicker rate than other areas of the encyclopedia.
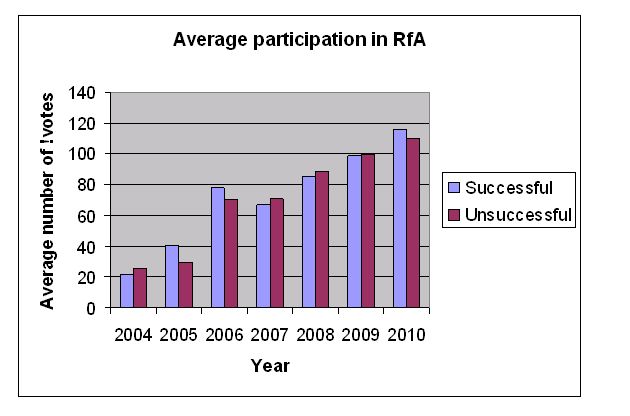
- The mean number of !votes on successful and unsuccessful RfAs for each year are higher than the previous year in all but one case. The percentage increases in recent years show that participation in individual RfAs is increasing at a quicker rate than other areas of the encyclopedia. This apparent contradiction is explained by the falling number of completed RfAs.
- The standard deviation for each year increased dramatically until 2006, then began to level out. This suggests that RfA participation is becoming no more spaced out: any single RfA in 2010 is likely to be no further away from the mean than in the three previous years.
Graphs edit
- Bar chart of average successful and unsuccessful !votes against time:
- Graph of changes in the total number of !votes at all RfAs in a year, including a polynomial approximation of the changes:
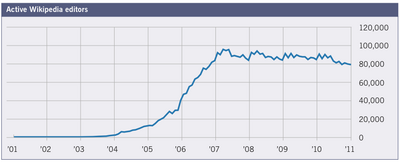
- Number of active users against time (for comparison):
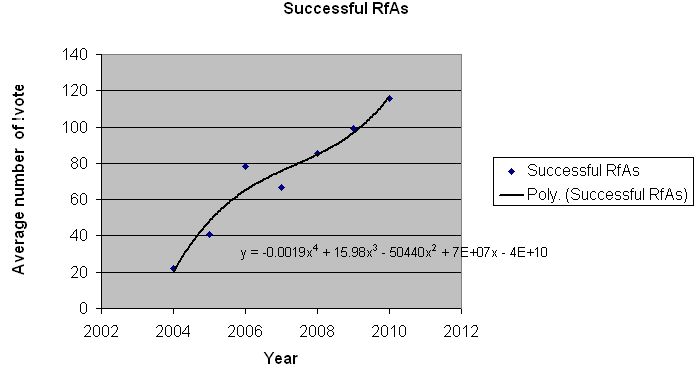
- Graph of changes in average !votes at successful RfAs with time, including a polynomial approximation of the changes:
- Graph of changes in average !votes at unsuccessful RfAs with time, including a polynomial approximation of the changes:
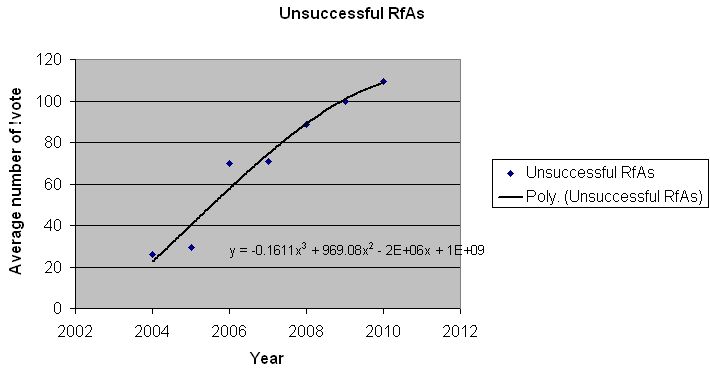


Graphs were generated by me using Microsoft Excel 2003, except for the number of active users chart which was borrowed from an earlier WMF study. The polynomial approximations were calculated using an Excel tool which allows the use of any function up to and including order 6. For total !votes and average !votes in successful RfAs, a function of order 4 appeared most accurate; for average !votes unsuccessful RfAs, a function of order 3 was closer to the true values. This difference is discussed below.
Association between participation and success edit
This section contains a Chi-squared test for association between number of !votes and success for completed RfAs in the year 2010. If there is no association between the two, the number of RfAs in each of the four categories in the two-way tables below will follow the chi-squared distribution. The test will use the 5% significance level.
| Observed values | Number of !votes >= 100 | Number of !votes < 100 | Row totals |
|---|---|---|---|
| Successful | 49 | 26 | 75 |
| Completed unsuccessful | 9 | 9 | 18 |
| Column totals | 58 | 35 | 93 |
| Expected values | Number of !votes >= 100 | Number of !votes < 100 | Row totals |
|---|---|---|---|
| Successful | 46.7742 | 28.2258 | 75 |
| Completed unsuccessful | 11.2258 | 6.7742 | 18 |
| Column totals | 58 | 35 | 93 |
Expected values are all larger than 5 so the Chi-square distribution is a good approximation to the distribution of the data.
X2 = 0.1011 + 0.1755 + 0.4413 + 0.7313 = 1.4492
A 2x2 table has 1 degree of freedom, so the critical value at the 5% level can be read from a table of values (example here) to be 3.841. Since the value of X2 is lower than this value, there is no significant evidence for association between the two variables, despite the variance between the two tables.
Extrapolation edit
- As an RfA can only pass if the support rate is above 70%, an average successful RfA in 2010 would have had to generate a minimum of 82 support !votes. In 2009, this value was 70; in 2004 it was 16. An average failed RfA in 2010 would have generated a minimum of 34 oppose !votes; this value was 31 in 2009, and 8 in 2004.
- The trend lines, calculated using polynomial approximations of the discrete data available, suggest that participation in individual RfAs will continue to increase for the foreseeable future, and that the number of !votes on successful RfAs will increase faster than those on unsuccessful ones. If present trends continue, the number of !votes at successful RfAs will continue to rise indefinitely, while those at unsuccessful RfAs will begin to level off and ultimately reach an asymptotic value. It is not known for how long this model will remain valid.
- Participation in RfA as a whole is a very volatile feature. Between 2004 and 2006, the percentage increases were very large (over 200% increase in one year, followed by 100% increase the following year). Since 2006, numbers have been falling; the rate of decrease is not uniform, either in real terms or as percentages. This suggests that it will be difficult to predict its future behaviour. The polynomial approximation for total !votes suggests that this number has reached its lowest point and will now begin to rise again; an approximation of order 5, which matched the known data slightly better than the order 4 approximation, was rejected as this predicts negative values from 2012 onwards, which is impossible.
Disagree? Tell me!