Talk:List of graphical methods
| This article is rated List-class on Wikipedia's content assessment scale. It is of interest to the following WikiProjects: | |||||||||||||||||||||||||||||||||||||
| |||||||||||||||||||||||||||||||||||||


Duplicates edit
Some of the ones listed in "Simple displays" are duplicated under "Statistics". Should the duplicates be removed? Btyner (talk) 02:45, 23 March 2008 (UTC)
No (similarly for duplicates in Business Methods) - either it should be a non-categorised simple list, or duplicates allowed (assuming they point to the same place) in each application category. (Martinb9999 (talk) 14:40, 21 January 2010 (UTC))
Samples edit
Should this page include the simple sample diagram that most (all?) linked pages include? Martinb9999 (talk) 14:45, 21 January 2010 (UTC)
yes, of course it should!
proposal: a graphical index.
this is just the first section, but i propose doing up the whole article like this:
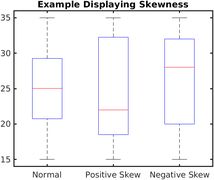
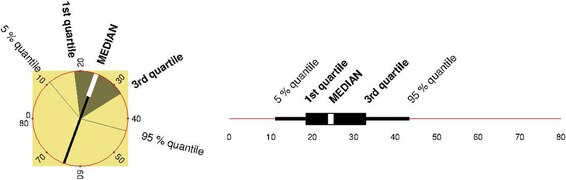
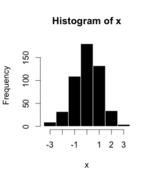
Simple displays edit

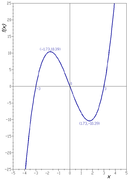


_%3D_x%5E3_%E2%88%92_9x.PNG)


dunno what to do with "plotting" but i was avoiding rearranging anything or making decisions on what to keep or toss. also, it turns out that there are numerous subtypes of each chart type. i picked the simplest and most representative example image from each article, although some of these deserve multiple images even if they all link to the same article.
do you hate it? love it? i'm not going to do all the work without knowing whether some self-appointed admin is just going to insta-revert it because "consensus" or "style" 157.131.95.172 (talk) 04:37, 6 July 2021 (UTC)
Usage summary edit
Should there be a one line summary of the usage of each diagram? Where usages are linked (eg Control Chart points to the existence of error, which Ishakawa Diagram analyses and Pareto Chart prioritises correction of), should this be highlighted? Martinb9999 (talk) 14:45, 21 January 2010 (UTC)