Talk:Climate change/Archive 73
| This is an archive of past discussions. Do not edit the contents of this page. If you wish to start a new discussion or revive an old one, please do so on the current talk page. |
| Archive 70 | Archive 71 | Archive 72 | Archive 73 | Archive 74 | Archive 75 | → | Archive 80 |
Lead section: policy responses
I've been thinking of revising the paragraph of the lead that deals with policy responses to global warming. Here's my suggested revision:
- Policy responses to global warming include mitigation by emissions reduction, adaptation to its effects, building systems resilient to its effects, and possible climate engineering. Most countries are parties to the United Nations Framework Convention on Climate Change (UNFCCC), whose ultimate objective is to prevent dangerous anthropogenic climate change. Parties to the UNFCCC have agreed that deep cuts in emissions are required and that global warming should be limited to well below 2 °C relative to pre-industrial levels, with efforts made to limit the temperature increase to 1.5 °C.
References: As cited in current revision and Paris agreement, Article 2, paragraph 1(a), p.3.
Enescot (talk) 18:39, 6 August 2016 (UTC)
- I've a bit of a problem with that because it is a primary source, and because it is written by politicians it needs some interpretation to say what should be taken from it. Dmcq (talk) 19:02, 6 August 2016 (UTC)
- It has the advantage of conciseness relative to the current version. The WP:PRIMARY concern could easily be addressed by citing a secondary source; COP21 had plenty of coverage. Shock Brigade Harvester Boris (talk) 20:55, 6 August 2016 (UTC)
- I'm ok with this in general. Here are three comments
- First, is part of the proposed first sentence redundant? Here is a breakdown of that text-
- Policy responses to global warming include
- (A) mitigation by emissions reduction,
- (B) adaptation to its effects,
- (C) building systems resilient to its effects, and
- (D) possible climate engineering.
- Policy responses to global warming include
- As I understand the lingo, part C is redundant with part B and could be trimmed out.
- Second, could we change "responses" to "Possible policy responses..." In our various sub articles we are describing these concepts in general, and we end up with articles about what they could do, as well as what they have actually done.
- Third, when I was a newbie I was put off by "mitgation", and there's way too much 50 cent words when 25 cents would do. Could we write it ::Possible policy responses to global warming include [[Climate change mitigation|prevention]], [[Adaptation to global warming|adaptation]], and [[climate engineering]].
- NewsAndEventsGuy (talk) 17:38, 7 August 2016 (UTC)
- Yes, add "possible". Climate engineering is a possible policy response but can't really be considered as current policy response. TimOsborn (talk) 20:59, 7 August 2016 (UTC)
- PS In addition to my earlier remark, Dmcq objected due to WP:PRIMARY. I don't wsee the problem here. The proposed text would say what the UNFCC's position is regarding dangerous climate change. Primary sources are fine when we report what the source says/thinks, etc., which is all we would be doing here.NewsAndEventsGuy (talk) 02:36, 8 August 2016 (UTC)
- I thought I had explained myself but seemingly even that short statement was not properly understood. The document was quite a bit longer and was written by politicians and this is supposed to summarize a part of it. Interpreting, getting the important parts and summarizing requires a secondary source. I have no objection to primary source in the body of the article to back things up but I really would prefer to see secondary sources used in the lead for the overview. Otherwise it is verging into original research grabbing bits of primary sources one thinks are important. Dmcq (talk) 08:28, 8 August 2016 (UTC)
- In this proposed POLICY paragraph we are trying to present a top-level summary of POLICY position of the planet's most encompassing group of POLICY MAKERS, i.e. the UNFCCC. Are you saying their own words are not RS for their own views?NewsAndEventsGuy (talk) 12:09, 8 August 2016 (UTC)
- Also, do we really have to have a cite here? (see WP:LEADCITE) NewsAndEventsGuy (talk) 12:09, 8 August 2016 (UTC)
- It is okay to have a bit of the lead summarize a section of the article. I'm not certain if that is what you mean though. As to the POLICY in capital letters etc business, what they wrote is a reliable source but it is not a secondary source and I believe for the summary or an overview we really do need a secondary source to give context and assess weight and interpret what they mean in accordance with WP:OR. Surely we have some secondary source for this?, or do you have some problem with us trying to follow Wikipedia's policies and guidelines? Dmcq (talk) 12:39, 8 August 2016 (UTC)
- You're ignoring the substance of my comment. I have stated an opinion that the proposed cite does in fact comply with "Wikipedia's policies and guidelines". If you can connect the dots in a rebuttal or if you have a different cite to propose, I am listening. NewsAndEventsGuy (talk) 15:55, 8 August 2016 (UTC)
- It is okay to have a bit of the lead summarize a section of the article. I'm not certain if that is what you mean though. As to the POLICY in capital letters etc business, what they wrote is a reliable source but it is not a secondary source and I believe for the summary or an overview we really do need a secondary source to give context and assess weight and interpret what they mean in accordance with WP:OR. Surely we have some secondary source for this?, or do you have some problem with us trying to follow Wikipedia's policies and guidelines? Dmcq (talk) 12:39, 8 August 2016 (UTC)
- Also, do we really have to have a cite here? (see WP:LEADCITE) NewsAndEventsGuy (talk) 12:09, 8 August 2016 (UTC)
- In this proposed POLICY paragraph we are trying to present a top-level summary of POLICY position of the planet's most encompassing group of POLICY MAKERS, i.e. the UNFCCC. Are you saying their own words are not RS for their own views?NewsAndEventsGuy (talk) 12:09, 8 August 2016 (UTC)
- I thought I had explained myself but seemingly even that short statement was not properly understood. The document was quite a bit longer and was written by politicians and this is supposed to summarize a part of it. Interpreting, getting the important parts and summarizing requires a secondary source. I have no objection to primary source in the body of the article to back things up but I really would prefer to see secondary sources used in the lead for the overview. Otherwise it is verging into original research grabbing bits of primary sources one thinks are important. Dmcq (talk) 08:28, 8 August 2016 (UTC)
- Complying with RS does not mean complying with the policies and guidelines. I was pointing at OR not RS. As to LEADCITE I agree with that. However we are talking here about something based on a primary source rather than summarizing a part of the article. I was not proposing a change, if I was I would have looked for a good source. Please do not talk about connecting the dots as if I am stupid. Dmcq (talk) 16:16, 8 August 2016 (UTC)
- I don't think you're stupid, just think your rhetorical baiting "or do you have some problem with us trying to follow Wikipedia's policies and guidelines?" doesn't connect any dots, and so does not lead to article improvements. Since your concern is policy WP:OR, note that the section of that policy regarding WP:PRIMARY sources says in part "A primary source may only be used on Wikipedia to make straightforward, descriptive statements of facts that can be verified by any educated person with access to the primary source but without further, specialized knowledge." The proposed cite supports the proposed text within the meaning of this sentence, does it not? NewsAndEventsGuy (talk) 16:43, 8 August 2016 (UTC)
- Wikipedia's policies and guidelines ask us to produce secondary sources for weight and interpretation. And I gave reasons why we can't just summarize what they said directly. We can either use LEADCITE or else do the job properly with a secondary source but summarizing a primary source is not covered by either of those and LEADCITE does not help with summarizing a primary source. You seem to want to put in that summary without a secondary source and seem to think it is other people's problem to find some secondary source to back up an editor's summary of a primary source. Dmcq (talk) 18:41, 8 August 2016 (UTC)
- I don't think you're stupid, just think your rhetorical baiting "or do you have some problem with us trying to follow Wikipedia's policies and guidelines?" doesn't connect any dots, and so does not lead to article improvements. Since your concern is policy WP:OR, note that the section of that policy regarding WP:PRIMARY sources says in part "A primary source may only be used on Wikipedia to make straightforward, descriptive statements of facts that can be verified by any educated person with access to the primary source but without further, specialized knowledge." The proposed cite supports the proposed text within the meaning of this sentence, does it not? NewsAndEventsGuy (talk) 16:43, 8 August 2016 (UTC)
- Complying with RS does not mean complying with the policies and guidelines. I was pointing at OR not RS. As to LEADCITE I agree with that. However we are talking here about something based on a primary source rather than summarizing a part of the article. I was not proposing a change, if I was I would have looked for a good source. Please do not talk about connecting the dots as if I am stupid. Dmcq (talk) 16:16, 8 August 2016 (UTC)
- @Enescot: could you please repost the proposed text, and include the sources in the current version you suggested we also include? That might help move things forward NewsAndEventsGuy (talk) 17:18, 8 August 2016 (UTC)
- How about posting a secondary source to give it weight in the lead of the article? Or else just summarize what is in the article per LEADCITE? I really would like it to follow how things are done in Wikipedia. rather than just grabbing a primary source and taking bits out of it to put into the lead according to some editors interpretation of weight. Why do you want to stick an unsupported primary source into the lead? Dmcq (talk) 18:22, 8 August 2016 (UTC)
- I see the very last citation in the paragraph [1] is a secondary source so that can be used for weight but it doesn't cover many points but there's a number at Paris Agreement which do for other bits. Dmcq (talk) 18:54, 8 August 2016 (UTC)
- Thanks for the comments. I'll respond to Dmcq first. With respect, I have spend some time reading about this subject so I think I have some idea of what issues are important. I do not think I am placing undue emphasis on the 1.5 degrees C limit. For example, the importance of the earlier 2 C limit is discussed in the authoritative IPCC report and the IEA's World Energy Outlook. Reliable sources also show that the new 1.5 C limit is important [2] [3] [4]. Enescot (talk) 18:57, 8 August 2016 (UTC)
- The first sentence in the paragraph is a straightforward summary of the section 'Possible responses to global warming' and basically lists the headings in that so there's no problem with no cites on that. The bit you are talking about corresponds best I think with the section 'Political discussion' which doesn't seem to be fully up to date with the Paris Agreement but is near to it. I wasn't complaining about the scholarship at all or what was there, I was just wanting a secondary source for weight of the bit put in. Newspapers aren't great for detail but the do provide weight for instance the Guardian [5] 'Governments have agreed to “pursue efforts” to limit warming to 1.5C above pre-industrial levels: something that would have seemed unthinkable just a few months ago.' Dmcq (talk) 19:50, 8 August 2016 (UTC)
- Thanks for the response. I'm happy to add a secondary source as you suggest. Enescot (talk) 17:58, 15 August 2016 (UTC)
- Thanks, I do think it is important to have some sort of external weight shown rather than us just working from official sites and documents. Dmcq (talk) 18:18, 15 August 2016 (UTC)
- As a supplement to the original proposal, I agree. Still not sure exactly how the proposed text will be cited, in terms of other sources, but that's ok. Enescot, go ahead and try your change and then we'll know. NewsAndEventsGuy (talk) 18:24, 15 August 2016 (UTC)
- Thanks, I do think it is important to have some sort of external weight shown rather than us just working from official sites and documents. Dmcq (talk) 18:18, 15 August 2016 (UTC)
- Thanks for the response. I'm happy to add a secondary source as you suggest. Enescot (talk) 17:58, 15 August 2016 (UTC)
- The first sentence in the paragraph is a straightforward summary of the section 'Possible responses to global warming' and basically lists the headings in that so there's no problem with no cites on that. The bit you are talking about corresponds best I think with the section 'Political discussion' which doesn't seem to be fully up to date with the Paris Agreement but is near to it. I wasn't complaining about the scholarship at all or what was there, I was just wanting a secondary source for weight of the bit put in. Newspapers aren't great for detail but the do provide weight for instance the Guardian [5] 'Governments have agreed to “pursue efforts” to limit warming to 1.5C above pre-industrial levels: something that would have seemed unthinkable just a few months ago.' Dmcq (talk) 19:50, 8 August 2016 (UTC)
Injecting some science into the discussion
The article needs to do a better job at separating out "global warming" from "man made global warming" and especially catastrophic predictions of future man made global warming. The earth has been warming for 20,000 years since the end of the last glacial maximum. There is no good evidence that the rate of warming increased during the 20th century as opposed to the 19th at all let alone what the causes of this unmeasured increase in warming were.
- Sea Level Rise
- "Absolute global sea level rise is believed to be 1.7-1.8 millimeters/year.” http://tidesandcurrents.noaa.gov/sltrends/globalregional.htm
- "No significant acceleration in the rate of sea level rise during the 20th century has been detected." https://www.ipcc.ch/ipccreports/tar/wg1/409.htm
Surface Temperature The first measurements of the trend in global surface temperature were made in 1978 by the University of Alabama Huntsville using the satellites. Before this time there are no global measurements only loose estimates which leave out the majority of the surface such as the ocean. Here is the surface temperature data from UAH. http://www.nsstc.uah.edu/climate/2016/july/July2016_graph.png. It shows a warming trend of roughly 0.12 C per decade which just like with the sea level rise is not known to be greater than the 19th century warming rate. There is also a competing Satellite data set from RSS, a private company, which has similar findings. Charts that go back to 1880 are wild estimates not measurements, it is laughable.
Ocean Warming
- The ice caps do not melt due to minor surface temperature changes, they melt from thermal expansion of the ocean which takes a lot of energy being absorbed into the ocean. We first started measuring the temperature of the ocean (below the surface) in 2005. There has been no measured warming. http://science.nasa.gov/science-news/science-at-nasa/2014/06oct_abyss/
Troposphere: In order for the greenhouse effect to be the primary cause of surface warming the troposphere must warm significantly faster than the surface. However according to the measurements "The troposphere has not warmed quite as fast as most climate models predict." http://www.remss.com/research/climate
Extreme Weather:
- There has been no measured increase in extreme weather and therefore such a nonexistent increase can not be linked to the human contribution to climate change
- "Within the resolution of the available data, our evidence does not support the presence of significant long-period global or individual basin linear trends for minor, major, or total hurricanes within the period(s) covered by the available quality data.” http://journals.ametsoc.org/doi/abs/10.1175/JCLI-D-11-00719.1
- "There is not enough evidence at present to suggest more than low confidence in a global-scale observed trend in drought or dryness (lack of rainfall) since the middle of the 20th century." “There is low confidence in any long term increases in tropical cyclone activity … and low confidence in attributing global changes to any particular cause.” Any increased hurricane damages “have not been conclusively attributed to anthropogenic climate change; most such claims are not based on scientific attribution methods.” https://www.ipcc.ch/report/ar5/ — Preceding unsigned comment added by 97.91.188.153 (talk) 18:21, 15 August 2016 (UTC)
Too vague. Please propose a specific change and whatever source you base it on, provided the source is one that wikipedia considers to be a WP:reliable source. Then we can talk. NewsAndEventsGuy (talk) 18:29, 15 August 2016 (UTC)
- PS also, find some current cites. Your statement ""No significant acceleration in the rate of sea level rise during the 20th century has been detected." based on https://www.ipcc.ch/ipccreports/tar/wg1/409.htm is from the IPCC Third Assessment Report which is now ancient history NewsAndEventsGuy (talk) 19:01, 15 August 2016 (UTC)
- It has things in it like 'Projected sea level changes from 1990 to 2100'. What is the point of things projecting from 1990 when we're in 2016! The rest of it is half truths or misstatements. Saying the ocean is not warming by pointing to something saying the ocean abyss isn't warming for instance. The poster needs to apply a bit of scientific skepticism in the form of actually reading what they posted and what they cited and thinking about it. Try figuring out why the lower part of the ocean tends to have a fairly constant low temperature for instance - that's an interesting bit of science. Dmcq (talk) 22:39, 15 August 2016 (UTC)
- No I'm sorry but tidal gauge measurements showing no change from the 19th and 20th century in the rate of sea level rise is not ancient history. I included multiple sources already. The second is the NOAA's official measurements putting it at 1.7-1.8mm/year which is in line with 19th century estimates. Again minor surface temperature changes do not melt the ice caps, thermal expansion of the ocean does. Try taking 2 frozen chickens and putting one in warm 70 F room temperature air and the other in cold 40F water and see which one defrosts on time for dinner.
. — Preceding unsigned comment added by 97.91.188.153 (talk) 11:38, 16 August 2016 (UTC)
- You jolly well should be sorry, coming up with this mish-mash of figures grabbed to suit your agenda. Either provide concise proposals for article improvement based on current sources, or desist. . dave souza, talk 11:57, 16 August 2016 (UTC)
Evidently, there has been no acceleration in sea level rise because it has been masked! [6] Poodleboy (talk) 20:17, 16 August 2016 (UTC)
- The Mail? Really? But the name enabled me to find the original paper. --Stephan Schulz (talk) 20:26, 16 August 2016 (UTC)
- That is one of the ways you judge a source, i.e., by whether you can assess their sources. Keep in mind that we sometimes use unsourced class notes. Poodleboy (talk) 20:47, 16 August 2016 (UTC)
- I assume you're joking since that's wrong on both points. Although an accessible source is preferable to an equally qualified hard-t0-access source, per WP:PAYWALL "Do not reject reliable sources just because they are difficult or costly to access." Secondly, the use of unsourced class notes is a joke (but not really that funny) NewsAndEventsGuy (talk) 21:16, 16 August 2016 (UTC)
- I wish I was joking. Perhaps you can help with this "source": [7]. BTW, I said "assess" their sources, not "access" their sources. I've no problem with paywalls. Poodleboy (talk) 21:28, 16 August 2016 (UTC)
- You mean the lecture notes which contain this syllabus with literature references? --Stephan Schulz (talk) 21:35, 16 August 2016 (UTC)
- Yes, that is the one without literature references. Did you check? Poodleboy (talk) 21:42, 16 August 2016 (UTC)
- We again seem to be separated by a common language (or maybe two). "Lee R. Kump, James F. Kasting, and Robert Crane, 2nd. ed. (2003) The Earth System: An Introduction to Earth Systems Science. Prentice-Hall: Upper Saddle River, New Jersey, 351 pp.", "Atmospheric Science: An Introductory Survey by John M. Wallace and Peter V. Hobbs. Academic Press 1977, ISBN 0127329501", "Essentials of Meteorology: An Invitation to the Atmosphere by C. Donald Ahrens. Wadsworth Publ. 1998, ISBN 0534537669", ... --Stephan Schulz (talk) 21:48, 16 August 2016 (UTC)
- Really, the required text for the course, and supplemental reading? That is some distance removed, from the particular information the source is being used for. That wouldn't be the first course to not even use the required text. Poodleboy (talk) 22:21, 16 August 2016 (UTC)
- We again seem to be separated by a common language (or maybe two). "Lee R. Kump, James F. Kasting, and Robert Crane, 2nd. ed. (2003) The Earth System: An Introduction to Earth Systems Science. Prentice-Hall: Upper Saddle River, New Jersey, 351 pp.", "Atmospheric Science: An Introductory Survey by John M. Wallace and Peter V. Hobbs. Academic Press 1977, ISBN 0127329501", "Essentials of Meteorology: An Invitation to the Atmosphere by C. Donald Ahrens. Wadsworth Publ. 1998, ISBN 0534537669", ... --Stephan Schulz (talk) 21:48, 16 August 2016 (UTC)
- Yes, that is the one without literature references. Did you check? Poodleboy (talk) 21:42, 16 August 2016 (UTC)
- You mean the lecture notes which contain this syllabus with literature references? --Stephan Schulz (talk) 21:35, 16 August 2016 (UTC)
- I wish I was joking. Perhaps you can help with this "source": [7]. BTW, I said "assess" their sources, not "access" their sources. I've no problem with paywalls. Poodleboy (talk) 21:28, 16 August 2016 (UTC)
- I assume you're joking since that's wrong on both points. Although an accessible source is preferable to an equally qualified hard-t0-access source, per WP:PAYWALL "Do not reject reliable sources just because they are difficult or costly to access." Secondly, the use of unsourced class notes is a joke (but not really that funny) NewsAndEventsGuy (talk) 21:16, 16 August 2016 (UTC)
- That is one of the ways you judge a source, i.e., by whether you can assess their sources. Keep in mind that we sometimes use unsourced class notes. Poodleboy (talk) 20:47, 16 August 2016 (UTC)
http://www.nature.com/news/antarctic-model-raises-prospect-of-unstoppable-ice-collapse-1.19638
"Despite these limitations, our new model physics are shown to be capable of simulating two very different ancient sea-level events: the LIG, driven primarily by ocean warming and MISI dynamics, and the warmer Pliocene, in which surface meltwater and MICI dynamics are also important. When applied to future scenarios with high greenhouse gas emissions, our palaeo-filtered model ensembles show the potential for Antarctica to contribute >1 m of GMSL rise by the end of this century, and >15 metres of GMSL rise in the next 500 years. In RCP8.5, the projected onset of major ice-sheet retreat occurs sooner (about 2050), and is substantially faster (>4 cm yr−1 after 2100) and higher (Figs 4 and 5) than implied by other recent studies [44,45,49]. These differences are mainly due to our addition of model physics linking surface meltwater and ice dynamics via hydrofracturing of buttressing ice shelves and structural failure of marine-terminating ice cliffs. In addition, we use (1) freely evolving grounding-line dynamics that preclude the need for empirically calibrated retreat rates[49], (2) highly resolved atmosphere and ocean model components rather than intermediate-complexity climate models[45] or simplified climate forcing[44], and (3) calibration based on major retreat during warm palaeoclimates rather than recent minor retreat driven by localized ocean forcing."
Count Iblis (talk) 22:37, 16 August 2016 (UTC)
Extreme weather
Which is the more reliable source, [8] from 2012 cited in the discussion above, or the more recent [9]? EllenCT (talk) 16:41, 17 August 2016 (UTC)
- I'm tempted to say they are both reliable, but this is a dynamic encyclopedia that tries to keep up with current events while avoiding WP:Recentism. Maybe the better answer is to ask you to provide context. How would you propose to use them? NewsAndEventsGuy (talk) 17:20, 17 August 2016 (UTC)
- Reliable for what? They cover different aspects and ways of assessing extreme weather: the December 2015 paper is an overview of various physical extremes, while the 2012 paper is about tropical cyclones in relation to economic damage. Given the involvement of Roger A. Pielke, Jr. in the latter, it would be interesting to see how it was assessed in AR5, would it come under WG2? . . . dave souza, talk 17:47, 17 August 2016 (UTC)
- I was thinking about summarizing these parts of the abstract and conclusion:
| “ | since the 1950s, there has been a trend toward fewer cold days and nights and more warm days and nights globally, increasing heavy precipitation events in many parts of the world, and regional trends (both increasing and decreasing) in drought and dryness extremes. [In the US,] there has generally been an increasing trend in drought area over the 20th to 21st centuries and over the last four decades.... There has been an increase in the occurrence of extreme 1-day precipitation events over the last hundred years, with the rate of increase accelerating in recent decades. Extremely warm maximum and minimum temperatures have shown an increasing trend over the 20th to 21st centuries and over the last four decades.... The trends in these climate extremes pose a serious risk to food security in many parts of the world. Negative impacts of these climate trends on crop and terrestrial food production are more common than positive impacts ... there have been several periods of rapid food and cereal price increases following the occurrence of climate extremes ... crop production is expected to be consistently and negatively affected by climate change in low-latitude countries. | ” |
- Any objections to summarizing that, or even just quoting that excerpt? EllenCT (talk) 20:25, 17 August 2016 (UTC)
- While i'd like to see comments from others on this, my own feeling is that it points out some issues which can be covered in the article, and it would be best to check out the IPCC AR5 coverage of each before summarising points which haven't already been covered, using the IPCC report as the main source. . . dave souza, talk 21:08, 17 August 2016 (UTC)
- I suggest that we be careful in such selective quotes with ellipsis, for instance the statement on negative impacts being more common than positive impacts is not a result or conclusion of this paper, but rather a reference to AR5 WGII which was clipped at the ellipsis, i.e., Porter, et al (2014). The IPCC AR5 should be used directly to make that point. Poodleboy (talk) 22:07, 17 August 2016 (UTC)
- @Ellen, in my view that pullquote is way too long. As a top level summary article, could we report on the neg outweighing the positive and (as I think we already do) steer people to Effects of global warming? And maybe too using some text as based on the quote such as In many places, the trends of climate extremes poses serious risks to food security."? NewsAndEventsGuy (talk) 22:53, 17 August 2016 (UTC)
- While i'd like to see comments from others on this, my own feeling is that it points out some issues which can be covered in the article, and it would be best to check out the IPCC AR5 coverage of each before summarising points which haven't already been covered, using the IPCC report as the main source. . . dave souza, talk 21:08, 17 August 2016 (UTC)
- Any objections to summarizing that, or even just quoting that excerpt? EllenCT (talk) 20:25, 17 August 2016 (UTC)
- The sources don't appear to conflict. The December 2015 paper refrains from discussing hurricanes. The 2012 paper is a new scientific result published in a well established specialized journal, the 2015 paper is a review article based upon a symposium presentation, and it is unclear what quality of expert review it received. However the review appears to be an early attempt to apply new standards to the existing data and literature. To get beyond the publication channel and the type of the articles, would require assessment of the science itself. Poodleboy (talk) 19:03, 17 August 2016 (UTC)
- Well, how do you feel about the editorial board? Is there any indication the review didn't go through the ordinary peer review process? EllenCT (talk) 20:25, 17 August 2016 (UTC)
- The 2012 paper is a not very new scientific/economic assessment of storm damage in relation to frequency of hurricanes and cyclones, published in July 2012. Later that year, Hurricane Sandy changed the figures for damages, and there have been more recent storms globally, as well as an expected increase.[10] So, have there been more papers on this topic? . . dave souza, talk 21:08, 17 August 2016 (UTC)
- In summary, AR5 WG1 chapter 2 p. 162 "Confidence remains low for long-term (centennial) changes in tropical cyclone activity, after accounting for past changes in observing capabilities. However, it is virtually certain that the fre- quency and intensity of the strongest tropical cyclones in the North Atlantic has increased since the 1970s. {2.6.3}" – lots more detail further into the chapter. . . dave souza, talk 21:26, 17 August 2016 (UTC)
- Sixty years is about one sample of the climate, hurricanes have cycles too. Modeling studies project increases in intensity but not frequency. If you try to include more than one cycle you get results more like on page 216 of that document "More recent assessments indicate that it is unlikely that annual numbers of tropical storms, hurricanes and major hurricanes counts have increased over the past 100 years in the North Atlantic basin." The 70s is cherry picking a starting point. Despite Sandy, recent activity has been low. Poodleboy (talk) 21:44, 17 August 2016 (UTC)
- AR5 considered Weinkle, et al, grouping it with similar results emphasis mine:
- "Measures of land-falling tropical cyclone frequency (Figure 2.34) are generally considered to be more reliable than counts of all storms which tend to be strongly influenced by those that are weak and/or short lived. Callaghan and Power (2011) find a statistically significant decrease in Eastern Australia land-falling tropical cyclones since the late 19th century although including 2010/2011 season data this trend becomes non-signi cant (i.e., a trend of zero lies just inside the 90% confidence interval). Significant trends are not found in other oceans on shorter time scales (Chan and Xu, 2009; Kubota and Chan, 2009; Mohapatra et al., 2011; Weinkle et al., 2012), although Grinsted et al. (2012) find a significant positive trend in eastern USA using tide-guage data from 1923–2008 as a proxy for storm surges associated with land-falling hurricanes. Differences between tropical cyclone studies highlight the challenges that still lie ahead in assessing long-term trends."
- Poodleboy (talk) 21:55, 17 August 2016 (UTC)
For sake of random readers passing by who don't already know this.... despite the subsection heading "extreme weather", this thread appears to be focusing on just the particular type variably called hurricane or typhoon or cyclone. There are many other types of extreme weather besides that one. NewsAndEventsGuy (talk) 21:31, 17 August 2016 (UTC)
Temp of earth without the GH effect
Whatever you might think of the way in which this came to light, please examine this excerpt
I tend to agree with Poodleboy to the extent that the first source isn't very strong, and I was not able to verify it using the second source. I did not attempt to verify this using the other sources mentioned elsewhere in the paragraph. Can anyone provide something better? NewsAndEventsGuy (talk) 00:04, 17 August 2016 (UTC)
"The effect of albedo on temperature can be approximated by assuming that the energy absorbed is multiplied by 0.7, but that the planet still radiates as a black body (the latter by definition of effective temperature, which is what we are calculating). This approximation reduces the temperature by a factor of 0.7^(1/4), giving 255 K (−18 °C).[5][6]"
So, we're talking about an effective temperature here where you pretend that the Earth radiates as a black body in the far infrared while it absorbs solar radiation with an albedo of 0.3. What we need in the context of this article is what the temperature really would be, for that you need to consider the albedo in the far infrared, which presumably is not exactly equal to 1. There should be sources where a better estimate is derived...Count Iblis (talk) 02:21, 17 August 2016 (UTC)
- Similar calculations arrive a -19C instead in AR4:
- "To emit 240 Wm–2, a surface would have to have a temperature of around –19°C. This is much colder than the conditions that actually exist at the Earth’s surface (the global mean surface temperature is about 14°C). Instead, the necessary –19°C is found at an altitude about 5 km above the surface." [11]
- the corresponding figure at AR5 would be only 239 Wm-2 so the emission at altitude would correspond to a temperature less than the AR4 figure, although it probably rounds to the same value:
- "This leaves 240 W m–2 of solar radiation absorbed by the Earth, which is nearly balanced by thermal emission to space of about 239 W m–2 (based on CERES EBAF), considering a global heat storage of 0.6 W m–2 (imbalance term in Figure 2.11) based on Argo data from 2005 to 2010 (Hansen et al., 2011; Loeb et al., 2012b; Box 3.1). The stated uncertainty in the solar reflected TOA fluxes from CERES due to uncertainty in absolute calibration alone is about 2% (2-sigma), or equivalently 2 W m–2 (Loeb et al., 2009). The uncertainty of the outgoing thermal flux at the TOA as measured by CERES due to calibration is ~3.7 W m–2 (2σ). In addition to this, there is uncertainty in removing the influence of instrument spectral response on measured radiance, in radiance-to-flux conversion, and in time– space averaging, which adds up to another 1 W m–2 (Loeb et al., 2009)." (WG1AR5_ALL_FINAL.pdf)
- Poodleboy (talk) 04:08, 17 August 2016 (UTC)
Refs for this thread
References
- ^ "Solar Radiation and the Earth's Energy Balance". Eesc.columbia.edu. Retrieved 2010-10-15.
- ^ Intergovernmental Panel on Climate Change Fourth Assessment Report. Chapter 1: Historical overview of climate change science page 97
Inconsistent definition
Over on the climate change page, it defines climate changes as /any/ change in climate over millions of years, including both human and natural causes, and says "global warming" is the term for human causes in the last century. But on this page it says the two terms are equivilent in the first sentence. Please can some standard terminology be agreed upon to avoid confusion ? (What terms are used in the scientific literature? And what term would be used for recent human-caused climate change other than warming, such as changes to rain patterns ?) — Preceding unsigned comment added by 92.26.234.255 (talk) 10:43, 23 August 2016 (UTC)
- This has been thoroughly and repeatedly discussed in the talk page archives at both this talk page and at Talk:Climate_change. In the yellowish box at the top look for "archives". Please read the old threads and if you still want to discuss be sure to reference the old threads so we're adding to what was said before instead of just rehashing it. Thanks NewsAndEventsGuy (talk) 12:51, 23 August 2016 (UTC)
new article suggestion "RepublicEn"
I don't have desire myself, but someone might be interested in starting an article about the RepublicEn organization.
Notability sources include
- http://www.eenews.net/stories/1060040687
- http://www.pri.org/stories/2016-07-23/republican-says-his-partys-denial-climate-science-courting-disaster-voters
Here is the groups website NewsAndEventsGuy (talk) 13:15, 23 August 2016 (UTC)
clarification of more than half of climate commitment due to natural forcings
Housekeeping note, This was in good faith reply to my tag "clarify", which I have since removed.NewsAndEventsGuy (talk) 13:48, 18 August 2016 (UTC)
The climate warming before AGW became significant, i.e., before 1950 is mostly attributed to natural causes. Natural causes, just like anthropogenic causes responsible for most of the warming since 1950, require centuries to bring the thermal capacity of the oceans into equilibrium with the new forcing levels. In other words AGW is built upon or added to prior natural warming that the oceans had not yet reached equalibrium with. Wigley analyzed and attributed the relative contributions. The relevant quote is in the provided citation. Note that Wigley was published in the same issue of the journal Science as the Meehl, et al article cited for other parts of this paragraph on climate commitment, in fact Meehl immediately follows Wigley. Note that climate commitment means that some warming trend would continue, even if the atmospheric concentrations were stabilized at current levels.Poodleboy (talk) 13:05, 18 August 2016 (UTC)
- Thanks. Originally I left a "clarification needed" tag. Then I was surprised with additional time to work on this and replaced the tag with this series of edits which hopefully is a good start.NewsAndEventsGuy (talk) 13:48, 18 August 2016 (UTC)
- I think the term 'committment' is a bit misleading and will cause misunderstanding, I can't see why they chose it. I'd have just said 'with constant composition' or 'with constant emissions'. I suppose we're stuck with it though. I haven't access to the data of Wigley's paper and I must admit to also being surprised they make such a meal of the natural forcing component, I'd have thought a good approximation of its ratio to anthropogenic would be given by the difference between the rate at which temperatures rose in the 19th century and the rise in the last thirty. I guess we've got to just go by whatever the science journals say. Dmcq (talk) 14:06, 18 August 2016 (UTC)
- The pdf of the full text is in the citation, before the DOI. I think "commitment" is used because of the concept that if there is a new level of forcing, then unless something else changes, the climate is "committed" to further changes until the oceans and other components of the climate system fully adjust. The atmosphere and ocean surface layer temperatures respond relatively quickly. However, most of the thermal capacity of the system is in the oceans. The thermal capacity of the atmosphere is about equivalent to the top 5 feet of the oceans (despite having the mass of the top 32 feet). Poodleboy (talk) 14:30, 18 August 2016 (UTC)
- Yes I think that illustrates well why I think it is a bad way of putting it. There is no committment - only an assumption about the conditions. It isn't like an iron rod where when you heat one end then it would be reasonable to talk about a committment for some heat to reach the other end after some time. I did look at the pdf but for instance I wanted to see table S1. Dmcq (talk) 15:02, 18 August 2016 (UTC)
- I disagree, but will refrain from extending the general discussion at article talk. Is there an article improvement proposal to discuss? NewsAndEventsGuy (talk) 15:10, 18 August 2016 (UTC)
- I was addressing where NewsAndEventsGuy originally put in a clarification tag and then talked about commitment. I think if it could be phrased differently fro some source or commitment could be explained better it would help. The thermal capacity of the ocean does not commit anything in the sense of the iron bar or at least not in the same direction. Dmcq (talk) 17:07, 18 August 2016 (UTC)
- If I am following what you're saying, Dmcq, I understand the sources exactly the opposite. They do use the phrase "climate change commitment" (or variants). We even have an article Climate commitment, though it could use substantial improvement. The dubious google-test produces over 150,000 hits on search string "climate change" OR "global warming" "already in the pipeline". Seems to me that the metal rod is a reasonable analogy, especially if you (A) keep the flame in contact with the one end, and (B) superglue your bare hand to the other. That would be the "constant concentration" scenario described in the sources. Turn up the flame at a constant rate for the "constant emissions" scenario. Turn up the flame faster and faster for what we're actually doing at present. Anyway, due to past forcings - both natural and human - these sources say there are an awful lot of BTUs strewn throughout the five parts of the overall climate system, and they have yet to spread out evenly so as to find equilibrium. The issue not how many BTUs can theoretically be held here or there in relation to the other parts (thermal capacity), but how many are actually present in relation to the other parts (thermal disequilibrium). Much like holding a flame to the rod for X seconds loads some BTUs into the rod which take a while to propogate down to where you are holding it. With your hand superglued to the other end you would indeed be "committed" to the ultimate result. One weakness with the example is that we could easily turn off the propane torch, but there is no easy way to turn off the positive climate forcing (i.e., net warming) that continues to occur as a result of past natural and human forcings. NewsAndEventsGuy (talk) 18:06, 18 August 2016 (UTC) (Later....) Oops.... while interpreting the example I screwed up the time factor. Contrary to what I first said, "Turning off the propane torch" would equate to adopting a Low-carbon economy to prevent additional forcing in the future. Here, we are talking about global warming already in the pipeline from past forcing, which is more like the heat already in the metal rod from the flame in the past. To keep that heat from eventually burning our hand we'd have to quick dunk the metal rod in the blacksmiths' barrel of cold water. But the BTUs aren't gone, they just go in the water. At the planetary scale we don't have an easy way to dispose of that "extra heat" already in the system.... NewsAndEventsGuy (talk) 12:49, 19 August 2016 (UTC)
- I was addressing where NewsAndEventsGuy originally put in a clarification tag and then talked about commitment. I think if it could be phrased differently fro some source or commitment could be explained better it would help. The thermal capacity of the ocean does not commit anything in the sense of the iron bar or at least not in the same direction. Dmcq (talk) 17:07, 18 August 2016 (UTC)
- I disagree, but will refrain from extending the general discussion at article talk. Is there an article improvement proposal to discuss? NewsAndEventsGuy (talk) 15:10, 18 August 2016 (UTC)
- Yes I think that illustrates well why I think it is a bad way of putting it. There is no committment - only an assumption about the conditions. It isn't like an iron rod where when you heat one end then it would be reasonable to talk about a committment for some heat to reach the other end after some time. I did look at the pdf but for instance I wanted to see table S1. Dmcq (talk) 15:02, 18 August 2016 (UTC)
- The pdf of the full text is in the citation, before the DOI. I think "commitment" is used because of the concept that if there is a new level of forcing, then unless something else changes, the climate is "committed" to further changes until the oceans and other components of the climate system fully adjust. The atmosphere and ocean surface layer temperatures respond relatively quickly. However, most of the thermal capacity of the system is in the oceans. The thermal capacity of the atmosphere is about equivalent to the top 5 feet of the oceans (despite having the mass of the top 32 feet). Poodleboy (talk) 14:30, 18 August 2016 (UTC)
- I think the term 'committment' is a bit misleading and will cause misunderstanding, I can't see why they chose it. I'd have just said 'with constant composition' or 'with constant emissions'. I suppose we're stuck with it though. I haven't access to the data of Wigley's paper and I must admit to also being surprised they make such a meal of the natural forcing component, I'd have thought a good approximation of its ratio to anthropogenic would be given by the difference between the rate at which temperatures rose in the 19th century and the rise in the last thirty. I guess we've got to just go by whatever the science journals say. Dmcq (talk) 14:06, 18 August 2016 (UTC)
- If that really was a halfway decent model of what was happening I would be happy with it being called 'commitment'. However it just isn't. There is a little bit like that but the major part is like putting your hand at the same end as the flame but not in the flame. The temperature will gradually rise - but it would start going down as soon as one removed the heat, whereas at the other end the temperature would rise for a while after the heat had been removed. Dmcq (talk) 21:28, 18 August 2016 (UTC)
- Great, but how should we improve the article based on what the RSs say? NewsAndEventsGuy (talk) 21:38, 18 August 2016 (UTC)
- Any idea who first used the term? They might say something about it or have a good way of putting it. Might be an idea for an article even. We have an article on Radiative forcing which is a good idea because it isn't an obvious term and Climate sensitivity is seems a sensible name. Methane emission from tundras is really more of a feedback effect but I guess it could be called commitment. It is a bit messy wi8th a number of things which act a bit the same but really are different, rather like when I was reading a paper where they were distinguishing between noise and chaos in some problem with springs. Dmcq (talk) 22:06, 18 August 2016 (UTC)
- Re: "Might be an idea for an article even" see Climate commitment.... NewsAndEventsGuy (talk) 22:45, 18 August 2016 (UTC)
- I should have seen that, thanks. I don't mind how commitment was used by the IPCC in the history section. I'm surprised there seems so little done since related to the topic since Wigley. Dmcq (talk) 00:32, 19 August 2016 (UTC)
- Re: "Might be an idea for an article even" see Climate commitment.... NewsAndEventsGuy (talk) 22:45, 18 August 2016 (UTC)
- Any idea who first used the term? They might say something about it or have a good way of putting it. Might be an idea for an article even. We have an article on Radiative forcing which is a good idea because it isn't an obvious term and Climate sensitivity is seems a sensible name. Methane emission from tundras is really more of a feedback effect but I guess it could be called commitment. It is a bit messy wi8th a number of things which act a bit the same but really are different, rather like when I was reading a paper where they were distinguishing between noise and chaos in some problem with springs. Dmcq (talk) 22:06, 18 August 2016 (UTC)
- Great, but how should we improve the article based on what the RSs say? NewsAndEventsGuy (talk) 21:38, 18 August 2016 (UTC)
- If that really was a halfway decent model of what was happening I would be happy with it being called 'commitment'. However it just isn't. There is a little bit like that but the major part is like putting your hand at the same end as the flame but not in the flame. The temperature will gradually rise - but it would start going down as soon as one removed the heat, whereas at the other end the temperature would rise for a while after the heat had been removed. Dmcq (talk) 21:28, 18 August 2016 (UTC)
There's actually been quite a bit of work on commitment since 2005 (when the Wigley article was published). See here. Shock Brigade Harvester Boris (talk) 00:36, 19 August 2016 (UTC)
- Heh. I was doing my own Gscholar search as you posted. Many of the hits that contain "commitment" are actually talking about nations commitment to follow through on various pledges, rather than the topic at hand. But I'm sure someone interested in "warming in the pipeline" could find more recent sources. NewsAndEventsGuy (talk) 00:41, 19 August 2016 (UTC)
- Interesting. In my search most of the hits are directly related to climate commitment. The general-purpose Google search customizes itself to the results that (in its algorithmic opinion) a given user is most likely to find relevant, so maybe GS does likewise. Anyway these look interesting although I haven't read them yet: [12], [13], [14], this one in particular. There are plenty more when you are done with these... Shock Brigade Harvester Boris (talk) 00:59, 19 August 2016 (UTC)
- Thanks, and then IPCC AR5 WG1 TS suggests Chapters 6 and 12 of the full report are also relevant. I don't have time to go further with it. NewsAndEventsGuy (talk) 01:02, 19 August 2016 (UTC)
- Here is a quote from the beginning of the relevant section in the AR5 WG1 final report (pg 1102): "Climate change commitment, the fact that the climate will change further after the forcing or emissions have been eliminated or held constant, has attracted increased attention by scientists and policymakers shortly before the completion of IPCC AR4 (Hansen et al., 2005a; Meehl et al., 2005b, 2006; Wigley, 2005) (see also AR4 Section 10.7.1). However, the argument that the surface response would lag the RF due to the large thermal reservoir of the ocean in fact goes back much longer (Bryan et al., 1982; Hansen et al., 1984, 1985; Siegenthal- er and Oeschger, 1984; Schlesinger, 1986; Mitchell et al., 2000; Weth- erald et al., 2001)."Poodleboy (talk) 08:07, 19 August 2016 (UTC)
- Thanks for those references. The general message I get is that we'll need to capture CO2 - or more pessimistically that we're boned. They don't though directly address the topic of the section 'clarification of more than half of climate commitment due to natural forcings'. And I'm not actually certain what Wigley meant. Phrased like that it sounds like there is a committment to warming the earth which comes from the 19th century and before or perhaps before 1950 and only part of warming is due to recent increases in CO2, whereas as far as I can what is happening is that the preindustrial committment is mostly keeping the temperature down so in 2050 it will only be a fraction of the rise it would eventually get to after a few hundred years with no increase in CO2. So really clarification is needed. Dmcq (talk) 12:50, 19 August 2016 (UTC)
- Dmcq, see the methodology section of both papers. They both list the types of natural forcings taken into account (past solar variance, volcanism, aerosols).... though I admit to being a poor amateur and am clueless as to the details. Let's skip further speculation and focus on doing the best we can towards article improvements based on the RSs. Maybe someone with more expert knowledge will come along and hold our hands. NewsAndEventsGuy (talk) 14:08, 19 August 2016 (UTC)
- On Wikipedia we're supposed to put things in our own words after getting a good idea of what the original was saying. Both interpretations I gave could be what Wigley meant. The implications are practically diametrically opposite. I'd really like some source that could decide the matter. Dmcq (talk) 16:02, 19 August 2016 (UTC)
- The commitment does not come from the past warming in the 19th century through 1950. That warming has happened. The commitment comes from whatever was causing that warming continuing. If whatever forcing was causing that warming were to drop to the levels of forcing before the warming, then the positive imbalance that was storing heat in the oceans, would become a negative imbalance, and the ocean heat gains that had accumulated, would start to be lost. That would be a climate commitment to cooling. Without the AGW since 1950, a positive energy imbalance would still be being stored in the oceans. The natural component reported by Wigley is responsible for some of the energy imbalance and some of the thermal expansion of the oceans. Most of its contribution to the surface warming had already occurred. But there is still some continuing surface warming even on land, even if it is just due to the oceans being warmer.Poodleboy (talk) 08:53, 20 August 2016 (UTC)
- I am looking for a reliable source that discusses the issue. Dmcq (talk) 11:10, 20 August 2016 (UTC)
- The Meehl and Wigley articles from the journal Science is a good start, the latest IPCC report still references them. The articles and IPCC WG1 reports contain references, including the section I quoted above. I also have also put things in my own words after having a good idea of what the originals and the reviews were saying.Poodleboy (talk) 12:00, 20 August 2016 (UTC)
- I would still like to see a good source about it rather than your interpretation. As I pointed out above there is more than one interpretation and they have very different implications. As it is written at the moment it sounds like two thirds of the current rise in temperatures is due to the planet warming up anyway due to natural changes.
Wigley says the atmosphere would have to be returned to pre-industrial composition to avoid the increase. I fail to see how that can be consistent with two thirds of the rise being due to natural causes, if two thirds was due to natural causes we'd have to do something to reduce the CO2 further rather than just reinstate pre-industrial levels.So we need some reliable source that explains the business straightforwardly rather than in a manner which can have different interpretations. Dmcq (talk) 16:40, 20 August 2016 (UTC)
- I would still like to see a good source about it rather than your interpretation. As I pointed out above there is more than one interpretation and they have very different implications. As it is written at the moment it sounds like two thirds of the current rise in temperatures is due to the planet warming up anyway due to natural changes.
- The Meehl and Wigley articles from the journal Science is a good start, the latest IPCC report still references them. The articles and IPCC WG1 reports contain references, including the section I quoted above. I also have also put things in my own words after having a good idea of what the originals and the reviews were saying.Poodleboy (talk) 12:00, 20 August 2016 (UTC)
- I am looking for a reliable source that discusses the issue. Dmcq (talk) 11:10, 20 August 2016 (UTC)
- The commitment does not come from the past warming in the 19th century through 1950. That warming has happened. The commitment comes from whatever was causing that warming continuing. If whatever forcing was causing that warming were to drop to the levels of forcing before the warming, then the positive imbalance that was storing heat in the oceans, would become a negative imbalance, and the ocean heat gains that had accumulated, would start to be lost. That would be a climate commitment to cooling. Without the AGW since 1950, a positive energy imbalance would still be being stored in the oceans. The natural component reported by Wigley is responsible for some of the energy imbalance and some of the thermal expansion of the oceans. Most of its contribution to the surface warming had already occurred. But there is still some continuing surface warming even on land, even if it is just due to the oceans being warmer.Poodleboy (talk) 08:53, 20 August 2016 (UTC)
- On Wikipedia we're supposed to put things in our own words after getting a good idea of what the original was saying. Both interpretations I gave could be what Wigley meant. The implications are practically diametrically opposite. I'd really like some source that could decide the matter. Dmcq (talk) 16:02, 19 August 2016 (UTC)
- Dmcq, see the methodology section of both papers. They both list the types of natural forcings taken into account (past solar variance, volcanism, aerosols).... though I admit to being a poor amateur and am clueless as to the details. Let's skip further speculation and focus on doing the best we can towards article improvements based on the RSs. Maybe someone with more expert knowledge will come along and hold our hands. NewsAndEventsGuy (talk) 14:08, 19 August 2016 (UTC)
- Thanks, and then IPCC AR5 WG1 TS suggests Chapters 6 and 12 of the full report are also relevant. I don't have time to go further with it. NewsAndEventsGuy (talk) 01:02, 19 August 2016 (UTC)
- Interesting. In my search most of the hits are directly related to climate commitment. The general-purpose Google search customizes itself to the results that (in its algorithmic opinion) a given user is most likely to find relevant, so maybe GS does likewise. Anyway these look interesting although I haven't read them yet: [12], [13], [14], this one in particular. There are plenty more when you are done with these... Shock Brigade Harvester Boris (talk) 00:59, 19 August 2016 (UTC)
Perhaps you are misunderstanding what Wigley says. Where does he say that the atmosphere would have to be returned to pre-industrial composition?Poodleboy (talk) 14:48, 22 August 2016 (UTC)
- Sorry you're right, I've struck that out. However here Our commitment to climate change is dependent on past, present and future emissions and decisions is a more recent paper which talks about talks about the zero emissions case as well as the constant composition and constant emissions cases. On page 9 you see that zero anthropogenic emissions leads to a practically immediate stabilization or gradual reduction of the temperature so I still can't see what this two thirds natural commitment of Wigley means. Dmcq (talk) 15:56, 22 August 2016 (UTC)
- The reason the zero emissions scenario doesn't warm due to the natural commitment is because the natural commitment wasn't included. The Rummukainen article you reference is not the source of that result. It got that result from Matthews & Weaver (2010)[15] which is a letter to the editor referencing zero emissions results from Eby, M. et al. J. Clim. 22, 2501–2511 (2009) [16]. Eby, et all spun up their models to the year 1800 and then only forced it with CO2 emmission through 2000 holding all the other natural forcings fixed. Here is the relevant quote, emphasis mine:
- "The model was spun up for 10 000 yr with atmospheric carbon dioxide levels and Earth’s orbital configuration specified for the year 1800 and the continental CaCO3 weathering flux diagnosed from the ocean sediment burial flux. The weathering flux was then held fixed while the burial flux of CaCO3 was allowed to evolve with time for all subsequent experiments. Historical emissions were applied until the end of the year 2000. These historical CO2 emissions include contributions from both fossil fuel burning and land use changes. All other transient forcings (insolation, orbital forcing, tropospheric and stratospheric sulfates, and non-CO2 greenhouse gases such as CH4, N2O, and CFCs) were held fixed."
- There can't be any commitment from the 19th and first half of the 20th century naturally forced warming in this experiment because they weren't included. I'm not sure why the model based experiment was designed this way. Poodleboy (talk) 18:51, 22 August 2016 (UTC)
- Holding forcings fixed is not the same as not including them. And I would have thought the fixed refers to in the predictions rather than the historical input. Anyway ignoring that let me get your position right. Are you saying you believe that that some natural forcing was included by Wigley that would in the zero emissions case make the line going upwards go up at about two thirds the rate of the constant composition one? I would like to know what this forcing is but unfortunately I do not have access to the tables of Wigley's paper. Dmcq (talk) 23:05, 22 August 2016 (UTC)
- The reason the zero emissions scenario doesn't warm due to the natural commitment is because the natural commitment wasn't included. The Rummukainen article you reference is not the source of that result. It got that result from Matthews & Weaver (2010)[15] which is a letter to the editor referencing zero emissions results from Eby, M. et al. J. Clim. 22, 2501–2511 (2009) [16]. Eby, et all spun up their models to the year 1800 and then only forced it with CO2 emmission through 2000 holding all the other natural forcings fixed. Here is the relevant quote, emphasis mine:
This thread is a great example of a time when secondary sources are sorely needed. NewsAndEventsGuy (talk) 23:40, 22 August 2016 (UTC)
- Dmcq, the text says historical CO2 emissions were applied. The full text of Wigley's paper was supplied, and it has been cited over 300 times. What do you mean that you don't have access to the tables? NewsAndEventsGuy, there is no indication that a secondary source would have access to better information than we get from these primary sources. This Eby paper doesn't look particularly good, but there is no indication that it conflicts with Wigley.Poodleboy (talk) 00:45, 23 August 2016 (UTC)
- "access to better information" is not why we prefer WP:SECONDARY sources. NewsAndEventsGuy (talk) 02:15, 23 August 2016 (UTC)
- The literature review section of this paper is a secondary source. [17]. Also the tables for Wigley are available in the supplementary data. Follow the tabs at the DOI link. Poodleboy (talk) 09:41, 23 August 2016 (UTC)
- I do not have access to the supplementary data of the paper without paying for it. And there's long list of other things to spend my money on before that. I'll try to rephrase the question about the forcings - do you think the Eby paper omitted the commitment due to natural forcing in the 19th and 20th century? Or how do you square it with Wigley's paper when you see no indication of conflict? Do you think Wigley meant hat two thirds of the temperature rise by 2050 would be due to the natural committment, or else something like for instance that it would go up three times as fast if we didn't have the oceans thermal inertia from the natural commitment of the past stopping it going up? That paper you pointed at about volcanic activity was talking about modelling natural variability rather than just injecting some average natural contribution. I could see very little about Wigley or this problem, what was it you thought was relevant. Dmcq (talk) 11:35, 23 August 2016 (UTC)
- I have access to it without paying, but I have registered with the site for free. The journal Science is important enough that you might want to do that. BTW, the supplementary figures, table and data are ususually available for free. I think Eby did not omit the commitment to natural forcing, but instead eliminated the natural forcing all together. They seemed to assume it would just be transitory anyway. You will find very little about Wigley, because it is accepted/assumed, and mentioned among other publications in the field. Poodleboy (talk) 16:27, 23 August 2016 (UTC)
- It sounds to me then that you might be surprised to learn that generally people think that the natural forcing would currently tend to very slightly reduce the temperature [18]. Which is entirely the wrong direction for what you're saying. Dmcq (talk) 17:39, 23 August 2016 (UTC)
- It wouldn't surprise me if that site were saying that. Have you looked at it skeptically? Poodleboy (talk) 18:09, 23 August 2016 (UTC)
- Actually, it doesn't look like they disagree with Wigley, natural forcings haven't played much of a net role in the last 50 or 60 years. Do you have something specific that you are interpreting otherwise? Keep in mind that reduced levels of a natural cooling forcing like volcanism is a warming forcing, relatively speaking. Poodleboy (talk) 18:16, 23 August 2016 (UTC)
- Let me just try and get this clear. Do you think that Wigley meant that two thirds of any rise in temperature between 2005 and 2050 would be because of a commitment from past natural forcing in the constant composition scenario? And what do you men by if I looked at the figures on that page skeptically - do you mean that those figures are practically completely wrong because of their POV in interpretation of the sources and the main forcing is natural? Dmcq (talk) 18:51, 23 August 2016 (UTC)
- The new anthropogenic CO2, black carbon and other forcings will dominate over the warming due to climate commitment. Wigley's point was that if the composition was kept constant that a majority of the commitment at that time was attributed in his model studies to natural forcing. The natural component is a much lower fraction in the face of increasing emissions and warming. Since the constant composition commitment is about bring the oceans along with the new levels of forcing, that natural component represents a majority of the heat storage into the ocean, and thus of the thermal expansion. Ultimately a warmer ocean also increases the surface temperature, but it is mainly the deep ocean which is being warmed which must adjust. The surface of the ocean responded quicker and so the temperature increase from commitment is small after the initial response.Poodleboy (talk) 20:51, 23 August 2016 (UTC)
- I registered on the site and it is clear from table 1 that what you are saying is how he meant it. Unfortunately it provided no data at all on what he counted as natural forcing compared to anthropogenic and I can't determine how he did that. Where he found a natural component that would lead to greater warming than at any time in thousands of years is beyond me. Dmcq (talk) 23:07, 23 August 2016 (UTC)
- The warming was somewhat less than during the Medieval Warm Period and is only comparable to it with the inclusion of AGW. The commitment has a lot do with with how out of sync the ocean heat is with the level of surface warming. Does the warming before 1950 really greater than at any time in thousands of years? Did I miss something? Poodleboy (talk) 01:56, 24 August 2016 (UTC)
- I don't see the relevance of 1950 but okay I'll talk about it and the Medieval Warm Period. Yes there have been times when the temperature rise has been as great as before 1950. He says that about two thirds of the rise in temperature fro 2005 to 2050 would be due to natural commitment. That would be more in the past, but if you take a third of the temperature rise off from the Little Ice Age to 2005 you already get about the same as the Medieval Warm Period. So what he is saying is that even without any anthropogenic forcing temperatures would rise to greater than the Medieval Warm Period by 2050. At least that is how I read his figures. So you can see why I'd like to know a bit more about this natural commitment he talks about. Dmcq (talk) 09:20, 24 August 2016 (UTC)
- The warming was somewhat less than during the Medieval Warm Period and is only comparable to it with the inclusion of AGW. The commitment has a lot do with with how out of sync the ocean heat is with the level of surface warming. Does the warming before 1950 really greater than at any time in thousands of years? Did I miss something? Poodleboy (talk) 01:56, 24 August 2016 (UTC)
- I registered on the site and it is clear from table 1 that what you are saying is how he meant it. Unfortunately it provided no data at all on what he counted as natural forcing compared to anthropogenic and I can't determine how he did that. Where he found a natural component that would lead to greater warming than at any time in thousands of years is beyond me. Dmcq (talk) 23:07, 23 August 2016 (UTC)
- The new anthropogenic CO2, black carbon and other forcings will dominate over the warming due to climate commitment. Wigley's point was that if the composition was kept constant that a majority of the commitment at that time was attributed in his model studies to natural forcing. The natural component is a much lower fraction in the face of increasing emissions and warming. Since the constant composition commitment is about bring the oceans along with the new levels of forcing, that natural component represents a majority of the heat storage into the ocean, and thus of the thermal expansion. Ultimately a warmer ocean also increases the surface temperature, but it is mainly the deep ocean which is being warmed which must adjust. The surface of the ocean responded quicker and so the temperature increase from commitment is small after the initial response.Poodleboy (talk) 20:51, 23 August 2016 (UTC)
- Let me just try and get this clear. Do you think that Wigley meant that two thirds of any rise in temperature between 2005 and 2050 would be because of a commitment from past natural forcing in the constant composition scenario? And what do you men by if I looked at the figures on that page skeptically - do you mean that those figures are practically completely wrong because of their POV in interpretation of the sources and the main forcing is natural? Dmcq (talk) 18:51, 23 August 2016 (UTC)
- Actually, it doesn't look like they disagree with Wigley, natural forcings haven't played much of a net role in the last 50 or 60 years. Do you have something specific that you are interpreting otherwise? Keep in mind that reduced levels of a natural cooling forcing like volcanism is a warming forcing, relatively speaking. Poodleboy (talk) 18:16, 23 August 2016 (UTC)
- It wouldn't surprise me if that site were saying that. Have you looked at it skeptically? Poodleboy (talk) 18:09, 23 August 2016 (UTC)
- It sounds to me then that you might be surprised to learn that generally people think that the natural forcing would currently tend to very slightly reduce the temperature [18]. Which is entirely the wrong direction for what you're saying. Dmcq (talk) 17:39, 23 August 2016 (UTC)
- I have access to it without paying, but I have registered with the site for free. The journal Science is important enough that you might want to do that. BTW, the supplementary figures, table and data are ususually available for free. I think Eby did not omit the commitment to natural forcing, but instead eliminated the natural forcing all together. They seemed to assume it would just be transitory anyway. You will find very little about Wigley, because it is accepted/assumed, and mentioned among other publications in the field. Poodleboy (talk) 16:27, 23 August 2016 (UTC)
- I do not have access to the supplementary data of the paper without paying for it. And there's long list of other things to spend my money on before that. I'll try to rephrase the question about the forcings - do you think the Eby paper omitted the commitment due to natural forcing in the 19th and 20th century? Or how do you square it with Wigley's paper when you see no indication of conflict? Do you think Wigley meant hat two thirds of the temperature rise by 2050 would be due to the natural committment, or else something like for instance that it would go up three times as fast if we didn't have the oceans thermal inertia from the natural commitment of the past stopping it going up? That paper you pointed at about volcanic activity was talking about modelling natural variability rather than just injecting some average natural contribution. I could see very little about Wigley or this problem, what was it you thought was relevant. Dmcq (talk) 11:35, 23 August 2016 (UTC)
- The literature review section of this paper is a secondary source. [17]. Also the tables for Wigley are available in the supplementary data. Follow the tabs at the DOI link. Poodleboy (talk) 09:41, 23 August 2016 (UTC)
- "access to better information" is not why we prefer WP:SECONDARY sources. NewsAndEventsGuy (talk) 02:15, 23 August 2016 (UTC)
You aren't reading the text or the figures correctly and the MWP was warmer, than the small amount of constant composition commitment warming would reach.Poodleboy (talk) 16:59, 24 August 2016 (UTC)
- It was a quick estimate, I'll say how I did it. Looking at File:2000 Year Temperature Comparison.png the Medieval Warm Period maximum using the red line which is a later estimate is about A = +0.04°C anomaly and the Little Ice Age minimum is B = -0.86 and the 2004 figure C = +0.46. Difference between A and B is 0.90, difference between B and C is 1.32. The paper said only about a third of the change from till 2050 would be anthropogenic but it would increase, so we can take one third as the maximum anthropogenic contribution. Two thirds of 1.32 is 0.88, so even by then it would have about reached the Medieval Warm Period max due to purely natural forcings by 2005. The paper tals about another 0.25 by 2050 with the constant composition, adding that to B gives 1.57 and two thirds of that is 1.05°C which is higher than 0.90°C. Dmcq (talk) 18:39, 24 August 2016 (UTC)
Please take this GENERAL DISUCSSION to usertalk; if participants there ever resolve anything to propose as an article improvement then by all means start a new thread with that idea. NewsAndEventsGuy (talk) 11:52, 24 August 2016 (UTC)
- Okay I'll stop. I don't think anything will suddenly appear now to clear up the matter and the figures would be all different now anyway, for instance as far as I can see estimates of total solar irradiance changes since 1600 have reduced by a large factor from the reference he had. Dmcq (talk) 14:20, 24 August 2016 (UTC)
- Without going into all above, the shift to discussing the Medieval Warm Period and what appear to be suggestions of continuing natural warming seem rather odd. As PAGES2k reaffirmed, the MWP wasn't globally synchronous or well-defined, and the overall natural trend of the last 2,000 years has been long term cooling. This ended in the 20th century with human caused warming, and it is indicated that 1971–2000 was warmer than any other time in nearly 1,400 years. Warming has of course continued since 2000, despite the continuing natural trend declining or at most being neutral. . . dave souza, talk 19:38, 24 August 2016 (UTC)
- Of course, a long term cooling trend would make the MWP warmer than succeeding centuries, and whether it was synchronous or not, the Little Ice age was synchronous:
- "There is no obvious global scale Medieval Climate Anomaly2, 17, although alternate choices for the centre of each bin might allow for better definition of the Medieval Climate Anomaly interval (Supplementary Fig. S5)."
- "Bin-to-bin cooling is especially pronounced for the transition into the 1201–1400 ce and 1401–1600 ce bins (−0.17 and −0.18 s.d. units (100 yr)−1, respectively; Supplementary Table S13), and the overall coldest 200-yr bins are 1401–1600 ce and 1601–1800 ce (−0.70 and −0.71 s.d. units, respectively; Supplementary Table S13). These coldest bin transitions and individual bins are contemporaneous with the onset of the globally coherent Little Ice Age recorded in many Northern and Southern Hemisphere continental regions7, 17, 18, suggesting that there was a global mean ocean SST fingerprint associated with this interval."[19]
- The MWP doesn't have to be globally anomalous to be a peak in global temperature, a significant regional or hemispherical warming anomaly combined with "normal" climate elsewhere will suffice. Poodleboy (talk) 04:50, 25 August 2016 (UTC)
- If this discussion is to continue we really need something relevant to how Wigley derived his figures in table S1 which just has aggregated natural and anthropogenic components. It doesn't look like that is going to happen so we should stop. Plus an observation from that last contribution, it would really help in general if you were clearer about your points and their relevance to the discussion they are in. Dmcq (talk) 10:08, 25 August 2016 (UTC)
- The comments need to be read in sequence in order follow the thread and understand the relevance. Poodleboy (talk) 10:12, 25 August 2016 (UTC)
- Just because you see relevance in your own comments doesn't mean most other people will see it. Try and make things a lot more obvious. Overall it is up to a writer to make things plain, not everyone who reads to struggle to understand. Dmcq (talk) 10:21, 25 August 2016 (UTC)
- I assume you blame Wigley also? Poodleboy (talk) 16:52, 25 August 2016 (UTC)
- I certainly would have liked it if he had been a bit more explicit. He could have included something in the additional data with that table. Dmcq (talk) 18:25, 25 August 2016 (UTC)
- I assume you blame Wigley also? Poodleboy (talk) 16:52, 25 August 2016 (UTC)
- Just because you see relevance in your own comments doesn't mean most other people will see it. Try and make things a lot more obvious. Overall it is up to a writer to make things plain, not everyone who reads to struggle to understand. Dmcq (talk) 10:21, 25 August 2016 (UTC)
- The comments need to be read in sequence in order follow the thread and understand the relevance. Poodleboy (talk) 10:12, 25 August 2016 (UTC)
- If this discussion is to continue we really need something relevant to how Wigley derived his figures in table S1 which just has aggregated natural and anthropogenic components. It doesn't look like that is going to happen so we should stop. Plus an observation from that last contribution, it would really help in general if you were clearer about your points and their relevance to the discussion they are in. Dmcq (talk) 10:08, 25 August 2016 (UTC)
- Of course, a long term cooling trend would make the MWP warmer than succeeding centuries, and whether it was synchronous or not, the Little Ice age was synchronous:
"It's the sun" paper published under fake names retracted
How should we use this? Or is it already being discussed somewhere and I didn't notice? Scientists published climate research under fake names. Then they were caught. NewsAndEventsGuy (talk) 19:13, 19 September 2016 (UTC)
- We should ignore it, because the ideas in it are wrong, and non-notable (notice that the WaPo article doesn't bother discuss the ideas) William M. Connolley (talk) 19:54, 19 September 2016 (UTC)
- Any worthwhile use from the climate denial perspective? NewsAndEventsGuy (talk) 20:09, 19 September 2016 (UTC)
- Someone peer reviewed it and passed it? Amazing. I wouldn't have even thought it worth noting in Global warming controversy.
Anyway would they qualify for List of scientists opposing the mainstream scientific assessment of global warming?No, just looked, they don't seem to have articles about them and are unlikely to get ones either. Dmcq (talk) 20:24, 19 September 2016 (UTC)- They have submitted the paper to another journal. It will probably face enhanced scrutiny there. Evidently Willis Eschenbach, who frequently is a guest poster at wattsupwiththat.com reported the suspected fraud to the journal on September 8th, 4 days earlier than Schmidt's tweet. [20] It has been being dismissed as parameter fitting, but I haven't read the paper myself. Poodleboy (talk) 21:46, 19 September 2016 (UTC)
- Someone peer reviewed it and passed it? Amazing. I wouldn't have even thought it worth noting in Global warming controversy.
what they said about climate change in 1970s
I was browsing global warming and cooling. In the 1970s the concenus of scientists were that we were cooling. Forty years later (forty more data points) the scientists have done a 180 degree turn. Assuming that both time periods had competent mathematicians on board, my work in statistics make me wonder how 40 points of new data could reverse a graph ( of thousands,millions,billions of years of data) so totally and quickly. FMI who were these mathematicians - names please - I would like someone to check their work. 2601:181:8301:4510:BC63:9B9F:F762:859C (talk) 01:45, 3 October 2016 (UTC)
- Please see the FAQ - specifically: Talk:Global_warming/FAQ#Q13. --Kim D. Petersen 07:50, 3 October 2016 (UTC)
Semi-protected edit request on 5 October 2016
This edit request to Global warming has been answered. Set the |answered= or |ans= parameter to no to reactivate your request. |
184.68.180.94 (talk) 17:11, 5 October 2016 (UTC) Global warming isnt real
- Your claim is not supported by reliable sources, nor by reality. Also, our suggestion is a bit vague. --Stephan Schulz (talk) 17:15, 5 October 2016 (UTC)
most of the additional energy stored in the climate system since 1970 has gone into the oceans
Can we get a reference for this statement in the intro?
- Although the increase of near-surface atmospheric temperature is the measure of global warming often reported in the popular press, most of the additional energy stored in the climate system since 1970 has gone into the oceans.
Later in the intro there is this statement:
- The rest is absorbed by vegetation and the oceans.
There are four references listed but none back up the earlier statement. Thanks, Daniel.Cardenas (talk) 20:37, 6 November 2016 (UTC)
- The first sentence about "oceans" in this post is talking about the storage of energy. For a long time the sentence read
- That ref and note supports the statement, I think, and they are still present in the current version as ref #6 and Footnote A. The semicolon in the former version has been removed and now the clauses are sequential but separate sentences. There is a hidden comment (visible to editors in edit mode) which explains that this ref and note are for both sentences.
- The next sentence about "oceans" in this post is talking about the storage of carbon dioxide. So they are discussing different things. Unless someone else gets to it first, I'll look at the sentence The rest is absorbed by vegetation and the oceans and its refs soon, but later.
- NewsAndEventsGuy (talk) 23:54, 6 November 2016 (UTC)
- When you posted this thread the lead text read
- 1. (Later) The NYT and AP refs did not support the statement and I removed them from the lead and body, thanks for pointing that out.
- 2. The hour long audio is too cumbersome to expect anyone to use for verification unless there just isn't anything else so I removed that one from the lead and body too.
- 3. The last RS, was this one from NASA JPL. Please see the first paragraph in that RS and then explain why you think it does not support the statement?
- NewsAndEventsGuy (talk) 13:47, 7 November 2016 (UTC)
- When you posted this thread the lead text read
Footnotes and refs for this section
- ^ Scientific journals use "global warming" to describe an increasing global average temperature just at earth's surface, and most of these authorities further limit "global warming" to such increases caused by human activities or increasing greenhouse gases.
References
- ^ "3: Observations: Ocean" (PDF). IPCC WGI AR5 (Report). 2013. p. 257.
Ocean warming dominates the global energy change inventory. Warming of the ocean accounts for about 93% of the increase in the Earth's energy inventory between 1971 and 2010 (high confidence), with warming of the upper (0 to 700 m) ocean accounting for about 64% of the total. Melting ice (including Arctic sea ice, ice sheets and glaciers) and warming of the continents and atmosphere account for the remainder of the change in energy.
{{cite report}}: Unknown parameter|authors=ignored (help) - ^ Buis, Alan; Ramsayer, Kate; Rasmussen, Carol (12 November 2015). "A Breathing Planet, Off Balance". NASA. Retrieved 13 November 2015.
- ^ Staff (12 November 2015). "Audio (66:01) - NASA News Conference - Carbon & Climate Telecon". NASA. Retrieved 12 November 2015.
- ^ St. Fleur, Nicholas (10 November 2015). "Atmospheric Greenhouse Gas Levels Hit Record, Report Says". New York Times. Retrieved 11 November 2015.
- ^ Ritter, Karl (9 November 2015). "UK: In 1st, global temps average could be 1 degree C higher". AP News. Retrieved 11 November 2015.
New study addition?
Does someone want to add this study? I no longer have access to Science, but feel it's important to add this study to the article, and perhaps to Global warming controversy. — Preceding unsigned comment added by YourAuntEggma (talk • contribs) 02:33, 4 November 2016 (UTC)
- @YourAuntEggma: if you haven't read it, why do you think it would improve anything? NewsAndEventsGuy (talk) 10:56, 4 November 2016 (UTC)
- @NewsAndEventsGuy: I've read the abstract and various articles on it. It's not that I don't know what it's about, but that I wouldn't add a study to Wikipedia without having access to the full article. Otherwise I'd risk misinforming. YourAuntEggma (talk) 04:32, 8 November 2016 (UTC)
scared
if everything melts it would hit south Dakota first .....................169.203.44.33 (talk) 17:37, 17 November 2016 (UTC)
- Cheer up, it's already hit Miami, Boston and Portland, ME. However, that's offtopic for this overview article, so regrettably we have to keep discussions focussed on article improvement. Good luck, anyway. . dave souza, talk 18:19, 17 November 2016 (UTC)
found some weird article that feeds smear campaign of climate change deniers
You might not yet have found this article called The Gore Effect which is basically a code of practice for climate change deniers. The article comes with some criticism of the alleged “joke” – but the main part is original research and a tutorial on how to plant doubts by cherry picking non related events and manipulating statistics. The article comes with a definiton based on a wiki-based dictionary and more doubtful sources. Maybe the community wants to take care of that. --Kontrollinski (talk) 21:58, 22 November 2016 (UTC)
- I do not see what you are seeing. As far as I can see the article complies with Wikipedia guidelines on citations, and NPOV. Dmcq (talk) 23:42, 22 November 2016 (UTC)
Semi-protected edit request on 24 November 2016
This edit request to Global warming has been answered. Set the |answered= or |ans= parameter to no to reactivate your request. |
i have important information that must be added immediate Bob mawrlwy (talk) 15:57, 24 November 2016 (UTC)
- And possibly it might go in if we knew what it was - but you haven't said what the edit you wanted to put in is. Therefore request denied. Dmcq (talk) 16:43, 24 November 2016 (UTC)
Global Warming Summary
- The Earth's temperature is increasing , and breaking the record every year.
- The human activities on planet Earth have a big role in increasing the temperature of the planet surface due to the increase of gas emissions.
- Fossil fuel, coal, and natural gas burning is adding formidable amounts of the greenhouse gases such as Carbon Dioxide into the atmosphere.
- Deforestation has made it difficult to keep the balance of Carbon Dioxide, where plants could exchange CO2 for Oxygen through a process called Photosynthesis.
- The greenhouse gases absorb the heat that the Earth reflects back into the atmosphere, this stops heat from absconding into space and keeps the Earth warm enough to maintain life. With more Carbon Dioxide, Methane, and other gases in the atmosphere, the absorbed heat is more than what the natural level is, thus increasing the Earth's temperature
- The increase of the greenhouse gases in the atmosphere has led to extreme climate changes such as global temperature increase, dangerous events, and sea level rise.
- Solutions are difficult but possible such as renewable energy, cutting down on the use of coal and natural gas, and fighting deforestation. — Preceding unsigned comment added by 50.170.188.29 (talk) 00:18, 23 November 2016 (UTC)
- That's all POV. As such it would fit the article just perfectly. — Preceding unsigned comment added by 82.18.26.37 (talk) 23:30, 7 December 2016 (UTC)
More causes of Global Warming
- Ionospheric heater - system designed to heat a specific part of the atmosphere
- HAARP - capable of transmitting upto 4 GigaWatt of Radiation power into the atmosphere
- EISCAT - capable of transmitting upto 1 GigaWatt of Radiation power into the atmosphere
- Microwave communications (EMF @ 300MHz - 300GHz) - heats molecules in the atmosphere & ocean through Dielectric heating, same way Microwave oven works, except it uses low power, thus needs a longer period to create the same amount of heat.
- mobile devices: 4G, 5G, etc.
- Satellite communications: Satellite Phone, GPS, Satellite Television
- radio communications, radar communications
- Nuclear explosions (including Nuclear tests) - designed to cause damage through recessive heat/EMR, see Effects of nuclear explosions
--Ne0 (talk) 05:21, 12 January 2017 (UTC)
- None of these are in any way significant causes of GW William M. Connolley (talk) 09:54, 12 January 2017 (UTC)
External links modified
Hello fellow Wikipedians,
I have just modified 6 external links on Global warming. Please take a moment to review my edit. If you have any questions, or need the bot to ignore the links, or the page altogether, please visit this simple FaQ for additional information. I made the following changes:
- Added archive https://web.archive.org/web/20051028023600/http://unfccc.int:80/essential_background/convention/background/items/1353.php to http://unfccc.int/essential_background/convention/background/items/1353.php
- Replaced archive link https://web.archive.org/web/20160801074432/https://www.theguardian.com/environment/2015/dec/12/paris-climate-deal-key-points with https://web.archive.org/web/20151213005658/http://www.theguardian.com/environment/2015/dec/12/paris-climate-deal-key-points on https://www.theguardian.com/environment/2015/dec/12/paris-climate-deal-key-points
- Added archive https://web.archive.org/web/20130504113820/http://www.climatescience.gov/Library/sap/sap3-4/final-report/default.htm to http://www.climatescience.gov/Library/sap/sap3-4/final-report/default.htm
- Added archive https://web.archive.org/web/20051028023600/http://unfccc.int:80/essential_background/convention/background/items/1353.php to http://unfccc.int/essential_background/convention/background/items/1353.php
- Added archive https://web.archive.org/web/20141127222605/http://www.ipcc.ch/report/ar5/wg3/ to http://www.ipcc.ch/report/ar5/wg3/
- Added archive https://web.archive.org/web/20140327000317/http://www.nap.edu/catalog.php?record_id=12877 to http://www.nap.edu/catalog.php?record_id=12877
When you have finished reviewing my changes, you may follow the instructions on the template below to fix any issues with the URLs.
This message was posted before February 2018. After February 2018, "External links modified" talk page sections are no longer generated or monitored by InternetArchiveBot. No special action is required regarding these talk page notices, other than regular verification using the archive tool instructions below. Editors have permission to delete these "External links modified" talk page sections if they want to de-clutter talk pages, but see the RfC before doing mass systematic removals. This message is updated dynamically through the template {{source check}} (last update: 5 June 2024).
- If you have discovered URLs which were erroneously considered dead by the bot, you can report them with this tool.
- If you found an error with any archives or the URLs themselves, you can fix them with this tool.
Cheers.—InternetArchiveBot (Report bug) 04:01, 13 January 2017 (UTC)
Section 1.2 Warmest Years
In section 1.2 Warmest Years, it is stated that 15 of the 16 warmest years have occurred since 2000. This only goes through 2015. If a reliable source has come out with where 2016 fell temperature-wise, it might be useful to update this section to include 2016, stating that 16 of the 17 warmest years have occurred since 2000. I believe 2016 broke the record set in 2015, for warmest year on record. 2016's record was also affected by the 2015-16 Strong El Nino event, as 2015 was. (JasonPhelps (talk) 22:44, 12 January 2017 (UTC)).
- Being only slightly into 2017, it is possible that data for 2016 has not yet been fully analyzed for various relevant sources, such as ocean temperature, surface temps, atmosphere temps, remote sensing data sources, etc. --OuroborosCobra (talk) 22:56, 12 January 2017 (UTC)
- As OC says the official stats are not out yet. We can afford to wait a few weeks. For a preview of what to expect see here, at "Year-to-date (January–November)". Shock Brigade Harvester Boris (talk) 03:13, 14 January 2017 (UTC)
- Thank you for the link! Yes, it looks like December 2016 is not quite up yet. So, probably have to wait a few weeks to get 2016. JasonPhelps (talk) 04:54, 14 January 2017 (UTC)
- And now it's official.[21] Shock Brigade Harvester Boris (talk) 00:55, 19 January 2017 (UTC)
- Thank you for the link! Yes, it looks like December 2016 is not quite up yet. So, probably have to wait a few weeks to get 2016. JasonPhelps (talk) 04:54, 14 January 2017 (UTC)
- As OC says the official stats are not out yet. We can afford to wait a few weeks. For a preview of what to expect see here, at "Year-to-date (January–November)". Shock Brigade Harvester Boris (talk) 03:13, 14 January 2017 (UTC)
Hatnote
The hatnote must say "Anthropogenic climate change redirects here", otherwise the "also" doesn't make sense. 184.101.248.50 (talk) 14:10, 19 January 2017 (UTC)
Phrasing for the conclusions
The article lead has 'reported in 2014 that it found, with a degree of certainty greater than 95%, that human influence has been the cause of more than half of the observed warming since 1951' in it. I think there is a bit of a problem with this but I'm not sure exactly how to resolve the problem. The implication is that human influence is a bit more than half whereas that is not is really being said. There are various percentages of scientists who say various amounts or don't want to commit themselves. A best guess mode average think that human influence causes on it is about 100% - this is possible because many think the natural effects may be acting in opposition to human influence as well as a number of others thinking it adds to human influence. The 95% is measuring something the readers are not so strongly interested in, many wouldn't really notice if the figure had been 99% or 90% which would lead to quite different amounts on the 50% side. Dmcq (talk) 17:55, 29 January 2017 (UTC)
- AR5 SPM says "The best estimate of the human-induced contribution to warming is similar to the observed warming over this period" (i.e., 1951-2010). So, yeah. Shock Brigade Harvester Boris (talk) 18:01, 29 January 2017 (UTC)
- Shock Brigade Harvester Boris Great example why SPM is not a good source. The term "similar" is not defined anywhere in the SPM and you apparently interpreted that to mean that virtually all the warming is human induced. But if you read the actual report, you would see that's not what it says and not what it means. The actual report says (in bold to indicate that it is a finding of the IPCC) "It is extremely likely that more than half of the observed increase in global average surface temperature from 1951 to 2010 was caused by the anthropogenic increase in GHG concentrations and other anthropogenic forcings together (Figure 1.9)." "Extremely likely" is defined to mean 95%-100% likely and "more than half" means greater than 50%. Very clear, scientific, and correct. --TheClarinetGuy talk 20:25, 29 January 2017 (UTC)
- The citation provided from the actual report as opposed to the SPM, which is not a reliable source, states "It is extremely likely that more than half of the observed increase in global average surface temperature from 1951 to 2010 was caused by the anthropogenic increase in GHG concentrations and other anthropogenic forcings together (Figure 1.9)." And "extremely likely" is defined in the actual report to mean 95-100%. Very clear. --TheClarinetGuy talk 18:05, 29 January 2017 (UTC)
- AR5 SPM is not a reliable source? Seriously? Shock Brigade Harvester Boris (talk) 18:10, 29 January 2017 (UTC)
- Yes, it is a summary and therefore can lead to misinterpretations as evidenced here. The actual report itself is available and totally explicit and carefully worded by actual scientists. --TheClarinetGuy talk 18:32, 29 January 2017 (UTC)
- Interesting perspective. I'll bring this up on the reliable sources noticeboard. Shock Brigade Harvester Boris (talk) 18:36, 29 January 2017 (UTC)
- The principle of best evidence in a scientific matter would always dictate that you go to the actual language of the scientific report and not to a summary written specifically for the benefit of non-scientific policy makers. --TheClarinetGuy talk 18:40, 29 January 2017 (UTC)
- The lead of articles in Wikipedia should be as accessible as possible and precise details put further down if included. Saying what is there would not be misinterpreted by most people is simply wrong, it is details for scientists not the general public. What is there is not clear and accessible. The summary for policymakers is aimed more at the general public. See the second paragraph of WP:LEAD for guidance on this.Dmcq (talk) 18:44, 29 January 2017 (UTC)
- Yes, but I thought we were talking about the citation here. As I pointed out already the language that was there previously did not accurately reflect what the actual report says. And there is no point in citing the summary when you can cite the actual report. --TheClarinetGuy talk 18:51, 29 January 2017 (UTC)
- What was there before was accurate, it just wasn't as accurate at copying what was written as what you wrote. Instead of giving the meaning you copied the words. You sacrificed clarity for accuracy. Dmcq (talk) 20:23, 29 January 2017 (UTC)
- No it was not accurate. Words have meaning. For example, previously it said that the IPCC reported that "scientists were more than 95% certain". That is inaccurate. The IPCC reported that it found a degree of certainty of 95% or more, not "scientists" in general. And "degree of certainty" again is a defined scientific term in the report. Huge difference. Furthermore, before my edit it said "is mostly being caused by..." again that is misleading. "Mostly" can be interpreted to mean many things, indeed most people (editors here in evidence) take that to mean "virtually all". The IPCC found that more than half (i.e. 51% or more) of warming since 1951 was 95% or more likely to be human caused. That's a very different statement again. --TheClarinetGuy talk 21:47, 29 January 2017 (UTC)
- That is just pettifogging and has nothing to do with the point that your change obscures because it uses unsuitable language for a widely viewed page rather than simple language. Dmcq (talk) 22:00, 29 January 2017 (UTC)
- What language is "unsuitable"? The language I used is clear, simple, understandable and accurate. The language there before was incorrect. Indeed it is you who are pettifogging. --TheClarinetGuy talk 23:12, 29 January 2017 (UTC)
- That is just pettifogging and has nothing to do with the point that your change obscures because it uses unsuitable language for a widely viewed page rather than simple language. Dmcq (talk) 22:00, 29 January 2017 (UTC)
- No it was not accurate. Words have meaning. For example, previously it said that the IPCC reported that "scientists were more than 95% certain". That is inaccurate. The IPCC reported that it found a degree of certainty of 95% or more, not "scientists" in general. And "degree of certainty" again is a defined scientific term in the report. Huge difference. Furthermore, before my edit it said "is mostly being caused by..." again that is misleading. "Mostly" can be interpreted to mean many things, indeed most people (editors here in evidence) take that to mean "virtually all". The IPCC found that more than half (i.e. 51% or more) of warming since 1951 was 95% or more likely to be human caused. That's a very different statement again. --TheClarinetGuy talk 21:47, 29 January 2017 (UTC)
- What was there before was accurate, it just wasn't as accurate at copying what was written as what you wrote. Instead of giving the meaning you copied the words. You sacrificed clarity for accuracy. Dmcq (talk) 20:23, 29 January 2017 (UTC)
- The principle of best evidence in a scientific matter would always dictate that you go to the actual language of the scientific report and not to a summary written specifically for the benefit of non-scientific policy makers. --TheClarinetGuy talk 18:40, 29 January 2017 (UTC)
- Interesting perspective. I'll bring this up on the reliable sources noticeboard. Shock Brigade Harvester Boris (talk) 18:36, 29 January 2017 (UTC)
- Yes, it is a summary and therefore can lead to misinterpretations as evidenced here. The actual report itself is available and totally explicit and carefully worded by actual scientists. --TheClarinetGuy talk 18:32, 29 January 2017 (UTC)
- AR5 SPM is not a reliable source? Seriously? Shock Brigade Harvester Boris (talk) 18:10, 29 January 2017 (UTC)
So what is wrong with using the quote from SPM and backing it up with both the SPM and fig 10.5 from chapter 10 of WG1 main report? That surely support that it is similar and not halfish. (If we were to insist on a quote from chapter 10 then there is within 10.9 "These results strengthen the conclusion that human influence on climate has played the dominant role in observed warming since the 1950s.") crandles (talk) 23:10, 29 January 2017 (UTC)
- The appropriate citation is the one I have given which is from 1.3.1 Attribution of climate changes to human and natural influences on the climate system. It says "more than half" which is very simple English understood by even young children. and it says "from 1951" also simple, factual, and the actual finding of the scientists not a twisted and spun version saying "dominant" and "mostly" and other words which have other meanings. Words matter. Scientists know that. That's why they choose them carefully. Is your objective to obscure the actual science here or to summarize it? --TheClarinetGuy talk 23:19, 29 January 2017 (UTC)
- Have you looked at figure 10.5 of the main report. What is not similar about that comparison? crandles (talk) 23:30, 29 January 2017 (UTC)
- Figure 10.5 in which report? That's not in SYR_AR5_FINAL_full_wcover.pdf. --TheClarinetGuy talk 23:38, 29 January 2017 (UTC)
- If it is so simple are you going to tell be how it would change if the confidence interval was 90% or 99% which was the problem being asked about here? crandles (talk) 23:33, 29 January 2017 (UTC)
- I don't understand your question. The IPCC found with 95% certainty that more than half of the warming is anthropogenic. That's what the report says. There is nothing complicated about it. What was there before was more complicated and untrue. --TheClarinetGuy talk 23:38, 29 January 2017 (UTC)
- I think the statement from the summary for policymakers should be used as a basis for what is in the lead and all the overly technical jargon that has just been inserted should be removed. Dmcq (talk) 23:45, 29 January 2017 (UTC)
- No technical jargon of any kind was added. What was technical jargon? Be specific. If you don't like 95% certain (which was there from before), then you could say "extremely likely". --TheClarinetGuy talk 23:48, 29 January 2017 (UTC)
- Have you looked at figure 10.5 of the main report. What is not similar about that comparison? crandles (talk) 23:30, 29 January 2017 (UTC)
Copying percentages from the body of the report, to overwrite the carefully chosen words of the summary for policymakers, makes the text harder to follow, and unnecessarily technical, especially in this encyclopedic summary. I agree with the revert. --Nigelj (talk) 23:57, 29 January 2017 (UTC)
- I've put in a bit I hope paraphrases what the summary says on this point. Dmcq (talk) 00:01, 30 January 2017 (UTC)
- "their best estimate is that all of it, is caused by human..." are you kidding? It doesn't say anything like that anywhere in the report. Why are you putting such a blatantly false statement in there? --TheClarinetGuy talk 00:16, 30 January 2017 (UTC)
- You obviously haven't looked at fig 10.5 from chapter 10 for WG1 report and don't understand what we are talking about.crandles (talk) 00:27, 30 January 2017 (UTC)
- "their best estimate is that all of it, is caused by human..." are you kidding? It doesn't say anything like that anywhere in the report. Why are you putting such a blatantly false statement in there? --TheClarinetGuy talk 00:16, 30 January 2017 (UTC)
- There is something contradictory (grammatically) with the following statement: "The Intergovernmental Panel on Climate Change (IPCC) reported in 2014 that it was extremely likely that at least half the global warming, and their best estimate is that all of it, is caused by human (anthropogenic) activities, mainly increasing concentrations of greenhouse gases ".
- Is something like the following is meant? <The Intergovernmental Panel on Climate Change (IPCC) reported in 2014 that it felt that while it is extremely likely that all global warming is caused by human (anthropogenic) activities, mainly increasing concentrations of greenhouse gases such as methane and carbon dioxide (CO2), that most certainly at least half of it is>. Rwood128 (talk) 01:38, 30 January 2017 (UTC)
- C-randles Ok, now I have looked at 10.5 from WG1 but that absolutely does not in any way justify the statement "their best estimate is that all of it , is caused by human..."! You clearly do not understand what that graph says or means. The bar graphs are simply midpoints of ranges and are in no way "best estimates". Indeed, the text on page 60 just before this graph states once again, "It is extremely likely that human activities caused more than half of the observed increase in global average surface temperature from 1951 to 2010." That is the correct statement that the science supports, and that is what the scientists said! What you have written here now on the page is made up nonsense by someone who doesn't understand or know how to read the science. You can't simply make stuff up. And combining multiple imprecise estimations with multiple levels of confidence is not a simple task, which is why the scientists who wrote the report did careful explanations of what they determined. They were very clear. What is written on the page here now is patently false. --TheClarinetGuy talk 03:38, 30 January 2017 (UTC)
- Dmcq Please revert your edit that makes the patently false statement "their best estimate is that all of it, is caused by human.." as this is supported nowhere in the IPCC. Your misreading of a graph or a statement from the SPM does not justify it. If necessary, I will take it to the appropriate noticeboard for further comment. --TheClarinetGuy talk 03:48, 30 January 2017 (UTC)
- Please do so. I think it would be worth getting broader input on this matter. Shock Brigade Harvester Boris (talk) 03:58, 30 January 2017 (UTC)
- Is that please do so directed at Dmcq to revert the edit or to me to bring it to a noticeboard? If directed at me, which noticeboard do you think I should go to? --TheClarinetGuy talk 04:53, 30 January 2017 (UTC)
- Directed to you (it was immediately below your comment and one level further indented). As for which noticeboard -- hmmm, it's not really a question of sourcing so I think WP:RSN is out. If you believe there's a question of misconduct it would get plenty of attention at WP:ANI. Shock Brigade Harvester Boris (talk) 04:58, 30 January 2017 (UTC)
- Will do. But isn't it also a question of sourcing in that Dmcq is claiming the cited sources say something they absolutely do not? Are there any other places? --TheClarinetGuy talk 05:09, 30 January 2017 (UTC)
- The second citation says:
- "The evidence for human influence on the climate system has grown since the IPCC Fourth Assessment Report (AR4). It is extremely likely that more than half of the observed increase in global average surface temperature from 1951 to 2010 was caused by the anthropogenic increase in GHG concentrations and other anthropogenic forcings together. The best estimate of the human-induced contribution to warming is similar to the observed warming over this period (Figure SPM.3)"
- I put in
- ". The Intergovernmental Panel on Climate Change (IPCC) reported in 2014 that it was extremely likely that at least half the global warming, and their best estimate is that all of it, is caused by human (anthropogenic) activities"
- I think they corresponds quite closely. I can only think your idea of 'absolutely does not support' is similar to your notion in the previous discussion that the APS statement about climate change disputes what the IPCC says. And it certainly is close enough for a WP:LEAD statement that is supposed to be generally accessible. Dmcq (talk) 09:33, 30 January 2017 (UTC)
- The second citation says:
- Will do. But isn't it also a question of sourcing in that Dmcq is claiming the cited sources say something they absolutely do not? Are there any other places? --TheClarinetGuy talk 05:09, 30 January 2017 (UTC)
- Directed to you (it was immediately below your comment and one level further indented). As for which noticeboard -- hmmm, it's not really a question of sourcing so I think WP:RSN is out. If you believe there's a question of misconduct it would get plenty of attention at WP:ANI. Shock Brigade Harvester Boris (talk) 04:58, 30 January 2017 (UTC)
- Is that please do so directed at Dmcq to revert the edit or to me to bring it to a noticeboard? If directed at me, which noticeboard do you think I should go to? --TheClarinetGuy talk 04:53, 30 January 2017 (UTC)
- Please do so. I think it would be worth getting broader input on this matter. Shock Brigade Harvester Boris (talk) 03:58, 30 January 2017 (UTC)
To my mind, this sentence – "The Intergovernmental Panel on Climate Change (IPCC) reported in 2014 that it was extremely likely that at least half the global warming, and their best estimate is that all of it, is caused by human (anthropogenic) activities, mainly increasing concentrations of greenhouse gases " - ls grammatically unsound and so confusing.
Does the following clarify what the report actually said – that is improve the sentence structure: <The United Nations Intergovernmental Panel on Climate Change (IPCC) reported in 2014 that the nearly all scientists believed that global warming was occurring, and that while most of them felt that it is extremely likely that it is caused by human (anthropogenic) activities, mainly increasing concentrations of greenhouse gases such as methane and carbon dioxide (CO2), some?/a few?/ of them only believed that just half was caused by human activities>.— Preceding unsigned comment added by Rwood128 (talk • contribs) 10:25, 30 January 2017 (UTC)
I reverted "more than half" back to "most" on basis of abundant debate, off an on, since Sept 2011. My revert produced this version. Type "more than half" (including quotes) in the talk page archives to see the same threads I saw. NewsAndEventsGuy (talk) 11:25, 30 January 2017 (UTC)
- A clearer statement is made in the coloured box at SPM 1.2 Causes of climate change: greenhouse gas "effects, together with those of other anthropogenic drivers, have been detected throughout the climate system and are extremely likely to have been the dominant cause of the observed warming since the mid-20th century."
Propose "The Intergovernmental Panel on Climate Change (IPCC) reported in 2014 that it was extremely likely that human (anthropogenic) activities, mainly increasing concentrations of greenhouse gases, are the dominant cause of global warming, and their best estimate was that the net effect of human activities was about equal to, or greater than, the observed warming, with natural forcings and natural internal variability having little net effect." . . dave souza, talk 11:07, 30 January 2017 (UTC) - Or, slightly tweaked, propose "The Intergovernmental Panel on Climate Change (IPCC) reported in 2014 that it was extremely likely that global warming is predominantly caused by human (anthropogenic) activities, mainly increasing concentrations of greenhouse gases, and their best estimate was that the net effect of human activities was about equal to, or greater than, the observed warming, with natural forcings and natural internal variability having little net effect." . . . dave souza, talk 11:12, 30 January 2017 (UTC)
- Sorry dave souza your suggested revision crossed with my comment below. Isn't this perhaps a little longwinded. I find this to be generally true for this lede. Rwood128 (talk) 11:44, 30 January 2017 (UTC)
- Not if it prevents endless debate by succinctly summarzing the major nuances. NewsAndEventsGuy (talk) 11:58, 30 January 2017 (UTC)
- I think what you put in is much worse than what I had. It concentrates attention on the 95% which isn't that important and pairs it with 'most' and doesn't give the best estimate. The lead is supposed to be accessible and percentage chances isn't the sort of thing which helps with that. Is your main problem with what I put in that you think it was ungrammatical? It is quite easy to split it into two sentences. Dmcq (talk) 12:13, 30 January 2017 (UTC)
- Not if it prevents endless debate by succinctly summarzing the major nuances. NewsAndEventsGuy (talk) 11:58, 30 January 2017 (UTC)
- Sorry dave souza your suggested revision crossed with my comment below. Isn't this perhaps a little longwinded. I find this to be generally true for this lede. Rwood128 (talk) 11:44, 30 January 2017 (UTC)
though a few believed
Thanks NewsAndEventsGuy. But where does this confusing statement, "it was extremely likely that at least half the global warming", come from in the report? Wouldn't it be more accurate to deal with it, even if only few scientists support this position? I suggest revising to read: <The United Nations Intergovernmental Panel on Climate Change (IPCC) reported in 2014 that scientists were more than 95% certain that global warming is mostly being caused by human (anthropogenic) activities, mainly increasing concentrations of greenhouse gases such as methane and carbon dioxide (CO2), though a few of them only believed that just half was caused by human activities>.Rwood128 (talk) 11:19, 30 January 2017 (UTC)
- Re sentence 1, see the existing reference footnote 10. Re the rest, We don't edit based on "even if" NewsAndEventsGuy (talk) 11:35, 30 January 2017 (UTC)
- I think you (Rwood) might be misunderstanding the IPCC (which uses a consensus process) and its conclusions. The IPCC AR 5 and its SPM are quite explicit. It is extremely likely that most of the warming is caused by anthropogenic factors (there is a very very low chance that it is half or less). And the best estimate for the anthropogenic influence is that it causes all of the warming. That is a different statement that is fully consistent with the first. If I throw a coin 100 times, and it comes 80 heads/20 tails, then it is extremely likely (though not, strictly, proven) that the coin is biased. My best estimate of the bias is that the probability of heads is 80%. Nowhere does the number of people who believe one statement or the other come into play. --Stephan Schulz (talk) 11:40, 30 January 2017 (UTC)
housekeeping note - I am uncertain how the WP:THREAD would ideally be done, but the following is all subsequent to the prior discussion in this subsection NewsAndEventsGuy (talk) 18:13, 30 January 2017 (UTC)
- Rwood128 Re your question about the "confusing statement":
- Page 60 of WG1, 2nd paragraph of TS.4.2 Surface Temperature: "It is extremely likely that human activities caused more than half of the observed increase in global average surface temperature from 1951 to 2010."
- Page 66 of WG1, 1st paragraph "Consistent with AR4, it is assessed that more than half of the observed increase in global average surface temperature from 1951 to 2010 is very likely due to the observed anthropogenic increase in WMGHG concentrations."
- Page 5 of Summary for Policy Makers: "It is extremely likely that more than half of the observed increase in global average surface temperature from 1951 to 2010 was caused by the anthropogenic increase in GHG concentrations and other anthropogenic forcings together."
- Page 48 of Synthesis Report bold faced finding at 1.3.1 Attribution of climate changes to human and natural influences on the climate system: "It is extremely likely that more than half of the observed increase in global average surface temperature from 1951 to 2010 was caused by the anthropogenic increase in GHG concentrations and other anthropogenic forcings together (Figure 1.9)." [no emphasis added]
- --TheClarinetGuy talk 13:55, 30 January 2017 (UTC)
- Stephan Schulz any confusion was caused by the wording of the sentence in question. I haven't read the report and am not an expert on this topic. Clearly most scientists believe that there is global warming and that people cause it, though there are a few dissenters, and also a few who believe that non-human factors contribute to up to half of global warming. That is what I believed that the original sentence was trying to say. But the current version is a great improvement on the earlier muddled sentence. Rwood128 (talk) 12:09, 30 January 2017 (UTC)
- The current sentence does not give their best estimate. It over-emphasizes 95% which most people won't have an intuitive grasp of and pairs that 'accurate' figure with the vague 'most'. We should just try and summarize in the lead as clearly as possible for non-technical people what is being said, and I think the summary for policymakers is a good basis for that. Dmcq (talk) 12:25, 30 January 2017 (UTC)
- Maybe we can turn things on their head and lead with the best estimate? The 2014 IPCC Fifth Assessment Report states the best estimate is that anthropgenic influences are responsible for approximately all of the observed temperature change, and that it is more than 95% certain that most of the warming is caused by human activities, in particular the release of greenhouse gases such as methane and CO2? --Stephan Schulz (talk) 12:34, 30 January 2017 (UTC)
- The current sentence does not give their best estimate. It over-emphasizes 95% which most people won't have an intuitive grasp of and pairs that 'accurate' figure with the vague 'most'. We should just try and summarize in the lead as clearly as possible for non-technical people what is being said, and I think the summary for policymakers is a good basis for that. Dmcq (talk) 12:25, 30 January 2017 (UTC)
- Sounds reasonable. Rwood128 (talk) 12:38, 30 January 2017 (UTC)
- Still a bit convoluted, so clearer with two sentences: "The 2014 IPCC Fifth Assessment Report states that it is extremely likely that human activities are the dominant cause of global warming. Its best estimate is that anthropgenic influences are responsible for approximately all of the observed temperature change, and it is more than 95% certain that most of the warming is caused by human activities, in particular the release of greenhouse gases such as methane and CO2" – dave souza, talk 12:48, 30 January 2017 (UTC)
- This is a false statement. The report does not say that anywhere either in the SPM or in the body of the report. Here's what WG1 says verbatim on pages 60, 66 (61 to 65 have intervening sidebars): "Uncertainties in forcings and in climate models’ responses to those forcings, together with difficulty in distinguishing the patterns of temperature response due to WMGHGs and other anthropogenic forcings, prevent as precise a quantification of the temperature changes attributable to WMGHGs and other anthropogenic forcings individually. Consistent with AR4, it is assessed that more than half of the observed increase in global average surface temperature from 1951 to 2010 is very likely due to the observed anthropogenic increase in WMGHG concentrations." [emphasis added] Nowhere in the report or summary does it say "our best estimate is that anthropogenic influences are responsible for approximately all of the observed temperature change". --TheClarinetGuy talk 13:34, 30 January 2017 (UTC)
- As I wrote over at WP:RSN, the IPCC AR5 SPM, page 17, section D3, last sentence of the first bullet point under the coloured box says "The best estimate of the human-induced contribution to warming is similar to the observed warming over this period" and the next bullet point quantifies the other contributions as "likely to be in the range of −0.1°C to 0.1°C" from natural forcings and "likely to be in the range of −0.1°C to 0.1°C" from internal variability. Uncertainties affect the size of the error bars, not the best estimate. See above - the two statements are not conflicting, but deal with different properties. --Stephan Schulz (talk) 13:43, 30 January 2017 (UTC)
- @Stephan Schulz: Yes, it says "similar to" not "equal to" and those individual numbers are only assessed as likely, i.e. with 66% or more confidence, and the report goes on to say "Together these assessed contributions are consistent with the observed warming of 0.6ºC to 0.7ºC over this period." Again "consistent with" is not the same as "equal to". And in the WG1 at p66, it says, "Uncertainties in forcings and in climate models’ responses to those forcings, together with difficulty in distinguishing the patterns of temperature response due to WMGHGs and other anthropogenic forcings, prevent as precise a quantification of the temperature changes attributable to WMGHGs and other anthropogenic forcings individually. Consistent with AR4, it is assessed that more than half of the observed increase in global average surface temperature from 1951 to 2010 is very likely due to the observed anthropogenic increase in WMGHG concentrations." [emphasis added] --TheClarinetGuy talk 14:05, 30 January 2017 (UTC)
- The IPCC makes two different statements - one on the expected value of anthropogenic temperature change, and a different one on the certainty with which they can assign at least half of the observed warming to human influences. If I throw a normal, six-sided die, the expected value is 3.5 (although the probability for that value coming up is actually zero), and the probability that the result is at least 4 ist 50%. Those are both useful and important things to know if you gamble. We can of course keep debating on what the meaning of "is" is. But the fact that the IPCC makes statements on the probability of "most warming" that you like to emphasise is very much irrelevant to the question of the best estimate. --Stephan Schulz (talk) 14:26, 30 January 2017 (UTC)
- @Stephan Schulz: Yes, it says "similar to" not "equal to" and those individual numbers are only assessed as likely, i.e. with 66% or more confidence, and the report goes on to say "Together these assessed contributions are consistent with the observed warming of 0.6ºC to 0.7ºC over this period." Again "consistent with" is not the same as "equal to". And in the WG1 at p66, it says, "Uncertainties in forcings and in climate models’ responses to those forcings, together with difficulty in distinguishing the patterns of temperature response due to WMGHGs and other anthropogenic forcings, prevent as precise a quantification of the temperature changes attributable to WMGHGs and other anthropogenic forcings individually. Consistent with AR4, it is assessed that more than half of the observed increase in global average surface temperature from 1951 to 2010 is very likely due to the observed anthropogenic increase in WMGHG concentrations." [emphasis added] --TheClarinetGuy talk 14:05, 30 January 2017 (UTC)
- As I wrote over at WP:RSN, the IPCC AR5 SPM, page 17, section D3, last sentence of the first bullet point under the coloured box says "The best estimate of the human-induced contribution to warming is similar to the observed warming over this period" and the next bullet point quantifies the other contributions as "likely to be in the range of −0.1°C to 0.1°C" from natural forcings and "likely to be in the range of −0.1°C to 0.1°C" from internal variability. Uncertainties affect the size of the error bars, not the best estimate. See above - the two statements are not conflicting, but deal with different properties. --Stephan Schulz (talk) 13:43, 30 January 2017 (UTC)
- This is a false statement. The report does not say that anywhere either in the SPM or in the body of the report. Here's what WG1 says verbatim on pages 60, 66 (61 to 65 have intervening sidebars): "Uncertainties in forcings and in climate models’ responses to those forcings, together with difficulty in distinguishing the patterns of temperature response due to WMGHGs and other anthropogenic forcings, prevent as precise a quantification of the temperature changes attributable to WMGHGs and other anthropogenic forcings individually. Consistent with AR4, it is assessed that more than half of the observed increase in global average surface temperature from 1951 to 2010 is very likely due to the observed anthropogenic increase in WMGHG concentrations." [emphasis added] Nowhere in the report or summary does it say "our best estimate is that anthropogenic influences are responsible for approximately all of the observed temperature change". --TheClarinetGuy talk 13:34, 30 January 2017 (UTC)
TheClarinetGuy talk are you claiming that nothing close to the statement "it is more than 95% certain that most of the warming is caused by human activities," appears anywhere in this report? Or is it that the report suggest that the statistical probability is close to 100% ("extremely likely") that human activity is responsible for more than half of global warming and that it is a little less probable, statistically, that the cause is 95% certain?
My comments are of course based on the second hand comments and quotations given in this discussion, not the original text. Also this was written before the last two highly technical comments.
Perhaps it should read <it is most probable that more than half of global warming is caused by human activities, and it could be as high as 95%>. Rwood128 (talk) 14:24, 30 January 2017 (UTC)
- Rwood128 Yes, no such statement appears anywhere in the report. The scientists on the IPCC developed a precise terminology for their statements. The statements they made are listed above in this conversation in my response to
NewsAndEventsGuyyou. --TheClarinetGuy talk 14:29, 30 January 2017 (UTC)
I like Dave Souza version but it runs on a bit so it is unclear whether 95% is re all anthro or the ghgs, so I would suggest more sentences, also why not use exact words of SPM, perhaps: "The 2014 IPCC Fifth Assessment Report states that it is extremely likely that human activities are the dominant cause of the observed warming since the mid-20th century.(ref SPM p17) Its best estimate of the human-induced contribution to warming is similar to the observed warming over this period,(ref SPM p17, fig 10.5) and it is more than 95% certain that most of the warming is caused by human activities.(ref WG1 Ch10.3-10.6, 10.9) The release of greenhouse gases such as methane and CO2 being considered the largest positive contribution while other anthropogenic effects include cooling effects of aerosols; these are considered larger than natural forcings and internal variability over this period.(ref SPM p17)" crandles (talk) 14:34, 30 January 2017 (UTC)
- We're talking about the lead which is supposed to be an accessible summary of the article. Less is more in such a context. We don't have to have everything fully complete otherwise we'd be writing the article in the lead. That's not quite as bad as some people who I've seen want to write an article into its title but its on the same lines. It just has to be a good reasonable summary. And it doesn't have to follow just the IPCC. Dmcq (talk) 14:52, 30 January 2017 (UTC)
- So crandles, TheClarinetGuy talk is wrong and something like "it is more than 95% certain that most of the warming is caused by human activities," does appear in the report?
- Can someone answer my query, above, re statistics and "more than half" versus 95%.
- chapter 10 is here it does include "It is extremely likely that human activities caused more than half of the observed increase in GMST from 1951 to 2010" and if you don't understand that both this and "The best estimate of the human-induced contribution to warming is similar to the observed warming over this period" can be consistent then please consider whether you are really helping. crandles (talk) 15:21, 30 January 2017 (UTC)
- I strongly agree with Dmcq that the lede should be "an accessible summary of the article". Rwood128 (talk) 14:56, 30 January 2017 (UTC)
- Agree that is too long. Can be cut down quite a bit perhaps "The 2014 IPCC Fifth Assessment Report's best estimate of the human-induced contribution to warming is similar to the observed warming since the mid-20th century,(ref SPM p17, fig 10.5) and it is more than 95% certain that most of the warming is caused by human activities.(ref WG1 Ch10.3-10.6, 10.9) The release of greenhouse gases such as methane and CO2 being considered the largest positive contribution.(ref SPM p17)" crandles (talk) 15:05, 30 January 2017 (UTC)
- Looks fine to me. Rwood128, several people have quoted parts of the report. I suggest you take a look at the IPCC AR5 Summary for Policymakers, the most condensed version of the AR5, and don't rely on selective second-hand quotes. --Stephan Schulz (talk) 15:24, 30 January 2017 (UTC)
- From that IPC AR5 summary, page 17; D.3 Detection and Attribution of Climate Change summarises the issue in a coloured box, the last sentence of which is "It is extremely likely that human influence has been the dominant cause of the observed warming since the mid-20th century." That's it in a nutshell, with no need for reference to similarity or 95% certainty. . dave souza, talk 16:41, 30 January 2017 (UTC)
- Agree that is too long. Can be cut down quite a bit perhaps "The 2014 IPCC Fifth Assessment Report's best estimate of the human-induced contribution to warming is similar to the observed warming since the mid-20th century,(ref SPM p17, fig 10.5) and it is more than 95% certain that most of the warming is caused by human activities.(ref WG1 Ch10.3-10.6, 10.9) The release of greenhouse gases such as methane and CO2 being considered the largest positive contribution.(ref SPM p17)" crandles (talk) 15:05, 30 January 2017 (UTC)
I began with the suggestion a clumsily constructed sentence needed revision, because my initial sense was that the problem had as much to do with muddled writing as with science. I'm reasonably happy with the revised version, even though this lengthy debate suggests that it may oversimplify the facts.
I cannot see any point in my reading the report. You all are the one's with the scientific expertise, and hopefully will eventually find a mutually acceptable wording. Rwood128 (talk) 16:08, 30 January 2017 (UTC)
- Although I'm not wild about the word "dominant" as it has unfounded connotations in this context, I agree with Dave souza that the statement "It is extremely likely that human influence has been the dominant cause of the observed warming since the mid-20th century" is short, sweet and simple and is otherwise accurate. I would recommend either that statement or that statement with the words "has been the dominant cause" replaced by "has caused more than half of" which is more accurate and equally readable and accessible. --TheClarinetGuy talk
- The current version uses the verbatim quote from IPCC's top level most boiled down summary. If they meant to say, or give an opening for others to infer, that it is extremely like that 49% of the warming is natural they could have said so. This was their FIFTH time at bat, after all. NewsAndEventsGuy (talk) 00:10, 31 January 2017 (UTC)
- Although I'm not wild about the word "dominant" as it has unfounded connotations in this context, I agree with Dave souza that the statement "It is extremely likely that human influence has been the dominant cause of the observed warming since the mid-20th century" is short, sweet and simple and is otherwise accurate. I would recommend either that statement or that statement with the words "has been the dominant cause" replaced by "has caused more than half of" which is more accurate and equally readable and accessible. --TheClarinetGuy talk
- Seems accurate enough and follows what the report says. Anything more can go into the body of the article. An alternative would be to use the SPM and just say something like the best estimate of the amount due to human factors is similar to the total amount. Mixing probabilities and amounts like TheClarinetGuy says has obviously caused a lot of confusion and misunderstanding here, it is unsuitable for the lead. Dmcq (talk) 22:04, 30 January 2017 (UTC)
Trump and global warming related websites disappearing
I've read that Donald Trump is forcing government scientists to keep quiet about global warming. Trump is also taking down government sponsored web-pages dealing with the science of global warming. See:
- Trump Administration Tells EPA To Remove Climate Change Page from Website
- Apocalypse Now: Trump starts dismantling women’s rights, reverses Keystone and Dakota Access Pipeland blocks, freezes EPA grants, and blocks information from USDA
- The imminent destruction of American science
Wikipedia articles might become important as sites that Trump can't dislodge. Wikipedia editors who specialize in the science of global warming need to search diligently for reliable websites that Trump can't mess with. Such sites can serve as references for this and other global warming related articles.
If you are one of those scientists who don't like being gagged or if you know any of those scientists Wikiversity accepts original material and you don't need to give your real name to publish there. Just make sure Trump's hackers can't trace you. Proxima Centauri (talk) 17:34, 25 January 2017 (UTC)
- Until he writes an executive order forbidding the discussion of climate change on servers hosted in the US. And yes, it would be unconstitutional. You think he cares? Guy (Help!) 17:40, 25 January 2017 (UTC)
I don't think Trump can break the constitution except perhaps temporarily. The ACLU has taken on extra staff to deal with the vast number of Trump related law suits they expect. I guess Trump cares about losing law suits. Proxima Centauri (talk) 18:11, 25 January 2017 (UTC)
- It looks to me very much as if he is already in breach of the Emoluments Clause. And of course there's the unratified Nixon Amendment ("don't be a Dick")...
- He could, undoubtedly, issue an order depriving WMF of it's charitable status. Guy (Help!) 18:17, 25 January 2017 (UTC)
- There are a great many websites like science forums where scientists can publish anonymously and Trump can't get to all of them. Proxima Centauri (talk) 18:34, 25 January 2017 (UTC)
- You know that. I know that. Every sane person in the world knows that. Trump, on the other hand, thinks he had the biggest audience of any inauguration in history. Guy (Help!) 18:39, 25 January 2017 (UTC)
- There are a great many websites like science forums where scientists can publish anonymously and Trump can't get to all of them. Proxima Centauri (talk) 18:34, 25 January 2017 (UTC)
- In this situation, it behooves us to archive EVERY reference we have, and to automatically archive any new references we add. — Gorthian (talk) 21:17, 25 January 2017 (UTC)
- See Trump Regulating scientific publications. Proxima Centauri (talk) 16:43, 31 January 2017 (UTC)
- Agree. It would be silly to be complacent about what Trump might do. Note that a robots prohibition on a site will stop archive.org showing stuff it has archived before the prohibition. This is a real problem with the site, I can see the point but there should be a checked way of getting round the problem when it is okay to show the site anyway. Dmcq (talk) 17:11, 31 January 2017 (UTC)
"are not disputed by any scientific body of national or international standing."
This statement at the end of the second paragraph seems to be overly broad and unsubstantiated. Certainly, the citation given does not document the statement. And certainly, there are scientific bodies of "national" or "international" standing (whatever that means) that dispute elements of the IPCC conclusions. In any case, it doesn't seem like a particularly factual statement and detracts from the quality of the article. The previous statement about statements from academic organizations is a more factual and accurate statement and I would think leaving it at that point, rather than making the sweeping claim, which is easily disprovable, would be better. --TheClarinetGuy talk 15:57, 29 January 2017 (UTC)
- Could you provide a citation to one or more of these bodies that you say dispute the findings please. Thanks. Dmcq (talk) 17:27, 29 January 2017 (UTC)
- I will do so, but in the meantime, I should also note that the cited Joint science academies' statement (1) does not refer to the IPCC Fifth Assessment Report, which is the source for all of the referenced statements, but rather cites earlier IPCC reports which have been superseded by the FAR, (2) the joint statement furthermore does not say what is stated in the article, so to claim that "these findings" are supported by the joint statement is simply false (for example the joint statement says nothing about the temperature projections), and (3) the statement is signed by academies from only 11 countries out of the G20 major economies so it is not true that it has been signed by academies from all of the "the major industrialized nations". --TheClarinetGuy talk 18:03, 29 January 2017 (UTC)
- Look at the statement of the American Physical Society from 2007 with additional commentary in 2010 here. It does not support all of the statements made in the article. And, as I said before, the joint statement and citation do not support all of the statements made. The problematic sentence is
- These findings have been recognized by the national science academies of the major industrialized nations[15][b] and are not disputed by any scientific body of national or international standing.[17]
- I think it would be much better to simply say, something along the lines of the following, which is certainly a true statement and is verified by the citations given. As it stands now, the sentence is not true, and not verified by the citations given.
- Some of these findings have been recognized by the national science academies of some of the major industrialized nations.[15][b] [17]
- --TheClarinetGuy talk 18:30, 29 January 2017 (UTC)
- Lets just deal with the bit where you say what was said is easily disprovable first. Dmcq (talk) 18:31, 29 January 2017 (UTC)
- I did disprove it. The APS statement does not agree with the the temperature projections or the 95% certainty that the majority of the warming is anthropogenic. Furthermore, none of the joint statements say anything about the temperature projections that the IPCC FAR talks about. So to claim that they support it is simply false. --TheClarinetGuy talk 18:37, 29 January 2017 (UTC)
- I don't see the name of a science academy in what you wrote there. I am not interested in your proofs or disproofs, such stuff comes under WP:OR. I am interested in getting a citation which can be stuck into the article. Dmcq (talk) 20:26, 29 January 2017 (UTC)
- The American Physical Society is a science academy, indeed one of the oldest and preeminent academies of science in the USA. --TheClarinetGuy talk 21:27, 29 January 2017 (UTC)
- Why them? They say explicitly they support the IPCC [22] Dmcq (talk) 21:52, 29 January 2017 (UTC)
- I cited the APS statement on climate change above, but here it is again, the statement you reference from November 14, 2015 is a very short "Statement on Earth's Changing Climate" that says in part, "While natural sources of climate variability are significant, multiple lines of evidence indicate that human influences have had an increasingly dominant effect on global climate warming observed since the mid-twentieth century" which is very different from the IPCC statements referenced in the article, and it says nothing about projected future temperatures which the IPCC does and is referenced in the article. Furthermore, nowhere in the statement you reference does it state that the APS "support the IPCC" or all of its conclusions. Indeed, it says "Nevertheless, as recognized by Working Group 1 of the IPCC, scientific challenges remain in our abilities to observe, interpret, and project climate changes. To better inform societal choices, the APS urges sustained research in climate science." Please read carefully. --TheClarinetGuy talk 23:08, 29 January 2017 (UTC)
- How on Earth do you justify your claim that the APS "disputes" what the IPCC says when all they do is point out different aspects of the same thing? Is to repeat all the IPCC's findings word for word and not say anything else the only way not to "dispute" the IPCC's findings? --Hob Gadling (talk) 23:24, 29 January 2017 (UTC)
- We're only talking about the couple of sentences in this articles that cite specific findings of the IPCC. And then the article says "These findings have been recognized by the national science academies of the major industrialized nations[15][b] and are not disputed by any scientific body of national or international standing.[17]" That is a demonstrably false statement, as I have demonstrated here. These findings, namely the ones in the two or three preceding sentences have not all been "recognized by ...". We are not talking about all the findings of the IPCC, just the ones that this article specifically references. You have to read and respond in context. --TheClarinetGuy talk 23:30, 29 January 2017 (UTC)
- I see nothing in the APS statement that disputes what the IPCC says. You said that it was easy to show there were such type organizations that dispute the IPCC conclusions. Either produce one or just stop. Dmcq (talk) 23:40, 29 January 2017 (UTC)
- We're only talking about the couple of sentences in this articles that cite specific findings of the IPCC. And then the article says "These findings have been recognized by the national science academies of the major industrialized nations[15][b] and are not disputed by any scientific body of national or international standing.[17]" That is a demonstrably false statement, as I have demonstrated here. These findings, namely the ones in the two or three preceding sentences have not all been "recognized by ...". We are not talking about all the findings of the IPCC, just the ones that this article specifically references. You have to read and respond in context. --TheClarinetGuy talk 23:30, 29 January 2017 (UTC)
- How on Earth do you justify your claim that the APS "disputes" what the IPCC says when all they do is point out different aspects of the same thing? Is to repeat all the IPCC's findings word for word and not say anything else the only way not to "dispute" the IPCC's findings? --Hob Gadling (talk) 23:24, 29 January 2017 (UTC)
- I cited the APS statement on climate change above, but here it is again, the statement you reference from November 14, 2015 is a very short "Statement on Earth's Changing Climate" that says in part, "While natural sources of climate variability are significant, multiple lines of evidence indicate that human influences have had an increasingly dominant effect on global climate warming observed since the mid-twentieth century" which is very different from the IPCC statements referenced in the article, and it says nothing about projected future temperatures which the IPCC does and is referenced in the article. Furthermore, nowhere in the statement you reference does it state that the APS "support the IPCC" or all of its conclusions. Indeed, it says "Nevertheless, as recognized by Working Group 1 of the IPCC, scientific challenges remain in our abilities to observe, interpret, and project climate changes. To better inform societal choices, the APS urges sustained research in climate science." Please read carefully. --TheClarinetGuy talk 23:08, 29 January 2017 (UTC)
- Why them? They say explicitly they support the IPCC [22] Dmcq (talk) 21:52, 29 January 2017 (UTC)
- The American Physical Society is a science academy, indeed one of the oldest and preeminent academies of science in the USA. --TheClarinetGuy talk 21:27, 29 January 2017 (UTC)
- I don't see the name of a science academy in what you wrote there. I am not interested in your proofs or disproofs, such stuff comes under WP:OR. I am interested in getting a citation which can be stuck into the article. Dmcq (talk) 20:26, 29 January 2017 (UTC)
@Dmcq: Among other things, I said "This statement at the end of the second paragraph seems to be overly broad and unsubstantiated. Certainly, the citation given does not document the statement." Currently, the last sentence of the 2nd paragraph reads, "These findings have been recognized by the national science academies of the major industrialized nations[14][b] and are not disputed by any scientific body of national or international standing.[16]" That statement is false and misleading for the following reasons
- "These findings" namely the temperature projections, for example, are not mentioned in the cited joint statement. So the statement that "these findings have been recognized by" is an unsupported claim and as such should be removed.
- Saying something is "not disputed by" is misleading phrasing attempting to lead the reader into believing that "not disputed" = "supports". There are many things that are not disputed that are neither true nor supported. The individual science organizations have issued their own statements and joint statements of what they believe to be true. The fact that they don't item-by-item dispute elements of the IPCC report does not mean that they support every statement in the IPCC. Indeed, they have indicated support for only a small portion of what the IPCC report claims.
- There are numerous peer-reviewed science papers published all the time that dispute and contradict elements of the IPCC reports.
- We're not talking about papers, we're talking about scientific societies of national or international standing. Please keep to the subject and produce a citation suppporting what you saoid that it was easyy to show there were such institutions that disputed the conclusions of the IPCC. There is no requirementt for them to reproduce every statement of the IPCC when they show support of its conclusions and don't put in any exceptions. Dmcq (talk) 21:59, 30 January 2017 (UTC)
- I started the thread, so I know what I'm talking about. And the statement "These findings..." is false, in particular the findings in the preceding sentence are not "recognized by the national science academies of the major industrialized nations" and the citation does not show any such recognition of those findings. I don't understand why you are hung up on this? It's very straightforward. Where is your evidence that they are recognized? The burden of proof is on the party seeking to include statements in a WP article, not the other way around, and to show that you must provide "a citation to a reliable source that directly supports the contribution". So show me a source that says that the science academies of all the industrialized nations of the world recognize the temperature predictions of the IPCC. The citation given (1) does not mention the temperature predictions, and (2) does not include all the major industrialized nations. --TheClarinetGuy talk 01:07, 31 January 2017 (UTC)
- "I started the thread, so I know what I'm talking about." Ho ho ho. That's a good one. :) Dmcq (talk) 13:50, 31 January 2017 (UTC)
- When I said "I know what I'm talking about" I didn't mean it in the sense of "I'm so smart", I meant it as a response to your admonition to "Please keep to the subject", and given that I started the subject—although I may not have been perfectly clear—I know what I intended to talk about. My topic sentence was, "This statement at the end of the second paragraph seems to be overly broad and unsubstantiated" and that was the gist of my observation. You then subsequently wanted to focus on a side point that I mentioned in passing. That was not my main point as indicated by my topic sentence. Sorry if I was unclear. --TheClarinetGuy talk 01:53, 1 February 2017 (UTC)
- "I started the thread, so I know what I'm talking about." Ho ho ho. That's a good one. :) Dmcq (talk) 13:50, 31 January 2017 (UTC)
- I started the thread, so I know what I'm talking about. And the statement "These findings..." is false, in particular the findings in the preceding sentence are not "recognized by the national science academies of the major industrialized nations" and the citation does not show any such recognition of those findings. I don't understand why you are hung up on this? It's very straightforward. Where is your evidence that they are recognized? The burden of proof is on the party seeking to include statements in a WP article, not the other way around, and to show that you must provide "a citation to a reliable source that directly supports the contribution". So show me a source that says that the science academies of all the industrialized nations of the world recognize the temperature predictions of the IPCC. The citation given (1) does not mention the temperature predictions, and (2) does not include all the major industrialized nations. --TheClarinetGuy talk 01:07, 31 January 2017 (UTC)
I agree there's work to do here. When the text was first introduced it read
- The scientific consensus is that anthropogenic global warming is occurring. This finding is recognized by the national science academies of all the major industrialized countries and is not rejected by any scientific body of national or international standing.[1][2][3][B] Nevertheless, skepticism amongst the wider public remains. The Kyoto Protocol is aimed at stabilizing greenhouse gas concentration to prevent a "dangerous anthropogenic interference".[4] As of November 2009, 187 states had signed and ratified the protocol.[5]
At the start of 2012, the disputed text was part of Lead para 1
- Global warming refers to the rising average temperature of Earth's atmosphere and oceans and its projected continuation. In the last 100 years, Earth's average surface temperature increased by about 0.8 °C (1.4 °F) with about two thirds of the increase occurring over just the last three decades.[2] Warming of the climate system is unequivocal, and scientists are more than 90% certain most of it is caused by increasing concentrations of greenhouse gases produced by human activities such as deforestation and burning fossil fuels.[3][4][5][6] These findings are recognized by the national science academies of all the major industrialized countries.[7][A]"
In those two versions "these findings" came immediately after the sentence saying (paraphrased) that its warming and its us. Today the disputed text is found at the end of paragraph 2, and to refocus that reads
- Scientific understanding of global warming is increasing. The United Nations Intergovernmental Panel on Climate Change (IPCC) reported in 2014, that "It is extremely likely that human influence has been the dominant cause of the observed warming since the mid-20th century." [9] Human activities have led to carbon dioxide concentrations above levels not seen in hundreds of thousands of years. Currently, about half of the carbon dioxide released from the burning of fossil fuels remains in the atmosphere. The rest is absorbed by vegetation and the oceans.[10] Climate model projections summarized in the report indicated that during the 21st century the global surface temperature is likely to rise a further 0.3 to 1.7 °C (0.5 to 3.1 °F) for their lowest emissions scenario and 2.6 to 4.8 °C (4.7 to 8.6 °F) for the highest emissions scenario.[11] These findings have been recognized by the national science academies of the major industrialized nations[12][b] and are not disputed by any scientific body of national or international standing.[14]
problems
- The main problem is that "these findings" has been gramatically severed from what it is supposed to refer to (its warming and its mostly us)
- A small apple polishing issue is that the sci academy reference is 2005 and someone who doesn't understand that IPCC has been saying its warming and its us since AR1 might wonder how a 2005 statement can affirm or reject findings that were (re)stated in a 2013/2014 report. That's only possible when people don't realize the 2013 bit is a restatement of the general point that its warming and its mostly us, but the current language does create the possibility that someone would stumble on this.
Fixes should be pretty simple, but I'm out of time for awhile. Your thoughts anybody? NewsAndEventsGuy (talk) 03:24, 31 January 2017 (UTC)
- @NewsAndEventsGuy: Thank you for pointing out the history of the statement. When the statement was first introduced in 2011 (as you note above)
- "The scientific consensus is that anthropogenic global warming is occurring. This finding is recognized by the national science academies of all the major industrialized countries and is not rejected by any scientific body of national or international standing."
- that was a true and well supported statement I believe. While, I am not totally clear that all of the G20 signed on to that statement, certainly most of them have. Note, however, that all it states is that some anthropogenic global warming is occurring. It does not quantify how much, and it certainly doesn't say anything about future global temperature predictions. --TheClarinetGuy talk 06:11, 31 January 2017 (UTC)
refs for this section
References
- ^ Oreskes, Naomi (December 2004). "BEYOND THE IVORY TOWER: The Scientific Consensus on Climate Change". Science. 306 (5702): 1686. doi:10.1126/science.1103618. PMID 15576594.
Such statements suggest that there might be substantive disagreement in the scientific community about the reality of anthropogenic climate change. This is not the case. [...] Politicians, economists, journalists, and others may have the impression of confusion, disagreement, or discord among climate scientists, but that impression is incorrect.
- ^ "Joint Science Academies' Statement" (PDF). Retrieved 2010-08-09.
- ^ "Understanding and Responding to Climate Change" (PDF). Retrieved 2010-08-09.
- ^ "Article 2". The United Nations Framework Convention on Climate Change. Retrieved 15 November 2005.
Such a level should be achieved within a time-frame sufficient to allow ecosystems to adapt naturally to climate change, to ensure that food production is not threatened and to enable economic development to proceed in a sustainable manner
- ^ "Kyoto Protocol: Status of Ratification" (PDF). United Nations Framework Convention on Climate Change. 2009-01-14. Retrieved 2009-05-06.
Proposal to change title
I would like to propose the title of the article be change from "global warming" to "climate change" or a new term proposed by scientists, "global weirding." The public often misinterprets this term (global warming), believing climate change is related only to the heating of the earth. This misconception plays an important role in the public perception and acceptance of climate change. V00d00Child (talk) 20:41, 30 January 2017 (UTC)
- As in climate change? Both terms are used, with a difference in emphasis and overlapping meaning, by multiple sources. The neologism "global weirding" has yet another set of meanings, if sufficiently sourced as something independent it could form a further article, provided care is taken that it's not a WP:POVFORK. . . dave souza, talk 21:03, 30 January 2017 (UTC)
- The global warming article seems to be a reasonable split from the climate change article in that climate change can deal more with long term climate change whereas global warming is used for the recent phenomenon. Global weirding gets too few hits on google compared to global warming to consider it any further as a title for this article. Dmcq (talk) 22:09, 30 January 2017 (UTC)
- This has been frequently debated in the talk page archives, especially in the 2007-2014 time frame, and here we are. The proposal may be a good faith one, yet the only new remark is your personal preference for the somewhat neologistic "global weirding"... as that, see WP:COMMONNAME. NewsAndEventsGuy (talk) 23:47, 30 January 2017 (UTC)
- NewsAndEventsGuy, this is a new user who is indeed making a proposal in good faith. V00d00Child, does the link to COMMONNAME help at all? Thank you, Dr Aaij (talk) 02:45, 1 February 2017 (UTC)
- The link to COMMONNAME is very informative. I understand now the importance of using a title in which people can easily recognize and look up. Though my proposition was done in good faith, I will do better to look back through an article's talk page history before proposing an idea which was settled years ago. Thank you for your help. V00d00Child (talk) 04:08, 1 February 2017 (UTC)
- Voodoo, No prob, glad to. I learned the word "neologism" myself when I proposed an article change about something a few years ago. NewsAndEventsGuy (talk) 08:54, 1 February 2017 (UTC)
- Dr Aaij, You gotta problem with my behavior, then please post something specific at my talk page. See WP:FOC. Thanks. NewsAndEventsGuy (talk) 08:54, 1 February 2017 (UTC)
- Voodoo, No prob, glad to. I learned the word "neologism" myself when I proposed an article change about something a few years ago. NewsAndEventsGuy (talk) 08:54, 1 February 2017 (UTC)
Use of the NASA GISS data charts
Why are the only two charts showing global warming at the top of the article from NASA GISS? There are eight or more different Global temperature datasets published by reputable authoritative sources, and GISS is known to be one of the most extreme and controversial of those. WP:NPOV, WP:DUE , and WP:BESTSOURCES would seem to require that we either also show some graphs based on datasets at the other end of the spectrum to balance the article, or instead include some graphs based on averaging of multiple datasets. --TheClarinetGuy talk 06:29, 31 January 2017 (UTC)
- GISS is known to be one of the most extreme and controversial of those? Sounds like nonsense to me William M. Connolley (talk) 08:55, 31 January 2017 (UTC)
- I don't know about "eight or more" - the big ones are HadCrut, GISS, and NOAA, and I'd be surprised if more than a handful of people could recognise one of them from the others. They are so similar that the difference at the scale of our image does not matter. NASA images and datasets have the advantage that they are unquestionable public domain. And while we can recreate the simple plots easily, the world map with temperature differences is a lot less easy and requires a lot more data crunching, so its nice if a reliable source provides it. --Stephan Schulz (talk) 10:54, 31 January 2017 (UTC)
- NOAA materials should be public domain just as NASA are. If anyone wants to use Berkeley Earth materials, I can also ensure that the licensing there is okay. Dragons flight (talk) 15:55, 31 January 2017 (UTC) P.S. I can tell the different time series apart. ;-)
- As an only slightly relevant observation: During "the pause" we had "skeptics" knocking at the door every January clamouring for updates and accusing everybody (but nobody in particular) of "hiding the truth". Since the warming has come back with a vengeance, the truth seems to be less urgent... --Stephan Schulz (talk) 11:05, 31 January 2017 (UTC)
- I don't know about "eight or more" - the big ones are HadCrut, GISS, and NOAA, and I'd be surprised if more than a handful of people could recognise one of them from the others. They are so similar that the difference at the scale of our image does not matter. NASA images and datasets have the advantage that they are unquestionable public domain. And while we can recreate the simple plots easily, the world map with temperature differences is a lot less easy and requires a lot more data crunching, so its nice if a reliable source provides it. --Stephan Schulz (talk) 10:54, 31 January 2017 (UTC)
- You could always try and produce a better one with whatever sources you think satisfy DUE NPOV BESTSOURCES etc. and we can look at seeing if it is a better candidate for inclusion. Or even if you just have some good data to form a basis it may be possible to get one of the whizzes at commons to do a job on it. Have you some such data in mind? Dmcq (talk) 14:01, 31 January 2017 (UTC)
- It's a simple statement of numerical fact that GISTEMP is at the hot extreme end of all the datasets in the world. And from one end to the other, there is wide discrepancy. And there are significantly more than eight datasets used regularly by climate scientists. Here are some of those datasets for global temperature (in no particular order) -
- NASA (GISTEMP)
- NOAA (MLOST or NOAAGlobalTemp)
- UK Met Office (HadCRUT4])
- Berkeley Earth, RSS
- UAH 6.0 TLT
- NOAA (CARDS)
- AEROSTAB
- NOAA (RATPAC)
- UK Met Office (HadAT)
- University of Vienna IMGW (RAOBCORE/RICH)
- University of New South Wales CCRC (IUK Radiosonde Analysis Project)
- and there are others. --TheClarinetGuy talk 14:42, 31 January 2017 (UTC)
- I notice you didn't even attempt to defend your use of "controversial". Of your 8, AEROSTAB is so obscure you can't even find a link to it and no-one has ever heard of it. Most of your others objections. Try to stick to reasonable suggestions William M. Connolley (talk) 15:18, 31 January 2017 (UTC)
- Sorry, I presumed that everybody editing here was aware of all the controversies surrounding NASA GISS data. Here's one small example from the Washington Times in 2009, Global warming controversy reaches NASA climate data. But there are many others in the press and in the back and forth between climate scientists over the past decades. --TheClarinetGuy talk 21:04, 31 January 2017 (UTC)
- Another controversy surrounding NASA GISS discussed here Judicial Watch Uncovers NASA Documents Related to Global Warming Controversy. --TheClarinetGuy talk 21:14, 31 January 2017 (UTC)
- Astounding! Moonies at The Washington Times and some groups.google.com/forum think science is controversial!! Do you really want to give "equal validity" to these alternative realities? . . . dave souza, talk 03:53, 1 February 2017 (UTC)
- Several of the suggestions are not surface temperature records, and several are too short for showing development of the climate. --Stephan Schulz (talk) 15:19, 31 January 2017 (UTC)
- Global warming is not measured solely by surface temperature records. Indeed, there are three types of datasets here - surface, satellite, and radiosonde - all independent methods of measuring and monitoring global temperature. For WP:BALANCE, it would make sense to have representative information from all three fundamentally different methodologies, that indeed produce widely varying results. The satellite records are available from 1979 to the present which is the prime period during which human influence is theorized to be most prevalent. With more than 40 years of data there, they are clearly not too short. The radiosondes go back to the beginning of the 20th century. With adjustments etc, the RATPAC radiosonde data goes back to 1958. --TheClarinetGuy talk 20:36, 31 January 2017 (UTC)
- I notice you didn't even attempt to defend your use of "controversial". Of your 8, AEROSTAB is so obscure you can't even find a link to it and no-one has ever heard of it. Most of your others objections. Try to stick to reasonable suggestions William M. Connolley (talk) 15:18, 31 January 2017 (UTC)
- It's a simple statement of numerical fact that GISTEMP is at the hot extreme end of all the datasets in the world. And from one end to the other, there is wide discrepancy. And there are significantly more than eight datasets used regularly by climate scientists. Here are some of those datasets for global temperature (in no particular order) -
- Do all these others satisfy your idea of NPOV DUE and BESTSOURCE? Dmcq (talk) 15:53, 31 January 2017 (UTC)
- These indeed are sources regularly used and cited by climate scientists in the peer reviewed literature. --TheClarinetGuy talk 20:36, 31 January 2017 (UTC)
- That isn't what I asked. If we use some of these will you then come back with other objections or are you happy with all of them? Dmcq (talk) 00:42, 1 February 2017 (UTC)
- @Dmcq: I think that it would make sense to show one terrestrial data set, one lower troposphere, and one radiosonde. Don't you? --TheClarinetGuy talk 06:22, 1 February 2017 (UTC)
- I thought I had asked a simple enough question. Either you can't understand the question or you don't want to answer the question. Dmcq (talk) 10:49, 1 February 2017 (UTC)
- I answered your question. I guess you just didn't read my response. My use of the term "it would make sense" indicates that yes indeed I would be happy if the graphics included one representative graph from each of the three types of data sources from the list I have provided. I am also open to other sources if there are better ones. --TheClarinetGuy talk 15:08, 1 February 2017 (UTC)
- I thought I had asked a simple enough question. Either you can't understand the question or you don't want to answer the question. Dmcq (talk) 10:49, 1 February 2017 (UTC)
- @Dmcq: I think that it would make sense to show one terrestrial data set, one lower troposphere, and one radiosonde. Don't you? --TheClarinetGuy talk 06:22, 1 February 2017 (UTC)
- That isn't what I asked. If we use some of these will you then come back with other objections or are you happy with all of them? Dmcq (talk) 00:42, 1 February 2017 (UTC)
- These indeed are sources regularly used and cited by climate scientists in the peer reviewed literature. --TheClarinetGuy talk 20:36, 31 January 2017 (UTC)
- I've lost count of the individual assertions without RSs in this thread, but they are many and without RSs they are all prohibited as WP:Original research. At some point an endless stream of original research assertions becomes WP:Tendentious. Got a specific proposal for article improvement that contains a cite to a reliable source? SPit it out, else move on. NewsAndEventsGuy (talk) 19:12, 31 January 2017 (UTC)
- I just gave you a list of 11 different reliable sources (ie data sets) that are regularly cited in the peer reviewed climate science literature. What, pray tell, is more reliable than that? My question was simply as I stated above, "Why are the only two charts showing global warming at the top of the article from NASA GISS?" As the article states at Global warming#Observed_temperature_changes,
- The global average (land and ocean) surface temperature shows a warming of 0.85 [0.65 to 1.06] °C in the period 1880 to 2012, based on multiple independently produced datasets.[31] Earth's average surface temperature rose by 0.74±0.18 °C over the period 1906–2005. The rate of warming almost doubled for the last half of that period (0.13±0.03 °C per decade, versus 0.07±0.02 °C per decade).[32]
- The average temperature of the lower troposphere has increased between 0.13 and 0.22 °C (0.23 and 0.40 °F) per decade since 1979, according to satellite temperature measurements. [emphasis added]
- That's a huge discrepancy between what the satellite records report and what the land based records report. And as you are well aware I presume, global warming theory predicts there should be more warming in the lower troposphere than at the surface. Perhaps a graph showing an average of the two satellite records, or one of the two satellite records—which are quite similar—would be appropriate? --TheClarinetGuy talk 20:36, 31 January 2017 (UTC)
- Here is an excellent summary graph, for example, showing the growing difference between the terrestrial datasets and the satellite datasets. The data for this graph is the global monthly average of HadCRUT4, NOAA MLOST, and NASA GISS minus the average of the two satellite sets RSS and UAH. The article is here. --TheClarinetGuy talk 20:47, 31 January 2017 (UTC)
- I just gave you a list of 11 different reliable sources (ie data sets clearly you aren't getting it. You could, maybe, produce an image using a dataset. See the policy on WP:Image policy. But anything you want to assert about these data sets is FROM YOUR OWN BLEEPIN HEAD and that makes it WP:Original research. If you want to not wear out your welcome and have us really consider something, find a WP:Reliable source that talks about those datasets and make a proposal for how the article can be improved on the basis of that reliable source, not your analysis of the datasets. I don't give two cents about your claims of what the numbers mean because you need to publish that analysis in the literature before wikipedia editors care. Anybody think I made an unfair comment here, please correct me. BTW if you find anyplace in our article where some OR slipped past us before, we can talk about that too. NewsAndEventsGuy (talk) 21:49, 31 January 2017 (UTC)
- The only source given for the NASA GISS Graphs at the top of the article is the NASA GISS website. Do you mean an RS such as that? --TheClarinetGuy talk 22:57, 31 January 2017 (UTC)
- There are many graphs based on UAH and RSS data and the other mentioned datasets published in reliable sources. Are you asking me to propose some particular graphs? I was simply raising the question that it seems like for balance, we should have something other than one graph out of many available in the published literature especially one that is known to be controversial and at one end of the spectrum of representative graphs. And nowhere have I proposed publishing my own original research or interpretations of datasets. I am simply bringing them to your collective attention, because some of the respondents above said they were only aware of three datasets. Non need for hostility. --TheClarinetGuy talk 23:17, 31 January 2017 (UTC)
- In Wikipedia, always click on the image to see the full image file, and the metadata that is found at the bottom. IN this case the RS is not the website. The RS is NASA Goddard Institute for Space Studies. It's a WP:PRIMARY work, and I don't see that we're doing any interpretation, so OR is not a problem for use of this graph. It sounds like you are trying to forumlate a criticism of use of this graph based on WP:WEIGHT. In formulating your arguments you continue to say you're not doing WP:Original research when in fact you are. The crux of your WEIGHT argument is your - repeat your - OR assertion that this graph is "one that is known to be controversial and at one end of the spectrum of representative graphs". All I can say at this point is yawn. If you wanna keep it up you need solid RSs that back up your claim that this graph really is controversial and at one end of spectrum of representative graphs". If - and only if - you come up with a solid RS for this point .... and RS that is self contained and needs no analysis on our part ..... only then is there anything to talk about here. NewsAndEventsGuy (talk) 00:42, 1 February 2017 (UTC)
- The 'and there are others' at the end of the list indicates to me that the list you gave is not a list of ones you have vetted as satisfying your requirements but simply some list culled from the web. If it is the case you are just bringing up some weak objection and don't have any reasonably thought out alternative then this whole discussion does verge on being a waste of time. Dmcq (talk) 00:52, 1 February 2017 (UTC)
- I just gave you a list of 11 different reliable sources (ie data sets clearly you aren't getting it. You could, maybe, produce an image using a dataset. See the policy on WP:Image policy. But anything you want to assert about these data sets is FROM YOUR OWN BLEEPIN HEAD and that makes it WP:Original research. If you want to not wear out your welcome and have us really consider something, find a WP:Reliable source that talks about those datasets and make a proposal for how the article can be improved on the basis of that reliable source, not your analysis of the datasets. I don't give two cents about your claims of what the numbers mean because you need to publish that analysis in the literature before wikipedia editors care. Anybody think I made an unfair comment here, please correct me. BTW if you find anyplace in our article where some OR slipped past us before, we can talk about that too. NewsAndEventsGuy (talk) 21:49, 31 January 2017 (UTC)
- I just gave you a list of 11 different reliable sources (ie data sets) that are regularly cited in the peer reviewed climate science literature. What, pray tell, is more reliable than that? My question was simply as I stated above, "Why are the only two charts showing global warming at the top of the article from NASA GISS?" As the article states at Global warming#Observed_temperature_changes,
- Do all these others satisfy your idea of NPOV DUE and BESTSOURCE? Dmcq (talk) 15:53, 31 January 2017 (UTC)
How about these two references as a starting point. They discuss UAH and GISS and have graphs and talk about some of the controversies surrounding GISS, they are WP:SECONDARY, and they are recent (2015) - Updated Satelitte Data Shows Even Less Global Warming Than Before, and Scientists to Investigate Government Climate Data 'Tampering' --TheClarinetGuy talk 02:14, 1 February 2017 (UTC)
- You want to use The Daily Caller as a source on a scientific topic? Are you serious? Shock Brigade Harvester Boris (talk) 02:23, 1 February 2017 (UTC)
- (ec) @Cohler: Daily Caller? You're joking right? --McSly (talk) 02:26, 1 February 2017 (UTC)
- Insert choking sound effects NewsAndEventsGuy (talk) 02:41, 1 February 2017 (UTC)
- Ah, but that's not the only source TheClarinetGuy proposes .. at 21:04 and 21:14 on 31 January they tried The Washington Times and some groups.google.com/forum – apparently trying to give "equal validity" to alternative facts. . . . . dave souza, talk 04:02, 1 February 2017 (UTC)
How about this very recently published paper Assessing Atmospheric Temperature Data Sets for Climate Studies published in Tellus A of the International Meteorological Institute in Stokholm which shows the NASA GISS data has a temperature trend significantly higher (.16ºC per decade) than the satellite datasets (.11º or .12º per decade) from 1979 to the present? The last couple of sentences of the conclusion state "We therefore strongly suggest that tropospheric temperature trends from re-analyses should replace surface temperature trends in future climate validation studies." [emphasis added] --TheClarinetGuy talk 06:15, 1 February 2017 (UTC)
- (A) You've quoted something. You have not told us how you think we can use the "something" to improve the article.
- (B) Did you read the entire journal article, or just the JudithCurry blog post that provides this quote? (beware of confirmation bias)
- NewsAndEventsGuy (talk) 09:08, 1 February 2017 (UTC)
- @NewsAndEventsGuy: (A) I've told you repeatedly how it would improve the article. Please read before responding. I said we should provide some balance in this article regarding the fact that the top two graphics in the article come from NASA GISS and do not fairly represent the range of data published on the subject. I've also explained that global warming is measured by distinctly different methods, namely thermometers on the ground, satellites in the sky, and radiosondes on balloons. They give different results. We should represent that here.
- (B) Yes I read the entire journal article and had not seen the Curry blog post, although I will definitely check it out.
- --TheClarinetGuy talk 15:03, 1 February 2017 (UTC)
- Just read the Curry post. I'm sure you noted that in her last sentence she states, "IMO, this is where true progress lies in terms of understanding the global temperatures". And before you jump on me, no I am not suggesting a blog post as a source, simply responding to your note re the Curry post. --TheClarinetGuy talk 15:20, 1 February 2017 (UTC)
- All you've said is we should do something to cure what, in your opinion, is a problem. You've said we should do something that would provide a solution to the alleged problem. You still haven't connected the dots between (A) problem definition (B) reliable sources on point and (C) the specific edits we could make to implement your undefined, abstract, mystery proposal. I'm getting weary of asking. See WP:DISRUPTSIGNS please. NewsAndEventsGuy (talk) 15:38, 1 February 2017 (UTC)
- That is hardly all I've said. I have cited valid sources, I have suggested particular data sources, I have pointed to various possible graphs, I have provided reliable sources. The only thing I have not done was give the precise specific edits, because I was trying to build some consensus here before doing so. Is that not the proper way on WP? I would appreciate it if you would stop with the unfounded attacks and focus on the substance of the conversation. --TheClarinetGuy talk 17:47, 1 February 2017 (UTC)
- All you've said is we should do something to cure what, in your opinion, is a problem. You've said we should do something that would provide a solution to the alleged problem. You still haven't connected the dots between (A) problem definition (B) reliable sources on point and (C) the specific edits we could make to implement your undefined, abstract, mystery proposal. I'm getting weary of asking. See WP:DISRUPTSIGNS please. NewsAndEventsGuy (talk) 15:38, 1 February 2017 (UTC)
- I would have been happy if you had said what sources you would be happy with rather than just listing any you googled. Then we could have had a proper discussion and maybe come to some sort of idea about something to do. Anybody have anything that can be rescued from all this that is relevant to improving the article? Dmcq (talk) 10:54, 1 February 2017 (UTC)
- @Dmcq: Above in this conversation, I responded to your query about this here saying "I think it would make sense to show one terrestrial data set, one lower troposphere, and one radiosonde, dont you?" And yes, I thought that I made it clear that I would be happy if the article did what I suggested in response to your question, namely use a graphic from one of the terrestrial data sets I listed (which obviously could be the GISS charts that are already there), a graphic from one of the satellite datasets, and one from the radiosonde datasets. I would recommend choosing graphics that show the differences between those datasets. --TheClarinetGuy talk 15:03, 1 February 2017 (UTC)
- Please take a look at WP:SUMMARY. We have a breakout article on Instrumental temperature record and another on Satellite temperature measurements that contain more details and graphs. I think the primary GISS image has a number of advantages (pd, availability, directly from a reliable source), but I would in principle have no objection to use e.g. HadCRUT. I think we should have one of the century-scale temperature records, and I think it should be one of the better-known surface records. --Stephan Schulz (talk) 17:06, 1 February 2017 (UTC)
- I said that the GISS image was fine as one of the images. It, however, does not represent a fair and balanced WP:SUMMARY of the topic. Why only century scale and why only surface records? The satellite records have many advantages over the surface records and they cover the most important period of time from 1979 to the present. Indeed that is the entire period of time during which the global warming discussion has heated up and the IPCC came into existence etc. --TheClarinetGuy talk 17:20, 1 February 2017 (UTC)
- Indeed the second graphic on the page now is not a "century-scale" temperature record, it goes from 1950 to 2014. --TheClarinetGuy talk 17:51, 1 February 2017 (UTC)
- Climate is the long-term average of weather. "Long-term" is often defined as "30 years" in this context (i.e. around 2.5 of the 11-year solar cycles). 1979 to now is only 38 years, which is not much longer than the averaging period. That's why I think we should use one of the century-scale records. And with that assumption, it needs to be one of the surface records, because we don't have RSS and satellite records going back much further. Moreover, surface temperature is what people, glaciers, animals and fauna experience directly. You keep claiming that GISS is not fair and balanced, and so far we only had one person that claims he can distinguish the major records without labels (and he made one of them, which gives him a somewhat unfair advantage ;-). I maintain that NASA, NOAA and HadCRUT all transport essentially the same message. As for the second image: That is not a temperature graph, but only shows the difference between two point in time. I suspect that we (as in "the scientific community") don't have a good enough spatial coverage to produce a similar map for longer periods of time. --Stephan Schulz (talk) 17:59, 1 February 2017 (UTC)
- First, as you point out, 38 years is considered a valid period of time over which to look at global temperature trends. Second, 1979 to the present, as I stated, includes the entire history of this scientific debate from even before the formation of the IPCC. The question of WP:BALANCE and WP:PROPORTION would seem to require that we not ignore the significantly different results that satellite, and radiosonde data have been showing us over the past approximately 40 years, and especially in the most recent 20 of those 40 years. As for the second image, it is a temperature chart showing the temperature trend between 1950 and 2014. And temperature trends are available going further back in time, and the coverage is quite complete. Here for example is a NASA GISS annual temperature trend from 1900 to 2016. --TheClarinetGuy talk 21:44, 1 February 2017 (UTC)
- I'm sorry, but if you need a 30 year average to determine climate, 38 years just gives you 8 years of useful data points - to few for good statistics. Of course you can visualise this, but it lacks context (and the last valid data point would be 2002...). Do you know what spatial resolution means in this context? --Stephan Schulz (talk) 12:27, 2 February 2017 (UTC)
- I favor moving the general discussion of this sort to user talk. Cohler has promised to produce draft text for an article edit with supporting reference. Per the TPG I suggest we just muzzle the dialogue until Cohler fulfills this promise. NewsAndEventsGuy (talk) 14:27, 2 February 2017 (UTC)
- I'm sorry, but if you need a 30 year average to determine climate, 38 years just gives you 8 years of useful data points - to few for good statistics. Of course you can visualise this, but it lacks context (and the last valid data point would be 2002...). Do you know what spatial resolution means in this context? --Stephan Schulz (talk) 12:27, 2 February 2017 (UTC)
- First, as you point out, 38 years is considered a valid period of time over which to look at global temperature trends. Second, 1979 to the present, as I stated, includes the entire history of this scientific debate from even before the formation of the IPCC. The question of WP:BALANCE and WP:PROPORTION would seem to require that we not ignore the significantly different results that satellite, and radiosonde data have been showing us over the past approximately 40 years, and especially in the most recent 20 of those 40 years. As for the second image, it is a temperature chart showing the temperature trend between 1950 and 2014. And temperature trends are available going further back in time, and the coverage is quite complete. Here for example is a NASA GISS annual temperature trend from 1900 to 2016. --TheClarinetGuy talk 21:44, 1 February 2017 (UTC)
- Climate is the long-term average of weather. "Long-term" is often defined as "30 years" in this context (i.e. around 2.5 of the 11-year solar cycles). 1979 to now is only 38 years, which is not much longer than the averaging period. That's why I think we should use one of the century-scale records. And with that assumption, it needs to be one of the surface records, because we don't have RSS and satellite records going back much further. Moreover, surface temperature is what people, glaciers, animals and fauna experience directly. You keep claiming that GISS is not fair and balanced, and so far we only had one person that claims he can distinguish the major records without labels (and he made one of them, which gives him a somewhat unfair advantage ;-). I maintain that NASA, NOAA and HadCRUT all transport essentially the same message. As for the second image: That is not a temperature graph, but only shows the difference between two point in time. I suspect that we (as in "the scientific community") don't have a good enough spatial coverage to produce a similar map for longer periods of time. --Stephan Schulz (talk) 17:59, 1 February 2017 (UTC)
- Please take a look at WP:SUMMARY. We have a breakout article on Instrumental temperature record and another on Satellite temperature measurements that contain more details and graphs. I think the primary GISS image has a number of advantages (pd, availability, directly from a reliable source), but I would in principle have no objection to use e.g. HadCRUT. I think we should have one of the century-scale temperature records, and I think it should be one of the better-known surface records. --Stephan Schulz (talk) 17:06, 1 February 2017 (UTC)
- @Dmcq: Above in this conversation, I responded to your query about this here saying "I think it would make sense to show one terrestrial data set, one lower troposphere, and one radiosonde, dont you?" And yes, I thought that I made it clear that I would be happy if the article did what I suggested in response to your question, namely use a graphic from one of the terrestrial data sets I listed (which obviously could be the GISS charts that are already there), a graphic from one of the satellite datasets, and one from the radiosonde datasets. I would recommend choosing graphics that show the differences between those datasets. --TheClarinetGuy talk 15:03, 1 February 2017 (UTC)
Cohler has said (s)he seeks agreement-in-general prior to proposing specific edits, however Cohler has sought support for his/her views with citation to the DailyCaller and vague group discussions in Google Groups. Given the low quality of those sources I have a heightened degree of caution about any other could-mean-anything general ideas in this thread. We're all in favor of a great article and proper balance. But despite all the text I'm not convinced there is a problem with the existing text. HOWEVER.... I think we'd all welcome the chance to take a fresh look at any specific draft text supported by cites to RS references. You can post draft text here, or you can just edit the article to show us what you mean. If there are no objections it won't be reverted, but if revert does happen that's OK... the reverted text will still show us something with tangible text and references to debate. NewsAndEventsGuy (talk) 18:51, 1 February 2017 (UTC)
- Your statement doesn't fairly represent what I have stated here. My citations of Washington Times, Daily Caller, and Google groups were in response to queries asking about the "controversy" surrounding the GISS data. Controversies are not generally written about in the peer-reviewed scientific literature but rather in newspapers and blogs and the like, that's why I provided those valid references. I also provided a recent peer-reviewed journal article totally on point to support inclusion of information about UAH, RSS and perhaps other graphs that use different methodologies and show significantly different results noticeable by even the casual reader. In any case, this is a discussion, not a game of WP "gotcha" which you seem to enjoy playing here. As nobody else has made any constructive proposals in response to any of my suggestions, I will put together a specific suggested edit to the page including sources etc. and present it here rather than directly editing the page. I should be able to finish that over the next two days. --TheClarinetGuy talk 21:24, 1 February 2017 (UTC)
- In re to your promise to "put together a specific suggested edit to the page including sources etc" I say wonderful; anyone who reviews my remarks will discover that is precisely what I requested in my first comment in this thread. NewsAndEventsGuy (talk) 22:44, 1 February 2017 (UTC)
- The controversy should really be documented somewhere a bit reliable. This shows the problem I have with the expectation that people do things here without being specific what exactly. Practically anything in climate science is controversial if one includes blogs and suchlike. Why are you saying 'perhaps other graphs' except if you haven't actually checked? I keep getting the feeling work is being asked for without the expectation that you won't raise other objections about whatever else is used. Dmcq (talk) 21:38, 1 February 2017 (UTC)
- What would you consider a reliable source for documenting a controversy if not an old, well-established, major metropolitan newspaper such as the Washington Times? As for 'perhaps other graphs' I am referring to the fact that I have repeatedly mentioned the radiosonde data as well, and the Tellus A article I cited above also presents another data set that might be a good choice as well. Perhaps you haven't had a chance to read the article yet, but it discusses a recent "re-analysis" from the European Centre for Medium-Range Weather Forecasts (ECMWF) called the ECMWF Interim Reanalysis (ERAI) data set.[1]
- --TheClarinetGuy talk 22:13, 1 February 2017 (UTC)
- No I think the Washington Times can qualify under RS now and no longer should just be dismissed as Moonies. However the article about it did not have anything much to say about the data. As I said before one can go and get such articles about anything in climate change, e.g. after the NASA one you have NOAA [23], UK Met office [24], and BEST [25] just to show how easy it is. That is why seeing which ones you would be happy about is so important rather than just grabbing a list using google. Dmcq (talk) 23:36, 1 February 2017 (UTC)
- Ok, lets have a glance at what the Washington Times reports: "Christopher C. Horner, a senior fellow at the Competitive Enterprise Institute, said NASA has refused for two years to provide information under the Freedom of Information Act that would show how the agency has shaped its climate data and explain why the agency has repeatedly had to correct its data dating as far back as the 1930s." So what? A lawyer at a fossil-fuel funded climate change denial lobby group issued a fake statement about climate science. Not news, and doesn't deserve any weight in this article about science. The relevant topic is already covered under Global warming#Discussion by the public and in popular media which, by a remarkable coincidence, mentions "Organizations such as the libertarian Competitive Enterprise Institute," . . dave souza, talk 01:23, 2 February 2017 (UTC)
- @Dave souza: This is a specious argument. By your argument, any news organization, no matter how well established and known as a reliable source, becomes an unreliable source when it quotes someone with whom you disagree. Established news organizations are responsible for fact checking and balance as part of their basic journalistic responsibility. So your dismissal of this particular article because it happens to quote somebody with whom you disagree is incorrect. As it says at WP:NEWSORG ""News reporting" from well-established news outlets is generally considered to be reliable for statements of fact". Washington Times is clearly a well-established news outlet. And whether a controversy exists, is a self-evident fact, a well established news organization does not report on a "controversy" where none exists because that would be lying, something that reliable well-established news organizations don't do. So you are simply wrong here. --TheClarinetGuy talk 18:31, 4 February 2017 (UTC)
- He did not say it is an unreliable source. He said it is not news and does not deserve weight. Nobody here doubts that Horner thinks like that, and the source probably reliably reproduced what he said. --Hob Gadling (talk) 13:42, 6 February 2017 (UTC)
- @Dave souza: This is a specious argument. By your argument, any news organization, no matter how well established and known as a reliable source, becomes an unreliable source when it quotes someone with whom you disagree. Established news organizations are responsible for fact checking and balance as part of their basic journalistic responsibility. So your dismissal of this particular article because it happens to quote somebody with whom you disagree is incorrect. As it says at WP:NEWSORG ""News reporting" from well-established news outlets is generally considered to be reliable for statements of fact". Washington Times is clearly a well-established news outlet. And whether a controversy exists, is a self-evident fact, a well established news organization does not report on a "controversy" where none exists because that would be lying, something that reliable well-established news organizations don't do. So you are simply wrong here. --TheClarinetGuy talk 18:31, 4 February 2017 (UTC)
- Personally, I think we frequently get sucked back in to vague WP:FORUM type discussions instead of just waiting silently for specific proposed text. Vague discussions of balance or sources devoid of context are more in the category of general discussion, with exceedingly low signal-to-noise ratio. Cohler has promised to produce a proposed change to the text of the article. Me quiet, me wait. NewsAndEventsGuy (talk) 01:33, 2 February 2017 (UTC)
- Yes that sort of covers my concern.. I think perhaps the question about controversy should have been put at Global warming controversy first and if there was problems then certainly something should be done about it. However the only controversy about NASA data there seems to be about them having censored climate change data during the Bush administration, basically suppressing inconvenient truth like the current administration is set to do. Dmcq (talk) 08:58, 2 February 2017 (UTC)
- What was I just saying? NewsAndEventsGuy (talk) 11:06, 2 February 2017 (UTC)
- Yes that sort of covers my concern.. I think perhaps the question about controversy should have been put at Global warming controversy first and if there was problems then certainly something should be done about it. However the only controversy about NASA data there seems to be about them having censored climate change data during the Bush administration, basically suppressing inconvenient truth like the current administration is set to do. Dmcq (talk) 08:58, 2 February 2017 (UTC)
- Ok, lets have a glance at what the Washington Times reports: "Christopher C. Horner, a senior fellow at the Competitive Enterprise Institute, said NASA has refused for two years to provide information under the Freedom of Information Act that would show how the agency has shaped its climate data and explain why the agency has repeatedly had to correct its data dating as far back as the 1930s." So what? A lawyer at a fossil-fuel funded climate change denial lobby group issued a fake statement about climate science. Not news, and doesn't deserve any weight in this article about science. The relevant topic is already covered under Global warming#Discussion by the public and in popular media which, by a remarkable coincidence, mentions "Organizations such as the libertarian Competitive Enterprise Institute," . . dave souza, talk 01:23, 2 February 2017 (UTC)
- No I think the Washington Times can qualify under RS now and no longer should just be dismissed as Moonies. However the article about it did not have anything much to say about the data. As I said before one can go and get such articles about anything in climate change, e.g. after the NASA one you have NOAA [23], UK Met office [24], and BEST [25] just to show how easy it is. That is why seeing which ones you would be happy about is so important rather than just grabbing a list using google. Dmcq (talk) 23:36, 1 February 2017 (UTC)
References
- ^ Dee, D. P.; et al. (2011). "The ERA-Interim re-analysis: configuration and performance of the data assimilation system". Quart. J. Roy. Meteor. Soc. 137: 553-597.
{{cite journal}}: Explicit use of et al. in:|first1=(help)
graph of ocean temp
As well as surface temperature being of more immediate concern to humans than ocean temperature there is also the problem that the ocean is a huge heat sink. Currently it counteracts the warming on land, but if the warming continues the long lag in it will make it harder to keep the temperature down in the future. Anyway it doesn't really illustrate the current problem since it foes have a long lag. It therefore is useful to climate scientists but would just be another source of confusion if put in the lead of the article. If desired it can be put further don with a proper explanation. Dmcq (talk) 20:21, 1 February 2017 (UTC)
- I'm not agreeing that "it" can be put anywhere, until someone shows the proposed contents of "it". NewsAndEventsGuy (talk) 20:57, 1 February 2017 (UTC)
Proposal for some additional graphics
Here is one of the graphs I would propose using. It is the latest (Jan 2017) lower troposphere global temperature series from UAH 6.0 shown with raw monthly data and smoothed data, much like the current NASA GISS graph. The data runs from December 1978 to January 2017 which is from the beginning of this satellite data to the present and covers the entire period of time during which warming has occurred since the mid-20th century. As you can see from the NASA GISS graph on the page now, from 1880 to 1910 global temp decreased, from 1910 to mid 1940s it increased, from mid 1940s to mid 1970s it decreased, and from late 1970s to present it increased. So the coverage of the satellites from 1979 to present covers the entire recent warming referenced by the IPCC as since 1951. The graph is by Dr. Roy Spencer, Principal Research Scientist at UAH and he works with NASA as the U.S. Science Team leader for the Advanced Microwave Scanning Radiometer on NASA's Aqua satellite. I contacted him about sourcing and permission for the graph which is published now at the top of his blog. He emailed me back and stated, "I created the graphic, and you are free to use it." How would we proceed from here? I am not familiar with the complete process for including images on WP pages. --TheClarinetGuy talk 23:45, 2 February 2017 (UTC)
- Opposed In the prior part of the discussion, you promised to produce article text with reliable sources, so we know what you're trying to say. If you can produce something that passes muster, I'd be glad to consider an image to help illustrate those additions/changes to the main text. But you didn't do that, and it is still a mystery what you want to communicate. Per Wikipedia:Manual of Style/Images we use images to help convey the information in the article. We now have three images with squiggly lines that show temperature increases. One has a very long time scale. Another shows El Nino cycles. That leaves the GISS graph, which shows warming over the past several decades. Your new graph appears to also show warming over the last several decades. To me it looks redundant. I know you want to claim that there's some sort of something that we really need to describe with some text to cure an alleged balance question, but you haven't actually told us the RSs that support this or what article text you would include. No text, no need to illustrate with a picture. Opposed. NewsAndEventsGuy (talk) 00:55, 3 February 2017 (UTC)
- The series starts long after mid century. I think the one there already is better. One year is too short for smoothing to say anything about climate. Five years is also a bit short but it at least smooths over a few years. Your picking of highs and lows for the sequence of reduces and increases is cherry-picking OR. This series has been involved in a number of controversies and has been regularly and extensively revised which doesn't inspire confidence that it is now reasonably okay. It is also unclear what on earth the Jan 2017 +0.3 deg. C is about. What is the baseline that it is relative to? I think it probably is okay for a scientist but it doesn't work as an illustration in the lead for this article. Dmcq (talk) 01:17, 3 February 2017 (UTC)
- The chosen baseline in the Spencer graphic is 1981-2010 so lost in that average is the 20 years of warming after the IPCC report in 1990. Does the data exist to produce a similar graph for the same time period as the GISS graph, and calculating the baseline over the same time period? NewsAndEventsGuy (talk) 01:52, 3 February 2017 (UTC)
- Does that mean the baseline is the average value between 1981 and 2010? I doubt they are fitting a trend as they take it as an article of faith that any changes are anomalies. That would mean it is the rise in about the last 20 years from about 1995. Anyway it being a beta does rule it out even more than what I was saying. Dmcq (talk) 12:01, 3 February 2017 (UTC)
- The chosen baseline in the Spencer graphic is 1981-2010 so lost in that average is the 20 years of warming after the IPCC report in 1990. Does the data exist to produce a similar graph for the same time period as the GISS graph, and calculating the baseline over the same time period? NewsAndEventsGuy (talk) 01:52, 3 February 2017 (UTC)
- Somewhat neutral - I could see the point of a subsection on tropospheric temperature trends although the article is somewhat bloated already. This would need to include additional data sources (RSS, RATPAC, etc.) as well as a brief discussion of the limitations of the data, such as the greater structural uncertainty in satellite data compared to the surface temperature record. Shock Brigade Harvester Boris (talk) 01:29, 3 February 2017 (UTC)
- I agree it makes sense to cover temp trends other than just the usual one that makes headlines and that this article is already pushing the WP:Article size limits. Maybe do it at Instrumental temperature record or as a section of its own at Troposphere? NewsAndEventsGuy (talk) 01:44, 3 February 2017 (UTC)
- UAH6 is still in beta; so no, we should not use it William M. Connolley (talk) 08:52, 3 February 2017 (UTC)
- No it is not. It was released on April 2015 with the comment from Roy Spencer, "This should be considered a “beta” release of Version 6.0, and we await users’ comments to see whether there are any obvious remaining problems in the dataset. In any event, we are confident that the new Version 6.0 dataset as it currently stands is more accurate and useful than the Version 5.6 dataset". As of the UAH Global Temperature Update for November 2016 published December 1, 2016 it is no longer in beta. --TheClarinetGuy talk 21:15, 3 February 2017 (UTC)
- What I just heard is similar to the following absurdity
- Saying "This is a dime," a man gave me a dime.
- Later I gave the dime to you.
- You said, "Gee thanks for the dime".
- I reply, "No it's not a dime, because the guy that gave it to me said it is."
- If Spencer says the image is beta how on earth can you say it isn't ? But nevermind because it doesn't really matter We don't use images that don't describe the article and so far you have not proposed any article text that would be relevant to this image. NewsAndEventsGuy (talk) 22:04, 3 February 2017 (UTC)
- Well whatever Spencer says is a bit irrelevant to the matter at hand because there are too many problems with the image to use it in the lead of the article. I think it was proposed because it has satellite data in it, but the big problem with satellites is they only started being used very recently in climate or major industrialization terms. Dmcq (talk) 23:25, 3 February 2017 (UTC)
- This statement represents your OR and is not supported by science. This data is used and cited regularly throughout the climate science community. It is not "recent" in terms of the recent global warming which began in the late 1970s precisely when this data became available. --TheClarinetGuy talk 14:24, 4 February 2017 (UTC)
- Radiosonde data just about might be okay for a reasonable period. Perhaps it could be incorporated into the same graph as there already if there really is a desire to have the temperature higher up in the atmosphere included in the lead. Personally I'd keep the lead simple and people live on the ground. Dmcq (talk) 23:48, 3 February 2017 (UTC)
- Saying "people live on the ground" is an irrelevancy. The subject of the article is "Global warming". The question is what is it, how is it measured, etc... It is measured in several ways, and this article grossly over represents the terrestrial measurements (indeed only one of the four major terrestrial sets) and grossly under represents the satellite and radiosonde measurements. --TheClarinetGuy talk 14:29, 4 February 2017 (UTC)
- 'Saying "people live on the ground" is an irrelevancy'?, warming at ground level is the main reason people other than climate scientists are concerned about global warming, and they don't worry overmuch about the troposphere. Wikipedia should address its main audience for a topic especially in the lead. Anyway the satellite data as I said is unsuitable as it only covers a part of the period of interest and radiosonde data would be better for this type of measurement from that point of view. Your ideas the period of interest only being from 1979 is OR and the IPCC say otherwise and even in that you ignore for instance the importance of the strong El Nino during world war 2. The satellite data could go elsewhere or in its own article or with other data further down where proper text could be put beside it but it is unsuitable for the lead. Dmcq (talk) 21:18, 4 February 2017 (UTC)
- Warming at the ground level is one of the many effects of Global warming. And indeed it has been verified by long-term measurement that Global warming from GHGs causes warming at the ground, warming in the troposphere, and cooling in the stratosphere. All of these things are related to each other and predicted to varying degrees by scientific understanding. In science, we look for verification based upon independent empirical evidence. Currently, there are at least three long-term documented, reliable, and highly cited methods of documenting the warming that has taken place: ground-based thermometers, satellite measurements, and radiosondes. One method of measurement is not more important than another because "people live on the ground". All three methods measure Global warming. --TheClarinetGuy talk 12:45, 5 February 2017 (UTC)
- 'Saying "people live on the ground" is an irrelevancy'?, warming at ground level is the main reason people other than climate scientists are concerned about global warming, and they don't worry overmuch about the troposphere. Wikipedia should address its main audience for a topic especially in the lead. Anyway the satellite data as I said is unsuitable as it only covers a part of the period of interest and radiosonde data would be better for this type of measurement from that point of view. Your ideas the period of interest only being from 1979 is OR and the IPCC say otherwise and even in that you ignore for instance the importance of the strong El Nino during world war 2. The satellite data could go elsewhere or in its own article or with other data further down where proper text could be put beside it but it is unsuitable for the lead. Dmcq (talk) 21:18, 4 February 2017 (UTC)
- Saying "people live on the ground" is an irrelevancy. The subject of the article is "Global warming". The question is what is it, how is it measured, etc... It is measured in several ways, and this article grossly over represents the terrestrial measurements (indeed only one of the four major terrestrial sets) and grossly under represents the satellite and radiosonde measurements. --TheClarinetGuy talk 14:29, 4 February 2017 (UTC)
- @NewsAndEventsGuy: You need to read everything I wrote before responding. Not take it out of context. First, he didn't say it is a beta release, he said it should be "considered" a beta release, and in any case, as of the temperature update for November 2016, it is no longer considered beta. I gave the citation. Go look for yourself. --TheClarinetGuy talk 14:21, 4 February 2017 (UTC)
- Re You need to read everything I wrote before responding. I carefully read each comment following WP:Assume good faith. You have made claimed there is imbalance you have pointed to a graph, you have pointed to a google group discussion, to a Wash Times pieced quoting someone from CEI, but what you have not yet done is provided the text of a proposed article edit for which any of this discussion matters. I decline to just jam in the graph without text in the body of the article that needs to be illustrated with the graph. I decline to just tack on the Wash times cite to some random sentence. I'll ask once more before I start thinking about a formal complaint at WP:Arbitration Enforcement. Would you please provide us with the actual text of a proposed article edit including citation to the alleged WP:Reliable source you think meets our WP:Verification policy? NewsAndEventsGuy (talk) 19:20, 4 February 2017 (UTC)
- Well I don't find myself agreeing with you often but I do on this. Text should be added to the body of an article first - the article should not be written in the lead and the lead should summarize he article. The lead is already too long and putting something there without developing the body first is just wrong. Dmcq (talk) 21:18, 4 February 2017 (UTC)
- Re You need to read everything I wrote before responding. I carefully read each comment following WP:Assume good faith. You have made claimed there is imbalance you have pointed to a graph, you have pointed to a google group discussion, to a Wash Times pieced quoting someone from CEI, but what you have not yet done is provided the text of a proposed article edit for which any of this discussion matters. I decline to just jam in the graph without text in the body of the article that needs to be illustrated with the graph. I decline to just tack on the Wash times cite to some random sentence. I'll ask once more before I start thinking about a formal complaint at WP:Arbitration Enforcement. Would you please provide us with the actual text of a proposed article edit including citation to the alleged WP:Reliable source you think meets our WP:Verification policy? NewsAndEventsGuy (talk) 19:20, 4 February 2017 (UTC)
- Well whatever Spencer says is a bit irrelevant to the matter at hand because there are too many problems with the image to use it in the lead of the article. I think it was proposed because it has satellite data in it, but the big problem with satellites is they only started being used very recently in climate or major industrialization terms. Dmcq (talk) 23:25, 3 February 2017 (UTC)
- What I just heard is similar to the following absurdity
- No it is not. It was released on April 2015 with the comment from Roy Spencer, "This should be considered a “beta” release of Version 6.0, and we await users’ comments to see whether there are any obvious remaining problems in the dataset. In any event, we are confident that the new Version 6.0 dataset as it currently stands is more accurate and useful than the Version 5.6 dataset". As of the UAH Global Temperature Update for November 2016 published December 1, 2016 it is no longer in beta. --TheClarinetGuy talk 21:15, 3 February 2017 (UTC)
Resulting article edit
- Housekeeping, This thread has produced an article edit that changes the old text
- The average temperature of the lower troposphere has increased between 0.13 and 0.22 °C (0.23 and 0.40 °F) per decade since 1979, according to satellite temperature measurements.
- to new text
- The average temperature of the lower troposphere has increased between 0.12 and 0.135 °C (0.216 and 0.243 °F) per decade since 1979, according to satellite temperature measurements.[1][2]
- Great, let's discuss
- NewsAndEventsGuy (talk) 16:37, 5 February 2017 (UTC)
- Housekeeping, This thread has produced an article edit that changes the old text
My comment was in response and in reference to your sarcastic comment about "Spencer says". As for text, it already exists in the article, and I have just updated it with the correct, most recent numbers and added citations, which were completely missing for those numbers. I would also appreciate it if you didn't keep issuing veiled and unveiled threats in response to my purely professional and scientific discussion here. I absolutely do assume good faith on your part here and hope that you will do so as well. I would add that I have already stated several times the sources that I believe meet WP:RS and WP:Verification in a list I proposed above. But in any case, here I will repeat that UAH and RSS both satisfy those criteria and have already been used repeatedly on Wikipedia as sources for satellite data and information. --TheClarinetGuy talk 13:04, 5 February 2017 (UTC)
- Thanks for telling us, via the diff in your prior comment, exactly what you wanted to change in the article. For me, this is where the real discussion begins. NewsAndEventsGuy (talk) 16:29, 5 February 2017 (UTC)
- So exactly why didn't you try putting your graph in that section first? Why are you so insistent that practically duplicate and limited time information be shoved in the lead? At its current size I think you should start thinking about what should be taken out of the lead if something is shoved in and I'm pretty certain this is not sufficiently different or notable to warrant anything like that. If we had got no satellite data it would not make much difference to the article or to the science or the main effects people are interested in or public policy -it just makes checking the science and fixing problems easier. Dmcq (talk) 14:00, 5 February 2017 (UTC)
I've been trying to look into the status of UAH v6.0 and have been finding it surprisingly difficult. RSS has a clear and professionally-organized web page where you can obtain the data set along with detailed information on methodology, verification studies, and the like (here). All I can find on UAH v6.0 is blog posts. Does anyone know if there is an official repository with documentation for UAH v6.0? Shock Brigade Harvester Boris (talk) 15:02, 4 February 2017 (UTC)
- The parent directory for all the UAH MSU data is here on the website of the National Space Science and Technology Center (joint venture with NASA) of University of Alabama Huntsville. The directory structure is very clear and used widely by the climate science community. Indeed even organizations such as NASA and NOAA use this data. Dr. Roy Spencer provides updates about the data regularly in his blog, and the data itself is used and cited in numerous peer reviewed articles over the last four decades. --TheClarinetGuy talk 13:53, 5 February 2017 (UTC)
- Yeah Spencer's blog. Well he's entitled to give his opinion on policy matters even if he supports Trump who wants to stop scientists giving theirs. I must admit to just feeling disgust for his business about that just forgetting about global warming will help millions of people not starve - and immediately next talks about about how awful it is that the UN tries to get some rich countries to help poor countries cope. People have an amazing capacity to delude themselves into believing two contradictory things at once. But anyway the problem is that there was going to be some review of the methods used where since there was a complete rewrite in 2015 but now he's declared it all out of beta and I haven't seen this review. Even so I am not objecting to the graph being put in the section beside the text about the satellite data though I was as I said before wondering where exactly the arrow at the end and the figure beside it came from. Perhaps that can be deleted as there seems no straightforward explanation plus the placement of the base line seems rather arbitrary being the average of half of the graph as far as I can make out. Dmcq (talk) 14:47, 5 February 2017 (UTC)
- It would be OK to include a plot of upper-atmospheric temperature trends, but not this specific graph. It uses only one data source and the quality of the plot is mediocre at best. Shock Brigade Harvester Boris (talk) 15:00, 5 February 2017 (UTC)
- Yeah Spencer's blog. Well he's entitled to give his opinion on policy matters even if he supports Trump who wants to stop scientists giving theirs. I must admit to just feeling disgust for his business about that just forgetting about global warming will help millions of people not starve - and immediately next talks about about how awful it is that the UN tries to get some rich countries to help poor countries cope. People have an amazing capacity to delude themselves into believing two contradictory things at once. But anyway the problem is that there was going to be some review of the methods used where since there was a complete rewrite in 2015 but now he's declared it all out of beta and I haven't seen this review. Even so I am not objecting to the graph being put in the section beside the text about the satellite data though I was as I said before wondering where exactly the arrow at the end and the figure beside it came from. Perhaps that can be deleted as there seems no straightforward explanation plus the placement of the base line seems rather arbitrary being the average of half of the graph as far as I can make out. Dmcq (talk) 14:47, 5 February 2017 (UTC)
I'll just note that the "old" text in the housekeeping note abovet appears to have been added (in a different section) 'way 'way back in 2004 sometime, and near as I can tell it has never had a citation to a supporting RS... (wikilink to the other article doesn't count). NewsAndEventsGuy (talk) 16:57, 5 February 2017 (UTC)
refs for this subsection
References
- ^ "UAH v6.0 TLT data" (trend data at bottom of file). nsstc.uah.edu. The National Space Science & Technology Center. Retrieved 3 February 2017.
{{cite web}}: Cite has empty unknown parameter:|dead-url=(help) - ^ "Upper Air Temperature: Decadal Trends". remss.com. Remote Sensing Systems. Retrieved 3 February 2017.
Return to Spencer Graph discussion
FYI, Dr. Roy Spencer works with NASA in the joint venture between UAH and NASA as the U.S. Science Team leader for the Advanced Microwave Scanning Radiometer flying on NASA’s Aqua satellite. He is a preeminent, award-winning scientist with numerous peer-reviewed articles to his credit on this precise subject. I don't understand all the off-topic comments here about politics and other WP:OR with claims such as "the quality of the plot is mediocre at best". According to whom? And "It uses only one data source" which is true of nearly all the graphics on the page, and is not a valid reason for excluding a graph. Can we please stick to the scientific discussion here? The graph I proposed is the official, accurate, most up to date, properly sourced graph on the subject of lower-troposphere global temperature measurements. As far as I can see here, nobody has given a valid scientific, sourcing, or verifiability reason against using the graph. Just some off-topic discussion of politics and WP:OR opinions. --TheClarinetGuy talk 18:16, 5 February 2017 (UTC)
- The off topic comments about his politics was because you pointed at his blog as the place to find some science answers from but it is full of his bullshit politics and the answers are not there or are very hard to find. Why could he not separate his science from his religious and libertarian views and have a status page for the results and graphs? Dmcq (talk) 20:25, 5 February 2017 (UTC)
- @Dmcq: Untrue. The blog post I pointed to was the currently posted, purely scientific post that has no mention of politics in it whatsoever. The title of the post is "UAH Global Temperature Update for January, 2017: +0.30 deg. C February 1st, 2017." --TheClarinetGuy talk 08:17, 6 February 2017 (UTC)
- You wrote just before that "Dr. Roy Spencer provides updates about the data regularly in his blog" and talking about scientists regularly citing that blog. Please check your facts first. I found only one item about the science at the top which I presume is being used as an advertisement for people to read the rest of the stuff. And even that one item was just him restating data and putting out the graph with his own silly markup. Dmcq (talk) 09:02, 6 February 2017 (UTC)
- @Dmcq: Untrue. The blog post I pointed to was the currently posted, purely scientific post that has no mention of politics in it whatsoever. The title of the post is "UAH Global Temperature Update for January, 2017: +0.30 deg. C February 1st, 2017." --TheClarinetGuy talk 08:17, 6 February 2017 (UTC)
@Dmcq: As for the arrow at the end of the graph, that is simply pointing out that in January 2017—the most recent month—the global lower troposphere temperature anomaly (i.e. difference from the base period) is +0.30 ºC (which is an increase from December, which was 0.24ºC, as you can see in the raw data here or on his blog here). --TheClarinetGuy talk 18:25, 5 February 2017 (UTC)
- Thank you for one of the many reasons why the graph is "mediocre at best." There's no scientific reason for pointing out the most recent data point on a graph that is meant to convey long-term trends. More broadly, Spencer needs to read Tufte (as do many scientists). Shock Brigade Harvester Boris (talk) 18:34, 5 February 2017 (UTC)
- According to whom? The graph shows the entire period from 1979 to the present. Again, that's your opinion about proper graph labeling, and not the opinion of the renowned U.S. Science Team leader for the project. You keep making unsourced WP:OR statements, please cite a source for such a statement. --TheClarinetGuy talk 18:45, 5 February 2017 (UTC)
- As I pointed out before it is not obvious that the baseline is some average between 1980 and 2010 or what the meaning of picking some baseline like that is. Would it not be far better to show the trend over a decade or more which would actually be something people could use? Will he change the baseline to have the end year change when we get to 2020 for instance? That would certainly help bring down the anomalies! And I fully agree with Shock Brigade Harvester Boris, the month by month business is weather, not climate. Just because he is renowned doesn't mean his graphs are marvels of exposition n ever mind relevance. Dmcq (talk) 20:25, 5 February 2017 (UTC)
- @Dmcq: The baseline period is simply the period of time which is averaged to choose the 0 point on the y-axis, and has no effect whatsoever on trends. It is an arbitrary decision to choose where 0 lies on the y-axis. An "anomaly" graph is showing differences from a chosen 0 point, that's all. But when we are talking about trends, i.e. the slope of the temperature change per decade, the 0 point on the y-axis is irrelevant. --TheClarinetGuy talk 07:10, 6 February 2017 (UTC)
- I'm glad you acknowledge that trends are important. But that is not what he is doing. A trend is a change/time. He gives a change from a baseline which does not start at a defined time. The only good reason for doing something like that is if there is no trend. If we were talking about trends we'd be doing a regression fit to a line or smoothing over a longer period than one year say 10 years which is near to a solar cycle and would remove part of the confounding factors he thinks are important. I hope you're starting to understand why others see a problem with that graph. Dmcq (talk) 09:13, 6 February 2017 (UTC)
- @Dmcq: The baseline period is simply the period of time which is averaged to choose the 0 point on the y-axis, and has no effect whatsoever on trends. It is an arbitrary decision to choose where 0 lies on the y-axis. An "anomaly" graph is showing differences from a chosen 0 point, that's all. But when we are talking about trends, i.e. the slope of the temperature change per decade, the 0 point on the y-axis is irrelevant. --TheClarinetGuy talk 07:10, 6 February 2017 (UTC)
- As I pointed out before it is not obvious that the baseline is some average between 1980 and 2010 or what the meaning of picking some baseline like that is. Would it not be far better to show the trend over a decade or more which would actually be something people could use? Will he change the baseline to have the end year change when we get to 2020 for instance? That would certainly help bring down the anomalies! And I fully agree with Shock Brigade Harvester Boris, the month by month business is weather, not climate. Just because he is renowned doesn't mean his graphs are marvels of exposition n ever mind relevance. Dmcq (talk) 20:25, 5 February 2017 (UTC)
- According to whom? The graph shows the entire period from 1979 to the present. Again, that's your opinion about proper graph labeling, and not the opinion of the renowned U.S. Science Team leader for the project. You keep making unsourced WP:OR statements, please cite a source for such a statement. --TheClarinetGuy talk 18:45, 5 February 2017 (UTC)
- @Cohler, I acknowledge your frustration, but you took a long time showing us article text that makes the graph matter. There is a housekeeping hurdle that ALL images has to overcome, and that's licensing. The prefered repository for all of our graphics is the Wikipedia Commons. Using the upload utility try to post the graph. There will be a section where you have to describe the authority by which we have legal permission to use the image. Unless something else fulfills that rule, you may need Dr Spencer to release a copy with the appropriate creative commons license. I'm not saying this to be difficult, I've run into the precise same objections when I have tried to upload stuff. There are eds who patrol images and pounce on copyvio problems - or even the possibility of problems - regardless of subject or content. You'll also have to describe the RSs on which the graph is based. Once the image is loaded to the commons and objections have been resolved it is available for use at any article whenever appropriate, though each articles editors may disagree on whether its an improvement to that specific venue. Anyway, if you want to push the graph (or any image) like all of us you'll have to document satisfactory licensing NewsAndEventsGuy (talk) 18:39, 5 February 2017 (UTC)
- No frustration here. But thank you. I didn't know there was a time limit on these things. I have been working on many different things, including my full time career as a clarinetist and teacher, and trying to make a valuable contribution here while learning and trying to not come off like I am trying to dictate anything. This is a joint effort after all is it not? Thank you for the information on image uploading. Do all images go through Commons? Or is there another simpler method where they can go directly onto Wikipedia? --TheClarinetGuy talk 18:49, 5 February 2017 (UTC)
- You can see commons:File:Smart_waterbomb.jpeg where I got permission from the designer of a model even though I made it myself. The data for that graph should be available for someone here to make a graph if asked but the original would be copyright Spencer. Dmcq (talk) 20:32, 5 February 2017 (UTC)
- See Help:Introduction_to_images_with_Wiki_Markup/4 "it is generally better to upload your free images to Wikimedia Commons, a shared site where an image can be uploaded once and then used by any of these projects"; also the tab for "free use" says in part "If you are contributing an image which is your own work, the simplest option is to release it under the Creative Commons Attribution-ShareAlike license. " IF Spencer wants to release it under that license, then it can be uploaded subject to our other rules like verifiability... it would need to be a fair presentation of the underlying data, and if that's not WP:SKYISBLUE obvious to people, you might need an RS that says the graph presents the data. I'm not an image-policy expert, but we do have resource poeple who can help with that. Not sure offhand how to fidn them, but you can do your own looking without much trouble if you need help. For one thing, ask at WP:Reference desk NewsAndEventsGuy (talk) 20:42, 5 February 2017 (UTC)
- No frustration here. But thank you. I didn't know there was a time limit on these things. I have been working on many different things, including my full time career as a clarinetist and teacher, and trying to make a valuable contribution here while learning and trying to not come off like I am trying to dictate anything. This is a joint effort after all is it not? Thank you for the information on image uploading. Do all images go through Commons? Or is there another simpler method where they can go directly onto Wikipedia? --TheClarinetGuy talk 18:49, 5 February 2017 (UTC)
The entire discussion of "beta" seems like a red-herring. FIrst, the data is not and never was "beta" in the traditional sense of the word which means a "pre-release". It was completely released from the first day it was released back in 2015. Which is why Spencer said it could be "considered beta" although they released it to the public, it continues to be used and cited, and he stated at initial release, "we are confident that the new Version 6.0 dataset as it currently stands is more accurate and useful than the Version 5.6 dataset". If you want to get into questions of the validity of various datasets and the numerous updates that are made to them, there are many such questions all the time. Those questions are resolved by the scientists and organizations who publish the data, not by us here. But at any given point in time, like now, the released data is the released data. And the UAH 6.0 data is what it is, it is the current official, reliable, non-beta, released data of UAH 6.0. Seems pretty clear and simple. Do you have any support for saying that the UAH 6.0 data is unreliable data? The whole point of science is new research is being done all the time and data improvements are made all the time. Indeed the NASA GISS data has been updated many times as have been all the data sets. We should be citing and sourcing to the most recent versions of the official data sets, not doing our own WP:OR here and second guessing the data sets themselves. --TheClarinetGuy talk 18:42, 5 February 2017 (UTC)
- You use the plural "data sets," so I'm sure you'll agree that we should include more than just UAHv6.0. This graph would be an excellent starting point as it includes UAH, RSS, and the HadAT radiosonde analysis (and is much more clearly presented than Spencer's graph). Shock Brigade Harvester Boris (talk) 19:13, 5 February 2017 (UTC)
- Other graphs are fine as I have said repeatedly. The graph you propose here, however, is very out of date and seems to end 3 or more years ago, and uses multiple generations of old versions of all the datasets mentioned. So I would definitely be against this particular graph as it is clearly out of date. --TheClarinetGuy talk 19:29, 5 February 2017 (UTC)
- For example here is the most recent RSS data with a trendline showing the RSS figure of 0.135ºC per decade. While it has a trend line in the graph, and it has the correct, most recent data, it doesn't have the smoothed curve as in the Spencer graph or the NASA GISS graph at the top of the article that everybody seemed to like. --TheClarinetGuy talk 19:33, 5 February 2017 (UTC)
- That's a nice, clean graph. Still, it would be best to find one that includes multiple data sets. If that's not possible someone could download and plot the data. (Any volunteers?) Shock Brigade Harvester Boris (talk) 19:42, 5 February 2017 (UTC)
- John Christy's testimony to Congress on February 2, 2016 also contains several good graphics showing averaged trend lines of all the satellite and radiosonde datasets versus the CMIP5 models of AR5 showing the agreement of the satellite and radiosonde information and their wide divergence from the model runs. The RSS website also contains an excellent graphic here showing the divergence of its lower troposphere measurements from the CMIP5 models here (see Fig. 1) . And I thought that downloading and plotting the data was WP:OR isn't it? --TheClarinetGuy talk 19:45, 5 February 2017 (UTC)
- That's a nice, clean graph. Still, it would be best to find one that includes multiple data sets. If that's not possible someone could download and plot the data. (Any volunteers?) Shock Brigade Harvester Boris (talk) 19:42, 5 February 2017 (UTC)
When evaluating any two graphs, A or B, I favor the one that is discussed in a WP:SECONDARY source of significant WP:WEIGHT, rather than relying on the judgment of wikipedia editors. What's the best graph to be discussed in such a source? As equivalent sources with more recent versions get published, then we can update.NewsAndEventsGuy (talk) 19:47, 5 February 2017 (UTC)
- Downloading and plotting data isn't WP:OR as long as it's a straightforward representation of the data. We even have instructions at Wikipedia:How to create charts for Wikipedia articles. Shock Brigade Harvester Boris (talk) 21:03, 5 February 2017 (UTC)
- I knew that and I said nothing about OR. Are you guys debating which dataset or which graph to use? I thought you were, and was opining that the way to pick between the options is the way that best avoids UNDUE by selecting the graph discussed in SECONDARY sources with greatest weight. If there's no debate about which graph or data set to use, then nevermind. NewsAndEventsGuy (talk) 00:02, 6 February 2017 (UTC)
- Sorry, that was meant for User:Cohler aka TheClarinetGuy. Shock Brigade Harvester Boris (talk) 00:05, 6 February 2017 (UTC)
- Oh, apologies right back at ya, Boris. Damn those ambiguous indents.... NewsAndEventsGuy (talk) 11:14, 6 February 2017 (UTC)
- Sorry, that was meant for User:Cohler aka TheClarinetGuy. Shock Brigade Harvester Boris (talk) 00:05, 6 February 2017 (UTC)
- @Shock Brigade Harvester Boris: If what you are saying is correct, then I guess I was under the mistaken impression from some comments made previously on this page that plotting the data ourselves was considered WP:OR. If that is not the case, I would be happy to put together a graph that uses the most recent data from five of the major sources with trend lines, caption, and citations to the most recent data from all referenced sources. Is that acceptable to all here? I would recommend the following sources all plotted with co-terminating trend lines from 1979 through 2016 (the entire range of the satellite data), which includes essentially all of the IPCC-referenced post-1950 global warming, as you can see in the NASA GISTEMP (LOTI) graph below (the one that is at the top of the article). All of these data sources are widely cited, readily available, and easily accessible. Furthermore, the 37-year period from 1979 through 2016 is well over the the typical 30-year climate averaging period.[1]

- Terrestrial - NASA GISTEMP, and UK Met Office HadCRUT4
- Satellite - RSS 3.3, UAH 6.0
- Radiosonde - NOAA RATPAC-A
- I believe a graph such as I have described above would bring this article up to date in a major way, and help the reader to see—in a single image—where things stand, with a balanced representation of the most recent global warming information from all three types of measuring methodologies. If all agree, I would be happy to do this.
- I knew that and I said nothing about OR. Are you guys debating which dataset or which graph to use? I thought you were, and was opining that the way to pick between the options is the way that best avoids UNDUE by selecting the graph discussed in SECONDARY sources with greatest weight. If there's no debate about which graph or data set to use, then nevermind. NewsAndEventsGuy (talk) 00:02, 6 February 2017 (UTC)

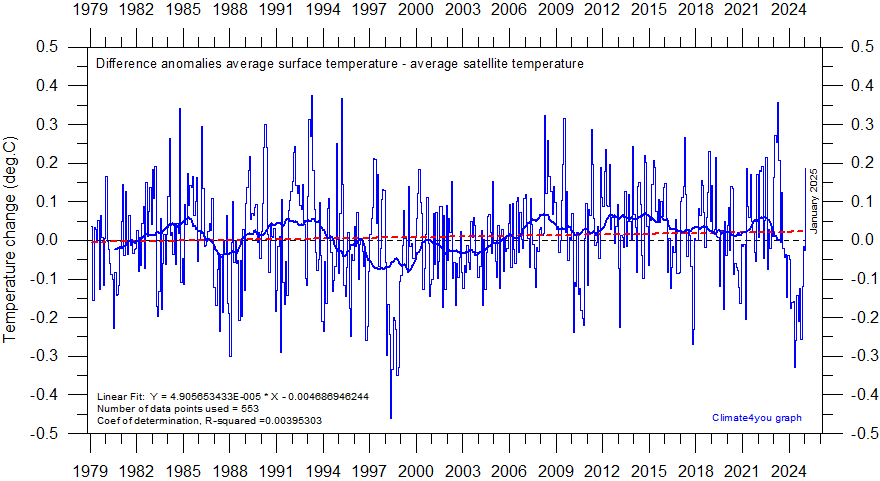
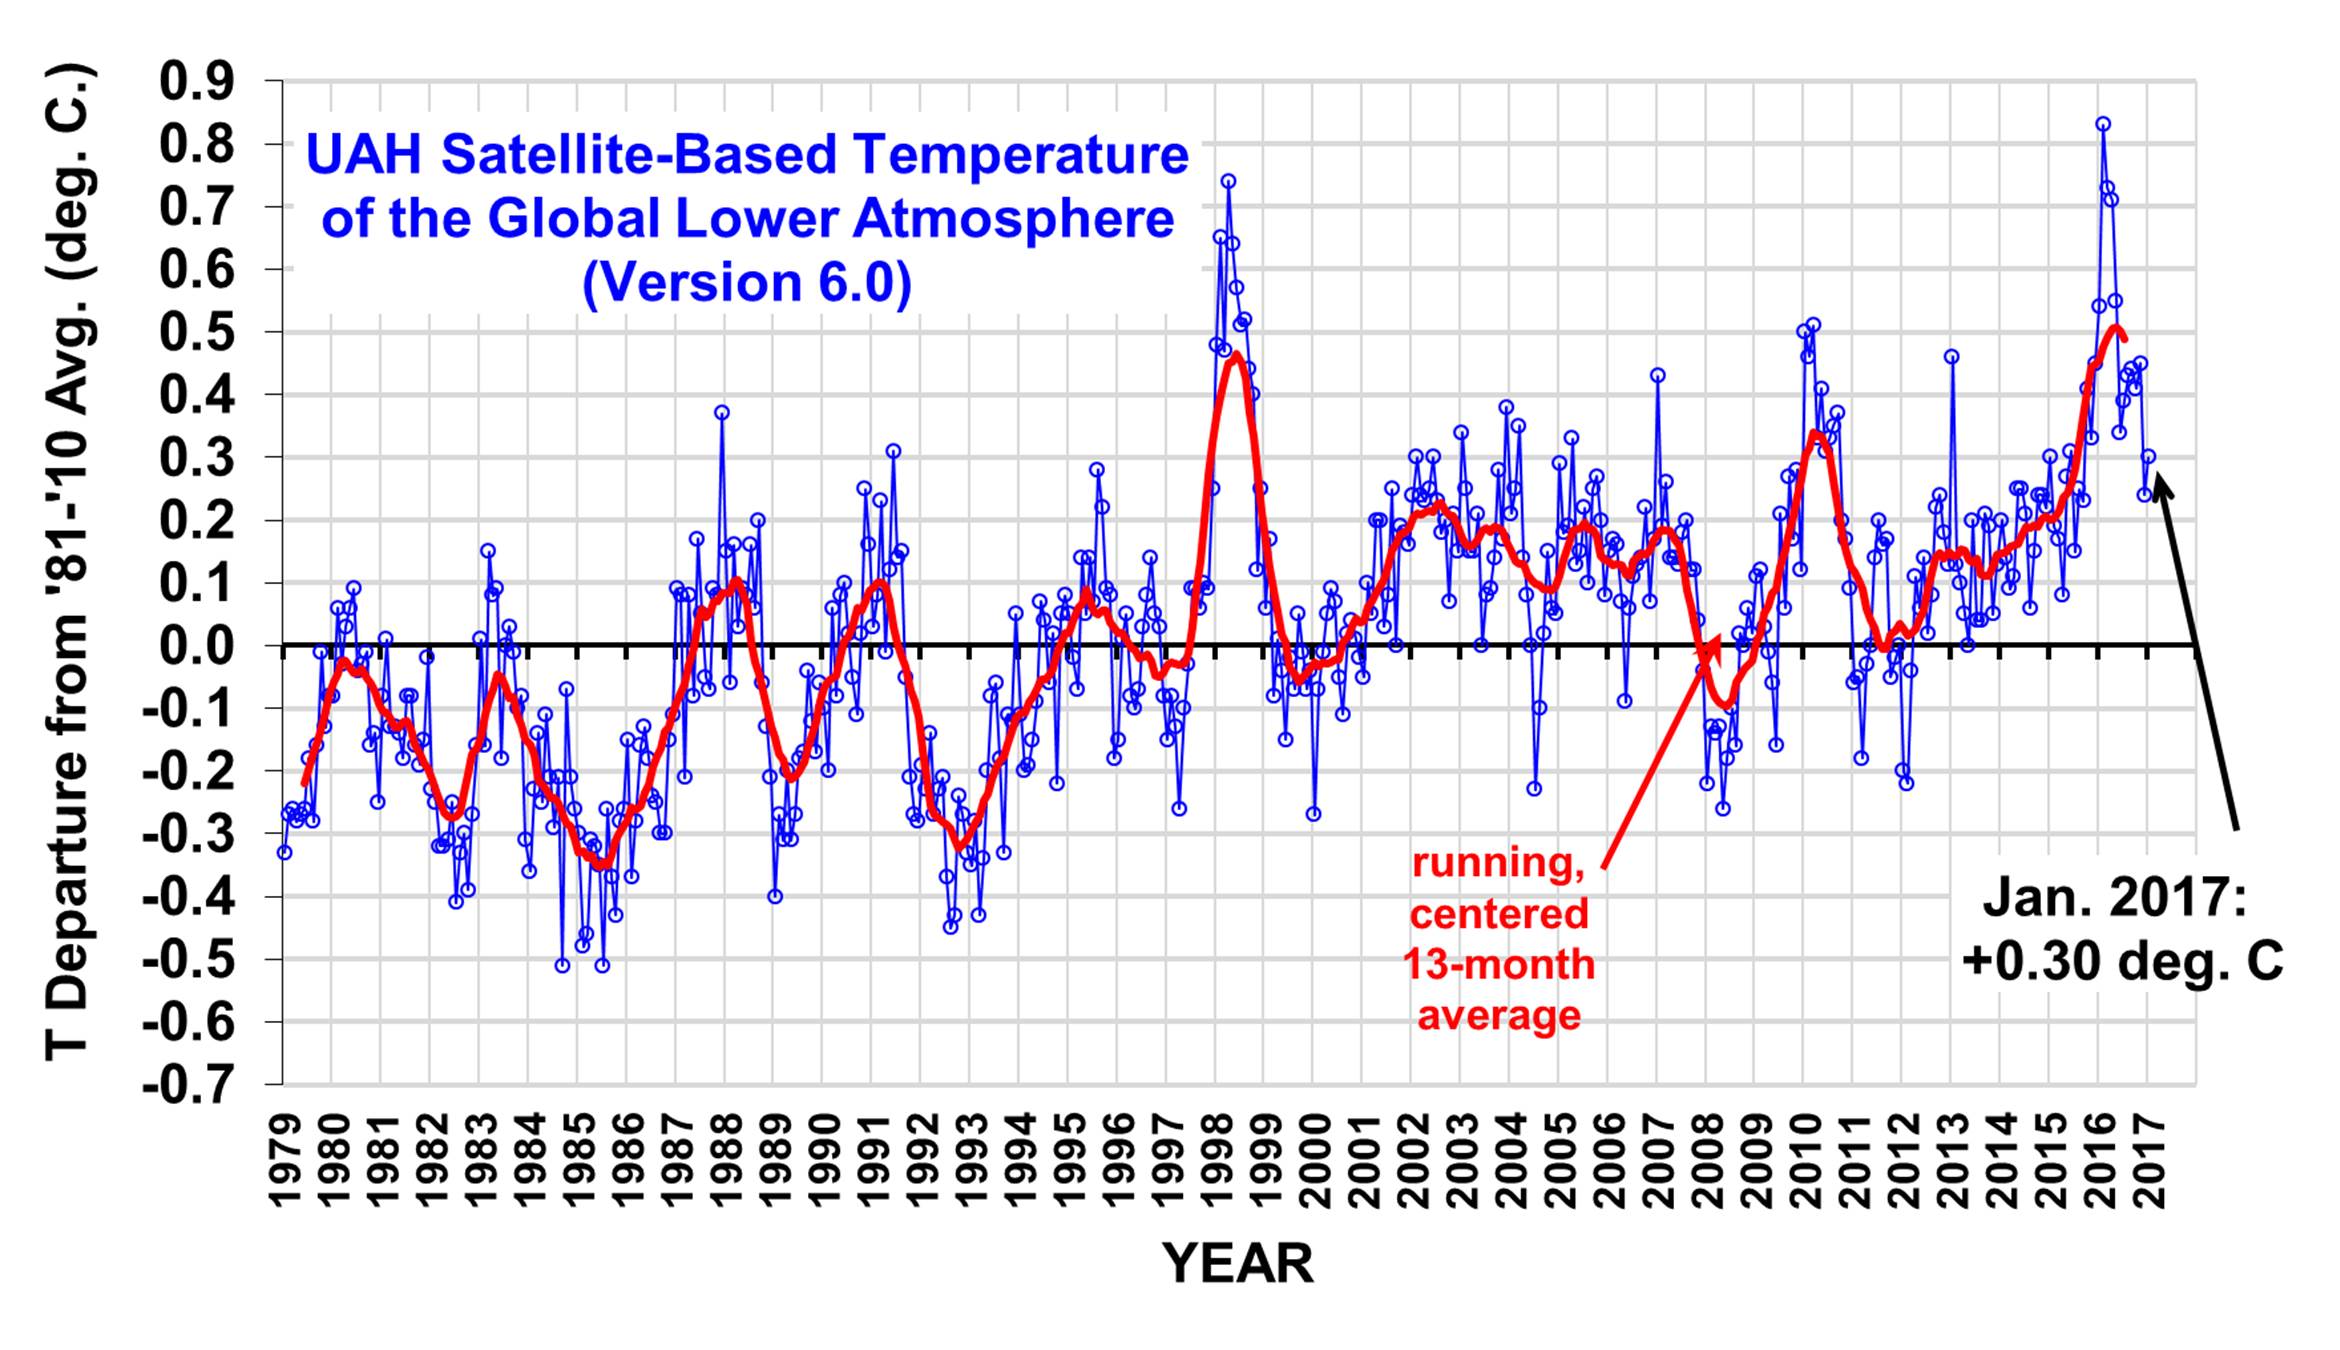
--TheClarinetGuy talk 04:53, 6 February 2017 (UTC)
- I see NewsAndEventGuy said that to you about setting up a graph yourself a while ago or you could have just looked at the graphs that are there, but I guess it is easy to miss. I'm not keen on burdening the lead with another graph but if it can substitute for one in a clean way that would be okay. If it just dealt with the last 30 years that should really go further down the article in the instrumental record section. It is okay to have a graph covering a longer period but some lies in it only covering part of the full period. Dmcq (talk) 09:33, 6 February 2017 (UTC)
- Dmcq As I said, it would cover 37 years not 30, and what "lies" are referring to? I assume with good faith that you are not referring to me, and it certainly is not my intent to publish the lies of anyone else, only reliable scientific data. --TheClarinetGuy talk 13:49, 6 February 2017 (UTC)
- The lies was lines with the n missing. 30 years is about the period when one goes from weather to climate. In that respect the satellite data is fine but very restricted. Dmcq (talk) 15:51, 6 February 2017 (UTC)
- Dmcq As I said, it would cover 37 years not 30, and what "lies" are referring to? I assume with good faith that you are not referring to me, and it certainly is not my intent to publish the lies of anyone else, only reliable scientific data. --TheClarinetGuy talk 13:49, 6 February 2017 (UTC)
- Cohler, at 21:49, 31 January 2017 I urged you to read WP:Image use policy. Better late than never. NewsAndEventsGuy (talk) 11:23, 6 February 2017 (UTC)
- NewsAndEventsGuy Thank you. I did read WP:Image use policy but based on the discussion here, it was not clear to me what constituted "analysis" (e.g. the act of plotting data could be considered as analysis by some people). In any case, it seems clear to me now based on the consensus received and duly noted at this point. --TheClarinetGuy talk 13:53, 6 February 2017 (UTC)
- Perhaps WP:CALC is more relevant on that point. Plotting the data is what everyone does so it is a routine and obvious way of treating the data. If people did not produce graphs very much like that then it would be questionable. Dmcq (talk) 15:56, 6 February 2017 (UTC)
- NewsAndEventsGuy Thank you. I did read WP:Image use policy but based on the discussion here, it was not clear to me what constituted "analysis" (e.g. the act of plotting data could be considered as analysis by some people). In any case, it seems clear to me now based on the consensus received and duly noted at this point. --TheClarinetGuy talk 13:53, 6 February 2017 (UTC)
- I see NewsAndEventGuy said that to you about setting up a graph yourself a while ago or you could have just looked at the graphs that are there, but I guess it is easy to miss. I'm not keen on burdening the lead with another graph but if it can substitute for one in a clean way that would be okay. If it just dealt with the last 30 years that should really go further down the article in the instrumental record section. It is okay to have a graph covering a longer period but some lies in it only covering part of the full period. Dmcq (talk) 09:33, 6 February 2017 (UTC)
I prefer to keep a simple and clean svg graph with a single long term dataset whatever it is, while there can be some interannual variability differences and a lot of discusssion over the recent arctic warming coverage bias multiple dataset are in close agreement over a period long enough to reflect climate change. https://pbs.twimg.com/media/C3MbWABVYAER3vb.jpg:large
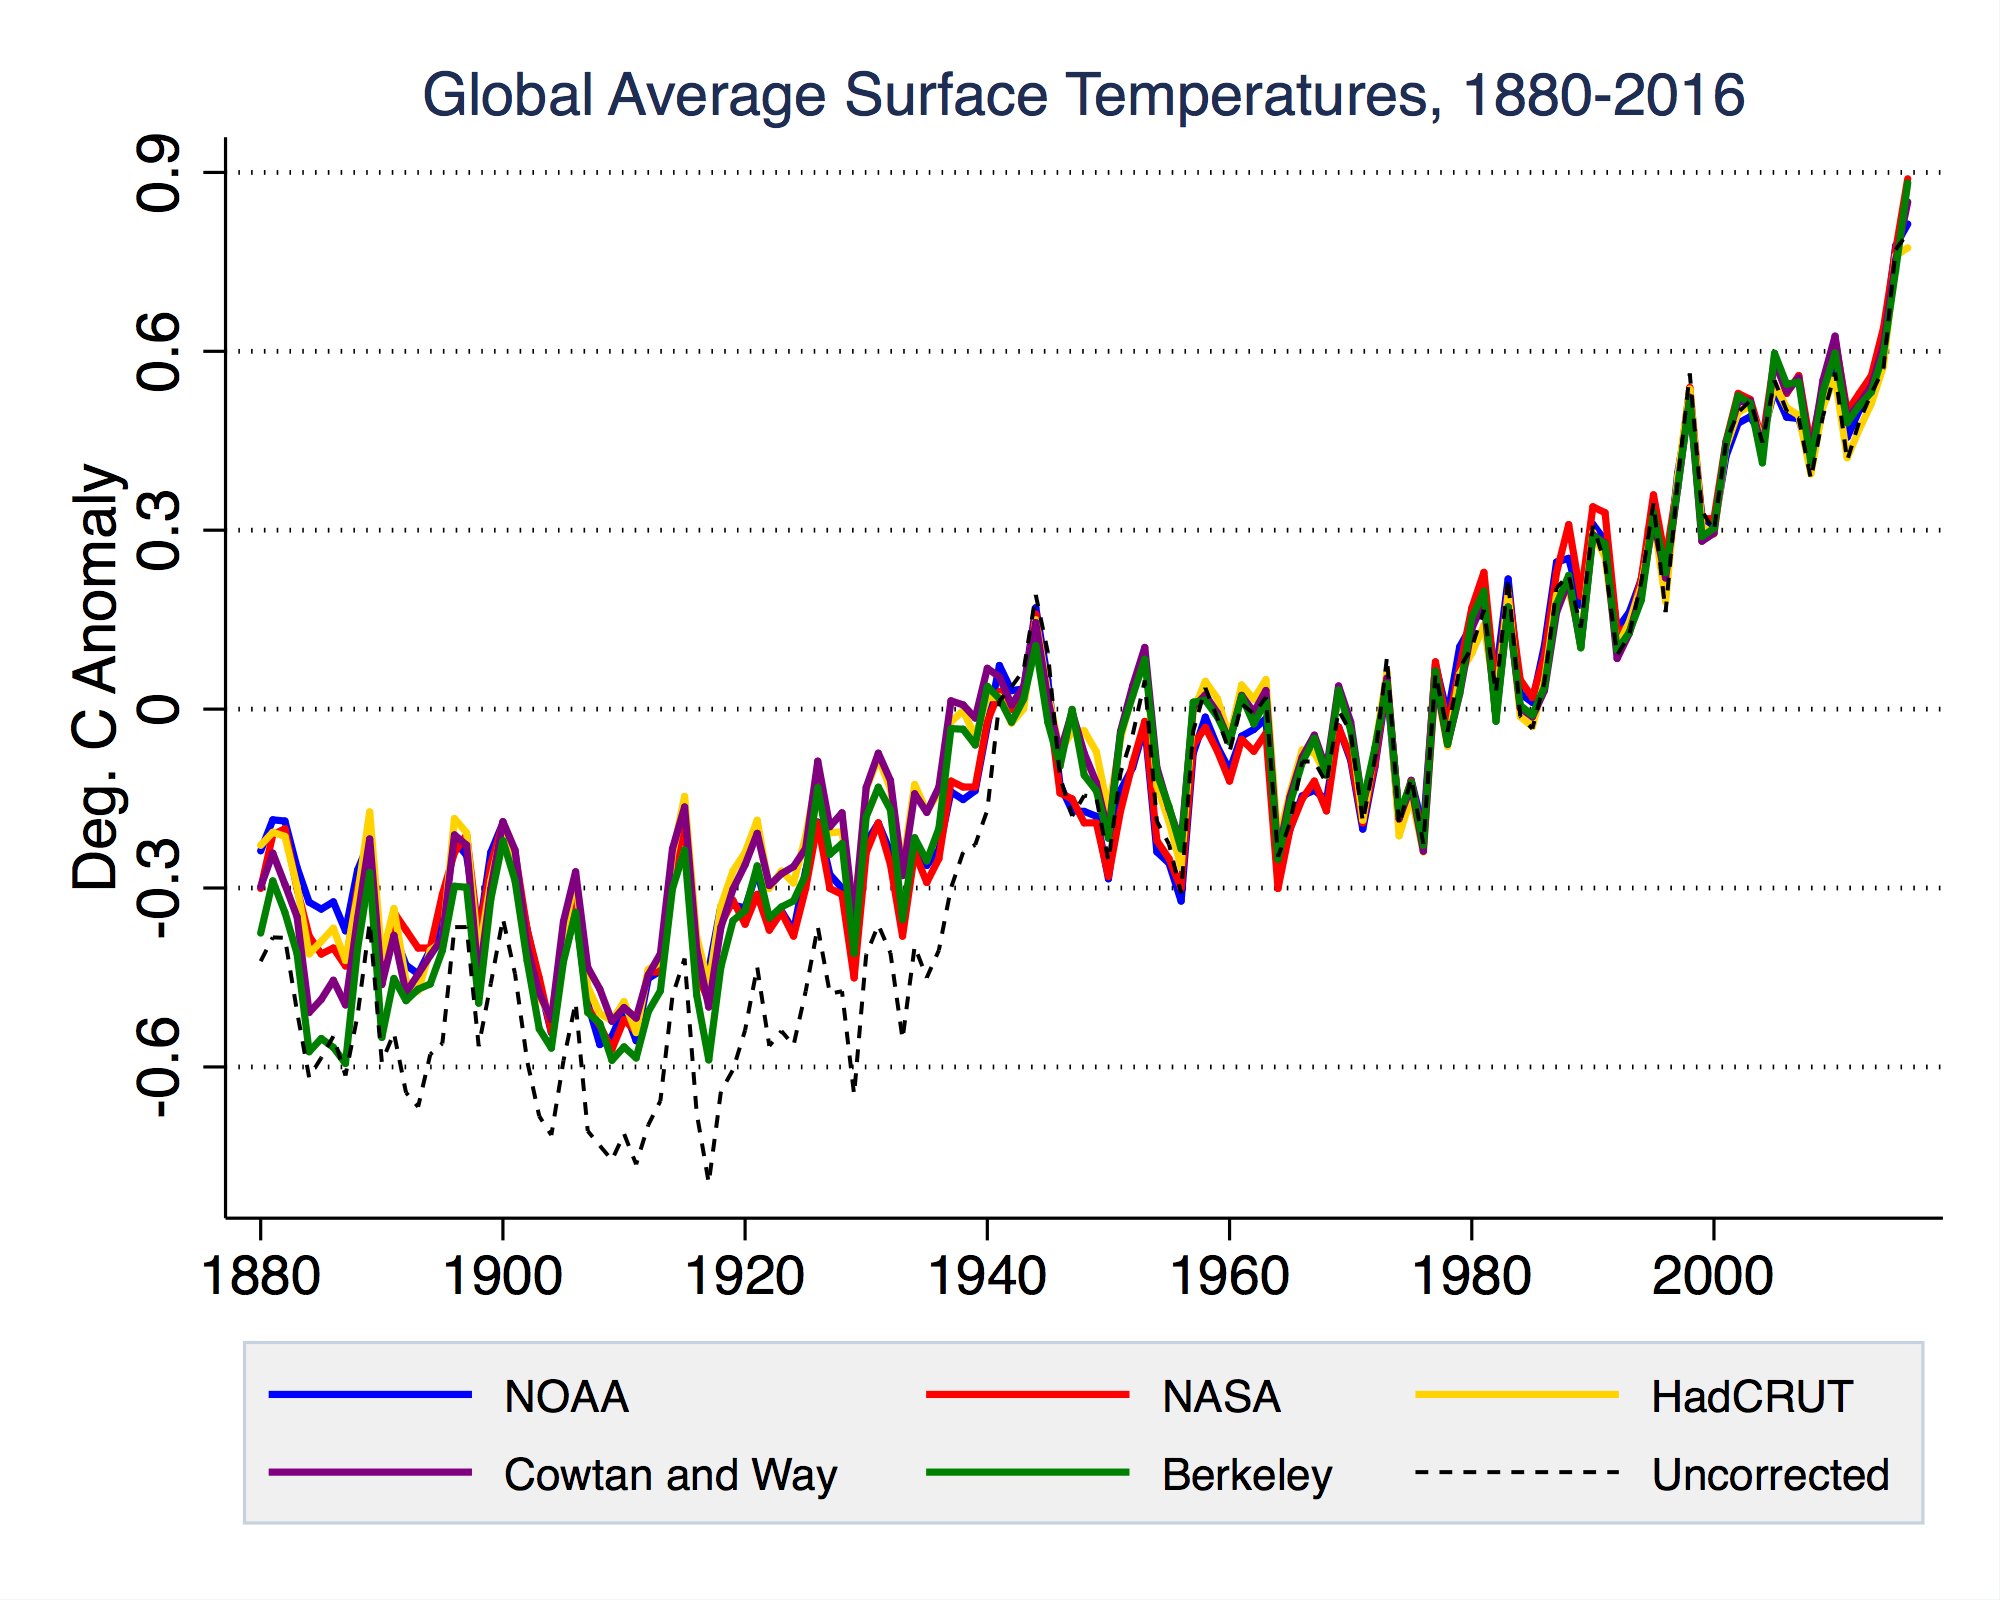
What i doesn't like of the current graph is the lowess smooth that jumps at the end because of a couple of warm years, a smoother shoud not be influenced by interannual variability so much.Giorgiogp2 (talk) 09:58, 6 February 2017 (UTC)
- That was something I was meaning to look up because of course a simple moving average doesn't work near the ends besides really not being a particularly wonderful way of doing the job. But any reasonable smoother would be better than just giving the latest figure. On the other hand the advantage of something simple is that people can understand it rather than it being yet another thing they latch on to so they can show China is in some conspiracy. Dmcq (talk) 12:06, 6 February 2017 (UTC)
- @Cohler, in your proposal you have suggested
- A. general concept That we expand explanation of how the different parts of the atmosphere respond to global warming. In general I think that's a good idea and belongs in a sub-article due to WP:Article size, and maybe WP:NOTJOURNAL. Something I have never made time to do but would like to see is to elaborate on the five parts of the overall climate system because right now that redirects to Climate and in my opinion we do an insufficient job explaining how the five parts interact. The info is here, but its sort of spread out. (If I'm overlooking some pithy language on this somehwere, please point it out.) It might be possible to tease out Climate system from Climate without creating a WP:POVFORK, and that might be a good place to compare the different ways different parts of the atmosphere are responding. Maybe there is a better sub article to host this.
- B. implied imbalance Again you assert there is some sort of lack of balance your words "help the reader to see... where things stand, with a balanced representation...". The word "balance" among wikipedia editors is a red flag that usually involves WP:POV or WP:UNDUE type issues. The way in which I have been responding to you is driven by my belief that's what you're tryinng to say... i.e., that you think the existing text is "imbalanced" in some vague way violates WP:POV or WP:UNDUE. If that's really what you mean, then please cite the operative language from WP:POV or WP:UNDUE, and then explain with citation to WP:Reliable sources how the existing text is in violation of WP:POV or WP:UNDUE. On the other hand, today I had a new thought.... maybe you simply mean we have yet to elaborate on how the different parts of the atmosphere respond to the warming. If that's what you meant by "balance" then since this is a term-of-art among wikipedia editors, you could better communicate your meaning with other words, such as "We should include (or elaborate on) XYZ".
- C. 3 way graph I don't see the benefit of overlaying the three temp trends on a single graph, and believe the result would be cluttered especially for a lay audience NewsAndEventsGuy (talk) 12:38, 6 February 2017 (UTC)
- @NewsAndEventsGuy My responses to your three points -
- A. general concept I disagree that it is the subject for a separate article, but rather the central element of the article. Indeed, the topic sentence currently reads "Global warming and climate change are terms for the observed century-scale rise in the average temperature of the Earth's climate system and its related effects." The troposphere is where the entire climate system takes place. See lead sentence of Troposphere - "The troposphere is the lowest portion of Earth's atmosphere, and is also where all weather takes place." Satellites and radiosondes measure the entire troposphere; terrestrial datasets measure only the first few feet of it.
- B. implied balance My reference to WP:BALANCE is not vague. I have stated all of this before, but I will repeat here. The different datasets I have mentioned are all widely cited in the literature and give very different results. Citing only one of them is clearly unbalanced. As for the specific parts of the policies, I believe the pertinent text is at WP:BESTSOURCES and WP:BALANCE.
- C. 3 way graph I don't believe the graph will look too cluttered, but the proof is in the pudding, I suppose. --TheClarinetGuy talk 14:13, 6 February 2017 (UTC)
- After reading part A I think this is hopeless... after all this discussion, you are equating climate and weather and claim that "the entire climate system", such as the formation of Antarctic Bottom Water, takes place in the troposphere. NewsAndEventsGuy (talk) 15:15, 6 February 2017 (UTC)
- Nowhere did I even remotely "equate climate and weather". Furthermore, I didn't make any "claims", but rather I quoted passages from existing Wikipedia articles on Global warming and troposphere. As I'm sure you know, "climate is the statistics of weather, usually over a 30-year interval." Furthermore, from troposphere, "The troposphere is the lowest portion of the Earth's atmosphere, and is also where all weather takes place." Therefore, using basic logic, we must look at averages of weather, such as things like temperature, humidity, and so on averaged over long periods of time to determine climate and climate change aka global warming. To do so we must look at the troposphere. Currently, this article underrepresents tropospheric data and overemphasizes surface measurements. That is totally self-evident. --TheClarinetGuy talk 19:18, 6 February 2017 (UTC)
- I decline to argue the point; if you try to edit the article or run an RFC on draft article text I may have something to say at that time. NewsAndEventsGuy (talk) 19:55, 6 February 2017 (UTC)
- Nowhere did I even remotely "equate climate and weather". Furthermore, I didn't make any "claims", but rather I quoted passages from existing Wikipedia articles on Global warming and troposphere. As I'm sure you know, "climate is the statistics of weather, usually over a 30-year interval." Furthermore, from troposphere, "The troposphere is the lowest portion of the Earth's atmosphere, and is also where all weather takes place." Therefore, using basic logic, we must look at averages of weather, such as things like temperature, humidity, and so on averaged over long periods of time to determine climate and climate change aka global warming. To do so we must look at the troposphere. Currently, this article underrepresents tropospheric data and overemphasizes surface measurements. That is totally self-evident. --TheClarinetGuy talk 19:18, 6 February 2017 (UTC)
- Wikipedia is a general encyclopaedia and global warming is a topic the general public is interested in. What you are talking about is too specialized for the lead of an article like this. You can google 'global warming introduction' and read any of the stuff that comes up. That shows the sort of stuff that goes into a top level introduction to the topic.They don't go on about the satellite date in the first thousand words or so or the differences between a number of different measurements and proxies. It is just your idea of what is important to show at this level. As an encyclopaedia we should do what is normally done in reliable sources introducing the topic and we should be trying to do it so the first part of the article is readable by the general public.. Dmcq (talk) 17:18, 6 February 2017 (UTC)
- Another red herring. For a while now here we have not been talking about the lede. We are talking about a graphic to accompany statements under Global warming#Observed_temperature_changes regarding satellite measurements. And this should be expanded to include radiosondes as I have also mentioned repeatedly. --TheClarinetGuy talk 19:18, 6 February 2017 (UTC)
- I don't remember any indication from you that you had given up sticking the graph in the lead but I'm glad you have. Dmcq (talk) 20:13, 6 February 2017 (UTC)
- Another red herring. For a while now here we have not been talking about the lede. We are talking about a graphic to accompany statements under Global warming#Observed_temperature_changes regarding satellite measurements. And this should be expanded to include radiosondes as I have also mentioned repeatedly. --TheClarinetGuy talk 19:18, 6 February 2017 (UTC)
- After reading part A I think this is hopeless... after all this discussion, you are equating climate and weather and claim that "the entire climate system", such as the formation of Antarctic Bottom Water, takes place in the troposphere. NewsAndEventsGuy (talk) 15:15, 6 February 2017 (UTC)
- @Cohler, in your proposal you have suggested
FYI This blog post by Gavin Schmidt may be useful at least on background. See "Comparing models to the satellite datasets". NewsAndEventsGuy (talk) 20:16, 6 February 2017 (UTC)
References
- ^ "IPCC AR5 WG1 Annex III: Glossary" (PDF). ipcc.ch. Intergovernmental Panel on Climate Change. 2013. p. 1450. Retrieved 5 February 2017.
The classical period for averaging these variables is 30 years, as defined by the World Meteorological Organization.
Global Warming
Global warming is a term to describe the increase in global temperature which is believe to be permanently changing the earth’s climate. An issue that is not getting the immediate response it needs. Scientist believe the main cause of this warming is the continuous use of burning fossil fuels and coal. In outcomes the gases that are being produce are trapped in the atmosphere and blocking heat from escaping. Thus causing the earth to heat up and have negative results on its climate. Irregular seasonal patterns develop and increase of CO2 into the air is not controlled, which in large quantities can be a poison to the human population. If there is no stopping to burning fossil fuels and no methods of decreasing the change. Then the climate will keep responding to the increase of the warm temperature and civilizations would change dramatically.2601:280:C301:1060:4809:BE3E:60A7:56B5 (talk) 21:25, 6 March 2017 (UTC)
- While I think you've got it broadly right, this page is for detailed discussion of improvements to the article, on the basis of reliable published sources. Look on the bright side, the current changes are unlikely to be permanent: they'll probably unwind in a few thousand years, and CO2 levels are very unlikely to get to the point of being poisonous. Though they will disrupt life essentials such as food, water supply, and dry land. However, wp:not a forum dave souza, talk 22:10, 6 March 2017 (UTC)
- Although CO2 may not reach human-toxicity levels outright, there's active research into the possibility of turning the oceans anoxic, which may then outgas Hydrogen sulfide, leading to mass extinction of oxygen-breathing lifeforms (like us). Surprisingly, while the article mentions species extinction, it does not really touch on mass extinction, much less this H2S theory. Maybe we should incorporate it? See for example Global Warming Led To Atmospheric Hydrogen Sulfide And Permian Extinction in ScienceDaily. NewsAndEventsGuy (talk) 23:09, 6 March 2017 (UTC)
- I don't think anyone is talking about the current climate changes turning the oceans anoxic. Plus the current extinctions have more to do about pressure from the human population than climate change, though climate change will also contribute to part of it. Where did you or the original poster get these apocalyptic ideas of the end of civilization and anoxic oceans from? What's happening is quite bad enough without exaggerating it. Dmcq (talk) 23:37, 6 March 2017 (UTC)
- Dmcq, I'll grant that this isn't (yet) a solid bullet point in IPCC assessment reports. Most recently they said
- "It is very likely that the dissolved oxygen content of the ocean will decrease by a few percent during the 21st century. CMIP5 models suggest that this decrease in dissolved oxygen will predominantly occur in the subsurface mid-latitude oceans, caused by enhanced stratification, reduced ventilation and warming. However, there is no consensus on the future development of the volume of hypoxic and suboxic waters in the open ocean because of large uncertainties in potential biogeochemical effects and in the evolution of tropical ocean dynamics. {6.4.5, Figure 6.30}did you read the link I provided from Science Daily?" AR5, WG1, Chapter 6, pg 469
- On the other hand, regulars here all know that individual papers lead the IPCC assessment reports. For background at least, is "Suffocating the Ocean" by Moises Velasquez-Manoff and published by Pacific Standard. I'm not saying the eggheads are certain about this outcome, only that some are talking about it as remote but plausible.
- NewsAndEventsGuy (talk) 19:42, 7 March 2017 (UTC)
- Dmcq, I'll grant that this isn't (yet) a solid bullet point in IPCC assessment reports. Most recently they said
- I don't think anyone is talking about the current climate changes turning the oceans anoxic. Plus the current extinctions have more to do about pressure from the human population than climate change, though climate change will also contribute to part of it. Where did you or the original poster get these apocalyptic ideas of the end of civilization and anoxic oceans from? What's happening is quite bad enough without exaggerating it. Dmcq (talk) 23:37, 6 March 2017 (UTC)
- Although CO2 may not reach human-toxicity levels outright, there's active research into the possibility of turning the oceans anoxic, which may then outgas Hydrogen sulfide, leading to mass extinction of oxygen-breathing lifeforms (like us). Surprisingly, while the article mentions species extinction, it does not really touch on mass extinction, much less this H2S theory. Maybe we should incorporate it? See for example Global Warming Led To Atmospheric Hydrogen Sulfide And Permian Extinction in ScienceDaily. NewsAndEventsGuy (talk) 23:09, 6 March 2017 (UTC)
No acceleration in the rate of global warming during the industrial age has been detected
| a result of the labours unfinished of Testew and Cunard |
|---|
| The following discussion has been closed. Please do not modify it. |
|
The tidal gauges show no acceleration in the rate of sea level rise which was reluctantly admitted by the IPCC https://www.ipcc.ch/ipccreports/tar/wg1/409.htm The lower troposphere satellite measurements actually show a decrease in the rate warming for the last 20 years compared to the previous 20 despite human co2 production doubling http://www.nsstc.uah.edu/climate/2017/february/022017_tlt_update_bar.png The only evidence of an increase in the rate of warming come from estimates such as the GISS which has laughable methodology I don't expect this to get in the article but there it is — Preceding unsigned comment added by 2600:100A:B127:6565:C1DF:EAD3:AD99:C354 (talk) 12:17, 14 March 2017 (UTC) If this article is to promote the catastrophic man made global warming theories then it should mostly be about "feedback loops" because that's where the vast majority of the theorized future warming is supposed to come from. The actual greenhouse effect of co2 is very small — Preceding unsigned comment added by 2600:100A:B127:6565:C1DF:EAD3:AD99:C354 (talk) 12:23, 14 March 2017 (UTC)
|
Global warming in the news, again
It appears that recent political events may have pushed global warming, or more accurately, global warming denial into the news again. http://www.theguardian.com/environment/climate-consensus-97-per-cent/2017/feb/05/mail-on-sunday-launches-the-first-salvo-in-the-latest-war-against-climate-scientists
"the denial industry has lost the battle on the science. There are no reputable scientists who discount the enormous human influence on our Earth’s climate. Because they have lost that battle, they are manufacturing doubt about the science." --Nigelj (talk) 23:26, 5 February 2017 (UTC)
- Shouldn't this go at the climate change denial article rather than here? Dmcq (talk) 23:49, 5 February 2017 (UTC)
Actually the world's leading expert in the trend of global temperature, John Christy, disagrees with you. As do the satellite measurements and tidal gauges — Preceding unsigned comment added by 2600:100A:B127:6565:C1DF:EAD3:AD99:C354 (talk) 12:18, 14 March 2017 (UTC)
- Thanks for the laugh! . . dave souza, talk 16:37, 14 March 2017 (UTC)
Meanwhile, elsewhere
In case you missed it: https://en.wikipedia.org/w/index.php?title=Wikipedia:No_original_research/Noticeboard&diff=770351546&oldid=769648085 William M. Connolley (talk) 23:17, 14 March 2017 (UTC)
Fixing the lead
The lead to this article has gotten terribly bloated. Not only is there too much text, but the lead has three (3) illustrations of the temperature trend and two (2) illustrations of emissions. (In the body there are even more graphs of the temperature anomalies.) I'm tempted to take a meataxe to the whole thing but given this is a FA I'm slightly hesitant. Thoughts? Shock Brigade Harvester Boris (talk) 21:32, 4 February 2017 (UTC)
- Get rid of all figures in the lead except the graph of temp since 1880. Isambard Kingdom (talk) 21:43, 4 February 2017 (UTC)
- Would someone who knows how please look up the date it was granted FA status, and then post a DIFF to that version? There might be something to be said for just reverting to that basic text, with a few updates to AR5 etc. NewsAndEventsGuy (talk) 23:40, 4 February 2017 (UTC)
- Good point. The article was approved as an FA in mid-May 2006. This is what it looked like on its first day with the coveted gold star. A tight and very readable lead with just one graph, showing the surface temperature trend since 1880. (User:Isambard Kingdom, did you cheat?) The lead in that version could be adapted to the present article with only minor changes. Shock Brigade Harvester Boris (talk) 00:21, 5 February 2017 (UTC)
- No, I didn't cheat! Ha. The present lead section looks good with just one graphic. Makes the point very clearly. Isambard Kingdom (talk) 01:40, 17 March 2017 (UTC)
- Do it! NewsAndEventsGuy (talk) 00:28, 5 February 2017 (UTC)
- Good point. The article was approved as an FA in mid-May 2006. This is what it looked like on its first day with the coveted gold star. A tight and very readable lead with just one graph, showing the surface temperature trend since 1880. (User:Isambard Kingdom, did you cheat?) The lead in that version could be adapted to the present article with only minor changes. Shock Brigade Harvester Boris (talk) 00:21, 5 February 2017 (UTC)
Agree, i particularly doesn't like the video and single year anomaly, i would keep a long term temperature graph and a trend map maybe with a better color table, this one looks better if it can be used: http://berkeleyearth.org/wp-content/uploads/2017/01/Trend_Map_since_19701.png Giorgiogp2 (talk) 10:25, 6 February 2017 (UTC)
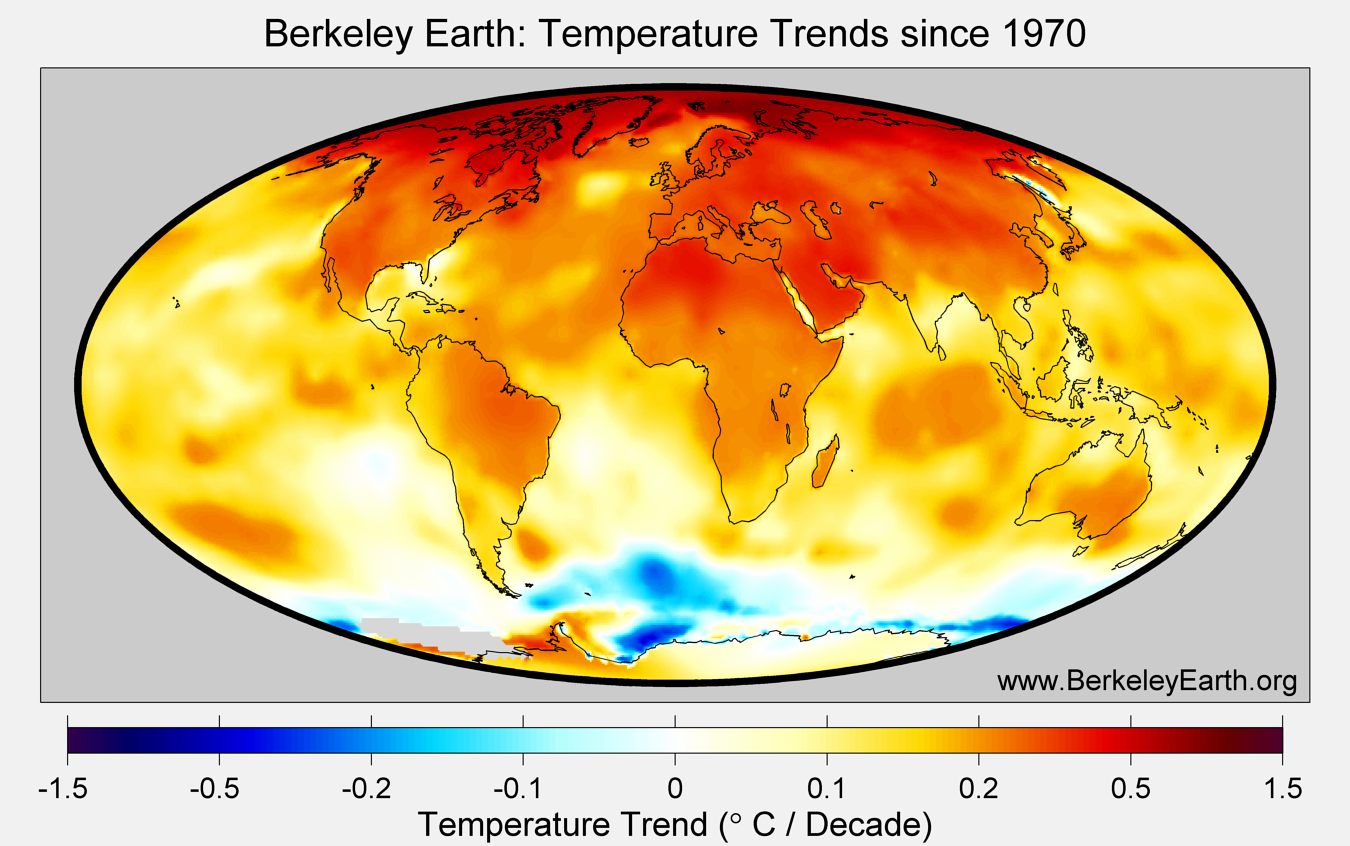
I was brave enough to kill the video. I quite like the single year anomaly, or rather I like the map, because I think a pic of the geographical variation is a valuable antidote to the "global average" idea we so often get.
I propose that the emissions pix are secondary. I don't really like either, but I think one or the other should lead the "causes" section... actually I'll just do it, revert me if you don't agree William M. Connolley (talk) 21:25, 14 February 2017 (UTC)
On my screen, the "TOC" is now rather long and horrible. Does anyone know how to fold it into 2-column format? William M. Connolley (talk) 21:35, 14 February 2017 (UTC)
I'm done for now. Comments? William M. Connolley (talk) 22:07, 14 February 2017 (UTC)
- feel like someone just crammed their rebreather mouthpiece between my lips....in the nick of time, too. NewsAndEventsGuy (talk) 00:46, 15 February 2017 (UTC)
2016 1.1 deg C ref
16 of 17 in "warmest years" is more than a single pop fact over a single hot year. And 2016 seems to have varying temp reports, from the .99 on NASA CC to 1.1 here in this more recent RTE article.cite news|url=https://www.rte.ie/news/ireland/2017/0321/861284-record-global-average-temperature/ |title=2016 made history with a record global average temperature |publisher=RTE |date=March 21, 2017 |accessdate=March 22, 2017 B137 (talk) 06:32, 22 March 2017 (UTC)
- This page is for discussing changes that might improve the article. Have you got a more specific suggestion thanks? Dmcq (talk) 11:17, 22 March 2017 (UTC)
Neutrality
The existence of global warming is a debatable topic, and this article is saying that it is real, so it has a non-neutral point of view. Keep in mind that not everybody believes global warming is real. - ZLEA (talk) 19:02, 1 February 2017 (UTC)
- The WP:TPG requires neutral section headings and says no one has exclusive claim to them, so ironically it was necessary to change it to a neutral form. Not everyone believes smoking is bad for you either. At this point, these views can still be reported on Wikipedia, but fall under the provisions of WP:FRINGE. For example, see Climate change denial. NewsAndEventsGuy (talk) 19:09, 1 February 2017 (UTC)
- @ZLEA: please read the FAQ at the top of the page before asking questions already covered there. --McSly (talk) 19:17, 1 February 2017 (UTC)
- The POV that global warming is not real is a fringe view that is not backed up by climate scientists at large. As McSly mentioned, see the FAQ. Dustin (talk) 22:04, 1 February 2017 (UTC)
Global warming has occurred for more than 10,000 years. The debate here is about specific man made catastrophic global warming theories. The lower troposphere satellite measurements and the tidal gauges show that no such thing has occurred. Good luck getting that into wikipedia though — Preceding unsigned comment added by 2600:100A:B127:6565:C1DF:EAD3:AD99:C354 (talk) 12:12, 14 March 2017 (UTC)
- The first claim is wrong. The second claim is unsupported opinion. The third one is both a straw man and most likely based on the selective reading of unreliable blogs cherry-picking and misrepresenting data. Do you have any source to support these? --Stephan Schulz (talk) 12:20, 14 March 2017 (UTC)
- As an aside, bear in mind that most veteran Wikipedia editors, as well as most people in the world, are bored with any claim that there is an "argument" surrounding global warming's existence. In all probability nobody can be bothered arguing with you any more, not because they cannot counter your claims, but because the article as it stands does that already. If you're not convinced by science, nobody can be bothered wasting their time with you.
- Saying many people don't believe global warming is real isn't a reliable source of scientific inquiry. It's as nonsensical as saying, "Many people don't believe that Belgium is a real location, so you should make it clear that there is still some argument about this." A neutral point of view means sticking to factual data. Comb through the references to this article, especially the FAQ, if you're unconvinced that this topic isn't verified extensively.
- As dismissive as it seems, people have better things to do than engage in constant fringe theories. This discussion page is about how to improve the article, with up-to-date data, copy editing and the likes. If you feel that a specific part of the article is not up to standard, please point it out and express your frustration. The lead section of this article is suitably sourced, so your complaint that it isn't neutral does not hold weight.Vision Insider (talk) 04:16, 27 March 2017 (UTC)
this sentence in the intro
Many of the observed changes since the 1950s are unprecedented over tens to thousands of years.[6]
The last ice age ended about 10,000 BC so the statement that the observed changes over the past "tens" of thousands of years are unprecedented is garbage, or does anyone think that going from an ice age to a non-ice age period is NOT comparable to the piddling little change since 1950.
The LITTLE ice age that bottomed in the 1300's caused widespread famine across Europe and probably the world. Recent research shows that 1/3 of villages in northern Europe vanished, because everyone either starved to death or moved south. That also seems MORE of a change then the changes since 1950.
Lastly one of the many MINI ice ages bottomed in the late 1800's so of course there will be a warming period afterwards, and even with the CRAP chart you are using, there is not much difference between 1880 and 1950 and 1950 and today. If the current theory on Global Warming caused by CO2 emissions is true then there should be a much higher change since 1950. What we have here is a theory FAIL.
As a matter of fact, there are predictions that after hitting a top we may now be heading for another bottom to a mini ice age. This is based on sunspot activity as an indicator of solar activity now showing decreased solar energy, resulting in less sunlight and a cooler Earth.
If there is a temperature cycle then there is a bottom and a top. The following is what it looks like at a LITTLE Ice Age bottom, while today we may be at a top.
https://www.eh-resources.org/little-ice-age/
The Baltic Sea froze over, as did most of the rivers in Europe. Winters were bitterly cold and prolonged, reducing the growing season by several weeks. These conditions led to widespread crop failure, famine, and in some regions population decline.71.174.137.143 (talk) 06:03, 30 March 2017 (UTC)
- The sentence is from the summary of the ~1000 page report, If you want to talk about that sentence, you'll need to refer to the details in the detailed report. If you want to continue with the bowel movement claim, you'll need to provide citations to what Wikipedia calls a WP:Reliable source. NewsAndEventsGuy (talk) 08:44, 30 March 2017 (UTC)
- Agree about the citations. But they pointed out a real problem with the start of the article, people shouldn't be dismissed so quickly. Perhaps it should be rewritten so it is not misread so easily. It says 'tens to thousands of years' not 'tens of thousands of years'. Up to ten thousand years ago is 'thousands of years'. I think I'll go and change it to just say 'thousands of years'.
- Yes there were some predictions about fifty years ago based on cycles that we might be headed to another ice age, but the science has firmed up quite a bit since, see History of climate change science and you'll see the how the basic science has been around since 1896. The changes are not piddling. Compared to the average temperature over the last two thousand years recent yearly global temperatures are further away from the mean than the worst of the little ice age was. People in air conditioned houses may not notice but high temperatures can kill as well and it is predicted to go up a lot more. Dmcq (talk) 09:14, 30 March 2017 (UTC)
- The language from the citation does not even match the "tens of thousands of years" quoted in the article. Your own source does not match that line. It is therefore CRAP. Read the actual language which is part of the citation. Whoever put that language in the article needs to go back to school in order to learn to read.71.174.137.143 (talk) 15:25, 30 March 2017 (UTC)
- High temperatures can kill has got to be one of the stupidest comments I have ever heard. By that quote people going to Florida for the winter go there to die. Same for those retirees who retire to Mexico because they can get a maid on a Social Security income.
- Recent temperatures are likely LOWER or at least no different then those of 1000 years ago and 2000 years ago. Both periods saw commercial wine making in England. In modern times that has recently started up again. That activity was not possible in England during the LITTLE Ice age period of about 1300-1700's as grapes do not do well in the cold.71.174.137.143 (talk) 15:36, 30 March 2017 (UTC)
- If you were able and willing to read what people write, you would be smarter. Try it.
- For your benefit, I will repeat Dmcq's key sentence for you:
- "It says 'tens to thousands of years' not 'tens of thousands of years'."
- Now read the rest. Slowly and carefully. After that, would you please stop Dunning-Krugering? --Hob Gadling (talk) 16:07, 30 March 2017 (UTC)
- OK! I misread it! but that still does not change the fact that the temperature of the earth 1,000 years ago was most likely warmer then it is today. 1000 years ago the Vikings were calling Greenland "GREEN" land, and Newfoundland VINland after the grape vine. Greenland in not GREEN today and grapes don't do well in Newfoundland. The sentence is still hyperbole and not backed by any evidence. What evidence exists shows that it is in error.71.174.137.143 (talk) 16:54, 30 March 2017 (UTC)
- Well, there we are: complete and utter refutation of a century of science. Who can argue with that? Who would have thought it was so simple? Why should a few little errors matter? Never mind that a real estate developer or two were involved. I'm sure those simple-minded Vikings had not invented "fluff" back then. ~ J. Johnson (JJ) (talk) 22:01, 30 March 2017 (UTC)
- If you want to talk "fluff" you can bet a Viking and I will counter with an Al Gore, that there climate change guru who "invented" the internet.
- BTW:There is evidence that at least parts of New England was included in VINLand. Today there are commercial grape farms in Maine and Massachusetts. The temperature of New England 1,000 years ago was about what it is today.
- and if you want to continue, I will warn that I have 2 Nobel Prize winners in my deck right now and I can probably get a few more. In your deck you've got Al Gore, and a bunch of England based climatologists who had to "massage their temperature data to support their conclusions, because the unmassaged date DID NOT.71.174.137.143 (talk) 03:42, 31 March 2017 (UTC)
- The intended meaning of that sentence in the IPCC report is tens TO thousands of years not tens of thousands of years, reflecting the situation that for some of observed changes being talked about, useful records only extend a few decades before the 1950s, for others it is a few centuries before the 1950s, and for a few it is a few millennia. We (disclosure: I was an author of the report) avoided writing that most of the observed changes since the 1950s were unprecedented over the last several thousands of years because for most of the observed changes we don't have useful records that long. Some rewording is needed. TimOsborn (talk) 23:58, 30 March 2017 (UTC)
- The cited source is IPCC AR5 WG1 SPM which reads "decades to millenia"; I'm just fine with our text "tens to thousands of years" but it might read better if it said "some of the observed changes are unprecedented over thousands of years". We may want to cite the section of the full report that says so. I have not attempted to dig that up. NewsAndEventsGuy (talk) 01:07, 31 March 2017 (UTC)
- At most it is about 1,000 i.e. the warm period in the middle of the last 2 Little Ice ages, one marking the end of the Roman Empire and a huge but unknown drop in Europe's population, while the later one is marked by a 30-40% drop in the population of the Northern hemisphere, largely made up of the Mongol Empire (that includes China, as China was a Mongol conquest) and Europe. It is now warm enough that you can grow grapes commercially in England now, it was the same 1,000 years ago and it was the same 2,000 years ago.71.174.137.143 (talk) 02:50, 31 March 2017 (UTC)
- PAGES 2k – "during the period AD 1971–2000, the area-weighted average reconstructed temperature was higher than any other time in nearly 1,400 years.", and temps have increased since 2000. Hockey stick graph#2010 onwards discusses several reconstructions, note Marcott et al. showing "a uniquely rapid rise in the 20th century to temperatures which were already the warmest for at least 4,000 years". . dave souza, talk 11:57, 31 March 2017 (UTC)
- At most it is about 1,000 i.e. the warm period in the middle of the last 2 Little Ice ages, one marking the end of the Roman Empire and a huge but unknown drop in Europe's population, while the later one is marked by a 30-40% drop in the population of the Northern hemisphere, largely made up of the Mongol Empire (that includes China, as China was a Mongol conquest) and Europe. It is now warm enough that you can grow grapes commercially in England now, it was the same 1,000 years ago and it was the same 2,000 years ago.71.174.137.143 (talk) 02:50, 31 March 2017 (UTC)
- The sentence quoted for "tens to thousands" appears on p. 4 of the SPM, under section B. Observed Changes in the Climate System. It is preceded by: "Observations of the climate system are based on direct measurements and remote sensing from satellites and other platforms. Global-scale observations from the instrumental era began in the mid-19th century for temperature and other variables, with more comprehensive and diverse sets of observations available for the period 1950 onwards. Paleoclimate reconstructions extend some records back hundreds to millions of years. Together, they provide a comprehensive view of the variability and long-term changes in the atmosphere, the ocean, the cryosphere, and the land surface." Since Tim Osborn is clearly right and our current wording is misleading, I've changed it to "Many of the observed changes since the 1950s are unprecedented in the instrumental temperature record which extends back to the mid 19th century, and in paleoclimate proxy records over a thousand years." Let the usual refinements commence. . . dave souza, talk 11:34, 31 March 2017 (UTC)