Talk:COVID-19 pandemic in Australia/Archive 1
| This is an archive of past discussions about COVID-19 pandemic in Australia. Do not edit the contents of this page. If you wish to start a new discussion or revive an old one, please do so on the current talk page. |
| Archive 1 | Archive 2 | Archive 3 |
A Commons file used on this page or its Wikidata item has been nominated for deletion
The following Wikimedia Commons file used on this page or its Wikidata item has been nominated for deletion:
Participate in the deletion discussion at the nomination page. —Community Tech bot (talk) 21:06, 1 March 2020 (UTC)
Flag icon in infobox
@Ear-phone: re [1][2][3] – MOS:INFOBOXFLAG seems pretty clear on this
Generally, flag icons should not be used in infoboxes, even when there is a "country", "nationality" or equivalent field
Is there some specific reason why we should have a flag icon in the infobox for this article, contrary to MOS? Mitch Ames (talk) 00:35, 7 March 2020 (UTC)
- @Mitch Ames: I saw this use on a leading page i.e. 2020_coronavirus_outbreak_in_the_United_States and thought that was the accepted practice. It also made sense, to include the flag, at least to me. Ear-phone (talk) 00:41, 7 March 2020 (UTC)
Disaster?
Inclusion of the article in Category:2020 disasters in Australia seems to be a bit of overkill. Are any reliable sources defining the outbreak in Australia as a disaster? Mitch Ames (talk) 00:46, 7 March 2020 (UTC)
 Removed. Not even close to being a disaster. WWGB (talk) 07:46, 7 March 2020 (UTC)
I have noticed that Disasters has been re-added as an external link. Originally I did not agree with it being categorised as a disaster, but now when I think about the amount of stress it has induced, the amount of panic and hysteria it has caused, the sheer lack of toilet paper and basic essentials due to panic buying stockpilers, and the fights and arrests due to toilet paper alone, I think it might be a pretty fair point that when we look back at how disastrous 2020 was, we would think of bushfires, floods and COVID-19. Tkh7 (talk) 21:39, 7 March 2020 (UTC)
It's definitely not a natural disaster in terms of being a weather-induced disaster, but I'm starting to think we are living through a social, economic and health disaster. Being of Asian appearance, I have witnessed and suffered more racism alone in the last two months than in the past three decades. Is there a tangible point at which this situation might be clearly defined as a disaster? 10 deaths? 1000 infections? Zero hospital beds? Toilet paper stampedes? Tkh7 (talk) 21:49, 7 March 2020 (UTC)
See Category:Health disasters. Dimadick (talk) 21:58, 7 March 2020 (UTC)
- See what? That some random editors have added a tag to some articles? WWGB (talk) 02:11, 8 March 2020 (UTC)
Is there a tangible point at which this situation might be clearly defined as a disaster?
— Yes, when the "reliable sources commonly and consistently define" it as being one. Mitch Ames (talk) 00:22, 8 March 2020 (UTC)
Numbers inconsistent.
Total number of cases differs from table 1 to table 2, eg. on the 5th of March there is 57 in the first table but 60 in the second. Which numbers are correct? — Preceding unsigned comment added by HelperAnt (talk • contribs) 07:02, 13 March 2020 (UTC)
Should we change the map that changes colour based on how many people infected?
I think it should change colour at 5+, 10+, and 100+. What do you think? I know this is confusing it’s hard to explain what I mean. SnowyStarfall13 (talk) 10:13, 13 March 2020 (UTC)
- @SnowyStarfall13: Earlier on, say in February, I would have agreed with you and thought that was brilliant. However, in the last few days we have started to move quickly with a steep increase on numbers. At the estimated rate of increase, it's possible that we might not have been able to "flatten the curve" as much as the health authorities had hoped thus it might become irrelevant fairly quickly if we alter the ranges now. Or... we might still be ahead of the game and contain it fairly soon after this without a significant increase in confirmed cases, although this is looking fairly unlikely. Do others think it would be valuable to alter the ranges displayed? Tkh7 (talk) 23:26, 13 March 2020 (UTC)
Table Update Suggestion.
Do you think it would be good to update the table at the bottom that tallies the state's cases to include the columns done on the Swedish page? (https://en.wikipedia.org/wiki/2020_coronavirus_outbreak_in_Sweden#Statistics) It lists new cases, progression, deaths by day, totals and puts the references to the right in a separate column.As well the page could also have another table as mentioned in their talk page as other countries are doing.(https://en.wikipedia.org/wiki/Talk:2020_coronavirus_outbreak_in_Sweden#Timeline_case_summary_table) — Preceding unsigned comment added by HelperAnt (talk • contribs) 08:47, 9 March 2020 (UTC)
Yes please. I would love to see one of those Timeline Case Summary tables for Australia, inc the percentage growth on the previous day. Would add it myself but not sure how. Thanks in advance! Charbono (talk) 15:13, 9 March 2020 (UTC)
I will do my first draft of the graph. Hopefully someone can go through and check it before it can be added to the main page if others want to. Please check data, edit, improve or change completely if you want. Maybe it can go next to the, "Cumulative national cases history," table but I am not sure how to put it next to it. I based it off the one from the UK page. I think perhaps it is too long now I have done it. - HelperAnt.
Is it possible to stratify the state-based cumulative numbers by recent international travellers and non travellers? That would help show where community spread is occuring. 2001:8003:793B:DA00:C57F:6CA9:8EF2:CD30 (talk) 12:01, 14 March 2020 (UTC)
Event cancellations
We have been including other news amongst the confirmed cases in the timeline. It looks like further massed events will be cancelled as the virus spreads and the impact of it spreads. Should we keep mentioning large event cancellations inside the Timeline? Or in a separate area (outside the timeline), or in both? How are other (maybe better) Wiki pages organised on pandemic topics? What would be the best way to organise this information? Tkh7 (talk) 23:53, 12 March 2020 (UTC)
I agree with you some separate sections might be a good idea especially as people might come here to know what is cancelled or what are the health warnings. Not sure how it is best to do though. China's page has lots of potential categories https://en.wikipedia.org/wiki/2019%E2%80%9320_coronavirus_pandemic_in_mainland_China So does USA https://en.wikipedia.org/wiki/2020_coronavirus_pandemic_in_the_United_States USA has the timeline section as this pages does then other categories underneath it. Also the information could possibly be split by state. UK has maybe some good categories also https://en.wikipedia.org/wiki/2020_coronavirus_pandemic_in_the_United_Kingdom#Testing_and_surveillance I think it's a good idea to go ahead if you want to add extra categories. I would but I am no expert on writing content. The German page splits it quite well also I think. https://en.wikipedia.org/wiki/2020_coronavirus_pandemic_in_Germany#Statistics -HelperAnt
I am going to make a new category for cancelled or postponed events. Should I get rid of mentions of cancellation and postponing in the article or leave them and reference all of them and new ones in the new category. Also, should I include school cancellations or leave them in the main text, personally I believe the school cancellations are important enough to be left in the main text. Hiyouboots (talk) 22:30, 13 March 2020 (UTC)
- I feel as though leaving the school cancellations in the main text would be fair because we have confirmed cases stemming from those schools, thus the cancellations are very significant in such a small area/group size and are effectively done to provide time for contact tracing in order to try to contain the spread of the virus. However, I think large events that are being cancelled or postponed should be in a separate area (most likely a subheading under the preventative measures category) as they are not done mainly to provide time for contact tracing. @Hiyouboots: What are others' thoughts on this? Tkh7 (talk) 23:29, 13 March 2020 (UTC)
There have been many events that I put under the South Australian category that were removed because they were "minor". What is and isn't minor? Hiyouboots (talk) 08:58, 14 March 2020 (UTC)
- There will be thousands of events cancelled in the coming months. It is not feasible to list them all (WP:NOTDIRECTORY). A singer cancelling a gig in a pub, or cancelled school sport, is certainly not notable. Perhaps we should only list cancelled events which have their own WP article, for example, 2020 Australian Grand Prix. WWGB (talk) 09:40, 14 March 2020 (UTC)
- That would seem the most logical approach. HiLo48 (talk) 21:59, 14 March 2020 (UTC)
Naming people infected with coronavirus
I just noticed in the edits that there is some difference of opinion when naming people that have died or are infected with coronavirus; I'm not sure what the wikipedia policy is on naming people in this situation, but I would like to know whether or not we should be naming infected/dead people, so future edits can be structured as such. @Tkh7: and @WWGB: I would like to know from you two especially since you two do a lot of the information about the cases. Stevedog8 (talk) 05:40, 8 March 2020 (UTC)
- WP:BLPNAME suggests that we ought not include the names - they don't add any value to the article (which is about the virus outbreak, not the people). (Per WP:BDP, BLP applies to those who have recently died.) Mitch Ames (talk) 05:54, 8 March 2020 (UTC)
We shouldn’t add names of just random people, but people of significance should be named (e.g. Tom Hanks, Peter Dutton). SnowyStarfall13 (talk) 10:07, 13 March 2020 (UTC)
- @SnowyStarfall13: How do we feel about Brett Dean? He is not a person of significance (this is debatable) but he is a composer and can be wikilinked? Tkh7 (talk) 23:04, 13 March 2020 (UTC)
- No names please. They add nothing. HiLo48 (talk) 23:14, 13 March 2020 (UTC)
- Disagree. Brett Dean is a person of significance in that he has an Wikipedia article and has met WP:GNG. It would be more relevant to include information on his current contacts and issues with corona-virus on his article page, rather than on this article, which is about the overall pandemic. However, it is notable that a senior member of the Government has tested positive, given the cabinet's and government's direct role in the response, so it is relevant that Peter Dutton is included here. Matilda Maniac (talk) 13:16, 15 March 2020 (UTC)
- No names please. They add nothing. HiLo48 (talk) 23:14, 13 March 2020 (UTC)
WikiProject COVID-19
I've created WikiProject COVID-19 as a temporary or permanent WikiProject and invite editors to use this space for discussing ways to improve coverage of the ongoing 2019–20 coronavirus pandemic. Please bring your ideas to the project/talk page. Stay safe, --Another Believer (Talk) 17:56, 15 March 2020 (UTC)
Bars have become too big for COVID-19 cases in Australia bar graph.
How do we fix this? Hiyouboots (talk) 13:07, 15 March 2020 (UTC)
- I tested the numbers and found the break happens once exceeding 275 cases, I posted a question about this on The template page Fanx (talk) 20:07, 15 March 2020 (UTC)
Why doesn't Australia publish the number of tests being done?
Is there a source for the number of tests that have been done in Australia? It is very interesting to see that, as some countries have the data available, those countries with more testing fare much better at handling the virus. Only today (17/3/2020) a government minister was saying that Australia is with the world's best with respect to testing, and at the same time news reports were saying there is a serious shortage of test kits. Here are stats for some countries, and has entries for NSW and ACT: https://ourworldindata.org/covid-testing — Preceding unsigned comment added by 203.173.7.252 (talk) 11:05, 17 March 2020 (UTC)
References
Update cumulative national cases history and chart numbers
The table "Cumulative confirmed cases history by state and territory" has been updated to today; however, another table "Cumulative national cases history" has not been updated. I think whomever editing table should update all tables at the same time. — Preceding unsigned comment added by Johnanderson632 (talk • contribs) 23:54, 17 March 2020 (UTC)
Numbers in this article are not consistent
Which is why I recommend we only stick to official numbers, even if it is limited to daily updates only. Either way, numbers need to match sources, in every single instance. And the data from all of those sources need to be consistent in the article overall. So important. El_C 22:39, 17 March 2020 (UTC)
- What we are doing here is we are taking each state total and adding them to get the national total. If people want government numbers they can go to the government site. The government can't keep up to date so we help people by stating how many cases there are right now rather than 12pm yesterday. Hiyouboots (talk) 22:46, 17 March 2020 (UTC)
- @Hiyouboots: Wikipedia is WP:NOTNEWS — the article not contradicting itself is more important than an xhourly update, I challenge. El_C 22:54, 17 March 2020 (UTC)
- @EL-C: Quote from what you just cited "Editors are encouraged to include current and up-to-date information within its coverage". The Government statistics are not current or up-to-date whereas adding totals of state cases is more current. Hiyouboots (talk) 23:07, 17 March 2020 (UTC)
- @Hiyouboots: that dosen't really respond to my argument — again, that overall consistency is more important than xhourly updates. El_C 23:10, 17 March 2020 (UTC)
- @EL-C: What exactly do you mean by consistency. Do you mean only sourcing from one site. Also we are trying very hard to make sure the article does not contradict itself, but I don't see what this has to do with toral cases since the number in the article is the same as in the infobox. Hiyouboots (talk) 23:24, 17 March 2020 (UTC)
- I mean the totals matching throughout the article, Hiyouboots. El_C 23:34, 17 March 2020 (UTC)
@EL-C:Do they not match Hiyouboots (talk) 23:41, 17 March 2020 (UTC)
Is that better? Hiyouboots (talk) 23:51, 17 March 2020 (UTC)
- Repeating that Wikipedia is WP:NOTNEWS; there is no requirement to update intraday. However, the number of people viewing Wikipedia articles relating to this current event translates into an increased number of editors - so article editing is less under control. Hence the 'disclaimer' on the Article's page as a Current event. For example, Information may already be out-of-date by the time it is added. Inconsistencies will develop, so I encourage those with time to do so to simply try to rectify those inconsistencies, as the most important consideration with this increased traffic is that they have been done in WP:GOODFAITH. Matilda Maniac (talk) 00:04, 18 March 2020 (UTC)
- Hiyouboots, yes, that's better. I still think we should stick to the official totals only, even if they're only provided daily, because I envision this problem reoccurring with future updates. But for now, I suppose this works — let's see how it goes, sure. El_C 00:01, 18 March 2020 (UTC)
Number of cases in first paragraph incorrect
Hi all - I can't edit, so hopefully someone with that capability can fix this. The first paragraph lists the current number of cases in Australia as 575. The cumulative cases table at the bottom shows 454, which corresponds to the reported cases by each state / territory. Is someone able to fix this top figure? — Preceding unsigned comment added by LargageZero (talk • contribs) 23:35, 17 March 2020 (UTC)
EDIT - this has now been corrected. — Preceding unsigned comment added by LargageZero (talk • contribs) 00:47, 18 March 2020 (UTC)
Economic impact
Can someone please work on the Economic section of the article as we barely have any resources stating the impact on the economic side in Australia, thanks. HawkAussie (talk) 03:18, 18 March 2020 (UTC)
Semi-protected edit request on 18 March 2020
This edit request to 2020 coronavirus pandemic in Australia has been answered. Set the |answered= or |ans= parameter to no to reactivate your request. |
Change the map so a different colour is for 100 cases
203.214.147.49 (talk) 05:24, 18 March 2020 (UTC)
 Not done for now: please establish a consensus for this alteration before using the
 {{edit semi-protected}}template. Alucard 16❯❯❯ chat? 06:09, 18 March 2020 (UTC)
Geordannik1 (talk) 07:05, 18 March 2020 (UTC) NSW confirmed cases is miscounted
Citing the same source [1] among others [2] Off by -1 [3]
Geordannik1 (talk) 07:08, 18 March 2020 (UTC)
References
- ^ https://7news.com.au/lifestyle/health-wellbeing/coronavirus-death-sixth-australian-dies-from-the-virus-c-750988.
{{cite web}}: Missing or empty|title=(help) - ^ https://www.smh.com.au/national/nsw/nsw-confirms-more-than-50-new-cases-in-sydney-in-24-hours-20200318-p54bc4.html?utm_medium=Social&utm_source=Twitter#Echobox=1584501134
- ^ https://www.health.nsw.gov.au/news/Pages/20200318_00.aspx
Semi-protected edit request on 18 March 2020
This edit request to 2020 coronavirus pandemic in Australia has been answered. Set the |answered= or |ans= parameter to no to reactivate your request. |
Change Tasmania's cases of coronavirus on 18/3/2020 from 7 to 10. Rajthedoctor (talk) 08:54, 18 March 2020 (UTC)
 Already done Alucard 16❯❯❯ chat? 10:03, 18 March 2020 (UTC)
Update QLD stats from 94 to 144
I am not sure how I request to edit the page. But here is a reference for someone to edit.
This edit request to 2020 coronavirus pandemic in Australia has been answered. Set the |answered= or |ans= parameter to no to reactivate your request. |
https://www.abc.net.au/news/2020-03-19/coronavirus-queensland-cases-rise-50-ine-one-day/12070902 — Preceding unsigned comment added by Johnanderson632 (talk • contribs) 06:39, 19 March 2020 (UTC)
 Done @Johnanderson632: It's okay I was able to understand the request no worries! For future reference the simplest approach for edit requests is to click the "View source" tab on any page you want to edit then click "Submit an edit request" which will load the appropriate template on the talk page. Then you just format your request like this: "Please update QLD cumulative stats from 94 to 144" with the source in brackets like [ ] so it displays like [4] <- this. Hope that helps. Alucard 16❯❯❯ chat? 08:34, 19 March 2020 (UTC)
- Currently the page is protected from newly registered accounts and IP address to prevent vandalism and unsourced information. Once your account becomes established you will be able to edit the page. Currently the page is semi-protected. Alucard 16❯❯❯ chat? 08:38, 19 March 2020 (UTC)
Super! Thanks. This page is only page that helps people to see all stats. Hence I guess fast reliable update would be helping many Australians. I wish I can be confirmed soon so I can update without hassling moderators. Johnanderson632 (talk) 09:17, 19 March 2020 (UTC)
New cases for NSW and another death
This edit request has been answered. Set the |answered= or |ans= parameter to no to reactivate your request. |
NSW Health just announced there are 46 new cases which make a total of 353. And an 81-year-old woman died yesterday. [5]
I did wrong again :( I had to click view source and submit an edit request, but just opened a new topic. Next time I will do correctly.
- Already done It's okay no worries mate! Thanks for trying to keep the page up to date :) Looks like everything in this request has already been done. Alucard 16❯❯❯ chat? 07:06, 20 March 2020 (UTC)
I checked the page and I didn't see that error it may have been fixed already. If it hasn't please reopen this request. Alucard 16❯❯❯ chat? 07:07, 20 March 2020 (UTC)-->
Total cases
@Ear-phone: I would like to ask whether the numbers of total cases are intended to represent the total cases reported at the early hours of each day as is the data released by the Department of Health, or at the end of each day. Onmaditque (talk) 08:31, 7 March 2020 (UTC)
- @Onmaditque: I think the total cases reported that are being released by the Department of Health is all cases reported before 9am that day, and each update adds the number of new reported cases and recoveries from 9am the previous day to 9am of the current day. Stevedog8 (talk) 12:11, 7 March 2020 (UTC)
I have an issue with the total number of cases. I have been extensively tracking the confirmed cases each day and have been keeping my own record of each. Earlier on, each confirmed case had gone back to their state for medical treatment. The case of the Goulburn man, whether he has returned to his home state, has been counted in the NSW tally and removed from the NT tally by the Department of Health. Since 6 March, this one particular case has been double counted in many news agency reports as one case in NSW AND one case in NT. However according to the Department of Health, he only counts as one case and their daily total as reported on their site reflects that NT currently has no cases as his case was already included in the NSW total. I was confused for some time about this and I can understand the news agencies might be too. However I was determined to understand why the figures did not correlate and after much research, I reached the above conclusions. Prior to Tasmania recording its second case, the national total stood at 70 (or 71 as incorrectly reported by many news agencies and this wiki page itself). My question is this: is this wiki page displaying the number of PEOPLE infected? 70? Or the number of cases (so the Goulburn/Darwin person is two cases) treated by each state, where this Goulburn man might be treated as both a NT case AND a NSW case? Tkh7 (talk) 09:45, 7 March 2020 (UTC)
- @Tkh7: Officially, the Goulburn man case is treated as a NSW case only and one case only, not a case in both NT and NSW. So this wiki page will display the current number of people infected by coronavirus in Australia and by state where the case is located currently (so the NT case will be counted as a NSW case as the Goulburn man is currently being treated in his home state, NSW), this is my current position on it and what should be used in future counts. Stevedog8 (talk) 11:42, 7 March 2020 (UTC)
- @Stevedog8: I agree with you. Therefore the current total for NSW is 34 regardless as it already includes the Goulburn man. However, that means the national total should then be only 70 (prior to the addition of the second Tasmania case) as 71 would be counting him twice (once for NSW and once for NT). That also means the count for NSW alone should be 34, which has been correctly reported by media outlets. 35 would be incorrect as it would mean we are counting the Goulburn man twice in the tally for NSW. Thank you. Tkh7 (talk) 11:51, 7 March 2020 (UTC)
The total number of cases on this wikipedia page as of 10:36am 11-3-2020 is 115 which may be in error as it is one less than worldometers' figure of 116. https://www.worldometers.info/coronavirus/#countries
@Tkh7: I just saw this conversation and thank you for your clarification. Both NSW and Victorian state health department have reported a Victorian resident diagnosed in NSW. This case is counted in the tally of NSW Health, but not in the tally of Victorian Department of Health & Human Services, since the Victorian resident has not yet returned to their home state. According to your rule of counting "the current number of people infected by coronavirus in Australia and by state where the case is located currently", we should not deduct one from the tally reported by NSW Health and add one to the tally reported by Victorian Department of Health & Human Services, which I have been doing. I have corrected this error and removed note c from the state-by-ate table. Onmaditque (talk) 12:25, 12 March 2020 (UTC)
- @Onmaditque: NSW Health have indicated that their tally includes a Victorian resident and Health Victoria has since confirmed that one of their "latest six cases" is the earlier confirmed Victorian resident that was originally diagnosed and counted in the NSW tally, but is now counted in the Vic tally. National figures count the case as a Vic case and not a NSW case. Therefore, from here on in, the case of this Victorian resident that was diagnosed in NSW should be counted as a Victorian case (unless otherwise described the national figures). Tkh7 (talk) 12:37, 12 March 2020 (UTC)
- @Tkh7: Health Victoria said today "The new cases include six men aged between 30-70. All cases are recovering at home in isolation. Of the six new cases, five have a history of international travel. One is a close contact of a confirmed case" and "One ADDITIONAL case is an existing case from NSW now counted in Victorian statistics, as they are a Victorian resident",[1]which means the "latest six cases" and the 27 confirmed cases do NOT include the Victorian resident diagnosed in NSW. I think after the Victorian resident returned to their home state, NSW Health will deduct them in their tally and Health Victoria will add them to their tally, just like NSW Health added the Goulburn man diagnosed in Darwin to its tally after he returned to NSW. Onmaditque (talk) 12:58, 12 March 2020 (UTC)
- @Onmaditque: I believe the important note there is the statement that you quoted: "an existing case from NSW now counted in Victorian statistics". The earlier cases were transferred to their home states for treatment AFTER they were repatriated from the Diamond Princess cruise ship and held in the Darwin quarantine centre BECAUSE of the repatriation and quarantine. This most likely will not be the case for future cases. In the case of the Victorian resident, he was not repatriated from a cruise ship or quarantined elsewhere and I don't believe they are waiting for him to return to his home state before "deducting" him from the NSW tally. I have kept a record of every case confirmed so far in Australia and this case IS included in Victoria's current tally of 27. However, if you ALSO count it in NSW (becoming a total of 78), then you are double counting a case and not accurately reflecting the number of patients confirmed. Furthermore, no cases are "removed" from tallies once they have recovered and whether or not the patient has been transferred to his home state would most likely not be mentioned any further in reports due to some organisations refusing to report on the whereabouts of their patients in respect of their privacy. Thus, if any case is a confirmed resident of one state but diagnosed in another, they should be counted in their state of residency, regardless of whether they have finished treatment. Tkh7 (talk) 13:33, 12 March 2020 (UTC)
- @Onmaditque: "Note that under National Notifiable Diseases Surveillance System reporting requirements, cases are reported based on their Australian jurisdiction of residence rather than where they were detected. For example, a case reported previously in the NT in a NSW resident is counted in the national figures as a NSW case."[2] Tkh7 (talk) 11:40, 14 March 2020 (UTC)
So far, it seems that as of yesterday, there is under-reporting. Yesterday, 3 cases were confirmed in Orange, NSW (see https://www.centralwesterndaily.com.au/story/6676758/three-confirmed-cases-of-coronavirus-in-orange/). I see no mention of this in the article. And though it is personal research (I live in Orange) and therefore not admissible, I know that 2 of these were high school students. And no-one of high school age is listed in the recent NSW cases. In addition, it would be helpful if the towns where cases occur were indicated. There is tendency in regional/rural areas to consider this a big city problem; indicating the geographical spread would help counteract this. Or a map showing the location of cases. Ptilinopus (talk) 02:36, 14 March 2020 (UTC)
@Tkh7: Under-reporting is one thing; it bothers me deeply that we are surrounded by published information to an incredible depth, and still nobody appears to be interpreting these data in a manner sufficient to instil the requisite respect. As at Saturday 02:42, 21 March 2020 (UTC), health.nsw.gov.au cite 382 confirmed cases and 6 deaths. Regardless of the specific history of each confirmed case, some not very complicated algebra informs us of a fatality rate of the order of 2% --- a more precise estimate would be appreciated. Data from China suggests a duration infection to fatality of the order of 15 days --- again, bring on a better approximations. Naively, 6 deaths and a fatality rate of 2% suggests that at least at the time that the last fatality was infected (around 7 March 2020? a time when NSW was reporting 28 confirmed cases), there could have been at least 300 cases in the community, 28 confirmed, the remainder unconfirmed. Published NSW data suggests a case doubling time of the order of 3 days, 15 days representing 5 doublings, community cases could be at least of the order of 9600 today, as a figure of 382 confirmed cases is published. Surfking67 (talk) 03:04, 21 March 2020 (UTC)
@Tkh7:@Surfking67: I came to the page to check if the statistics were charting the Doubling Time. --- I should mention that I'm inexperienced with Wikipedia, and am open to lots of guidance. --- So, Doubling Time is a useful interpretation of the Infection numbers. --- An example of it is being reported by Professor Andreas Burkert in University of Munchen, using WHO and Robert Koch Institute information. It includes the Doubling Time for Australia, and significantly our trend line is important to watch. Professor Burkett is posting this chart on his facebook and twitter accounts. e.g. https://www.facebook.com/andreas.burkert.54 His charts included attribution to WHO and Robert Koch Institute. --- Could we find a local source showing Doubling Time (DT)? I have found these two local data sites: https://www.covid19data.com.au/ and https://covid-19-au.github.io/. These have more analysis but not yet including Doubling Time (DT). Ryderesident (talk) 21:27, 21 March 2020 (UTC)
Problem with tracking case numbers
Hi guys I have a problem with the total that you have at end-of-day, and also trying to reconcile that total across several sites. I believe that the Worldometer site is using dynamic counters that are estimating cases, and then they adjust the case number to actual at some interval I have not determined. I have seen them go backwards (being a nite owl watching this data).
I decided that the John Hopkins medical dashboard was authoritative because they are using the WHO situation reports. I have been plotting data from sites for a few days now and it is driving me bananas. Where are you getting your data, and why is it different to the AU case reports? Why are Bing and worldometer larger than WHO? Why are your numbers seeming in advance of the case reports that you reference? This needs to be resolved, its very difficult to plot the Growth Factor and determine Doubling intervals when data is unreconcillable making it questionable or dare I say looking predictive? Please discuss your sources and techniques. — Preceding unsigned comment added by Raef.senior (talk • contribs) 13:16, 21 March 2020 (UTC)
- The data used here comes from the state and territory daily bulletins. No doubt it is ahead of WHO counts.--Grahame (talk) 02:54, 22 March 2020 (UTC)
Update info with ABC live blog
'Reliable' government source: https://www.abc.net.au/news/2020-03-22/coronavirus-australia-live-updates-covid-19-latest-news-lockdown/12078506
Can someone update and fact-check everything (especially in the timelines, i saw some spelling mistakes and assumed the author was in a rush)?
Australia federal/commonwealth government shut down
I'm starting a discussion given the risk of further disputes. I don't understand most of this edit [6] as I explained in my reversion [7]. Firstly, the bit I do understand is that the federal government's decision to allow restaurants, cafes, bottleshops, schools etc to remain open doesn't affect the state government's decisions to close these and therefore if we are going to mention this, we need to make this clearer. So I left that part out of my second edits.
However, I don't understand what User:Ashton 29 means about the rest of it. Unless I've missed it through multiple read through, there's no mention of the Australian federal government ordered closures in the lead. I'm aware the article proper does discuss the federal government's shut down, if you look at my first edits, that's where I copied the section from. [8] [9] It's also why I didn't provide refs since strictly speaking refs are rarely required for the lead since the lead should be duplicating what's in the article proper. (I appreciate that with an article as active as this, some may prefer refs for the lead so have no objection if people want to duplicate them.)
Anyway I'm a Kiwi so maybe there's something I don't understand. The main reason I'm here is because I'd earlier read about NSW and Victoria and happened to see the federal government shutdown on the BBC at first thinking it was referring to the NSW/Victoria actions then realising it was actually from the federal government and it seemed a big development so was surprised to visit this article and find no mention of it in the lead.
As I understand it, the federal government's actions are going to affect all of Australia. (Well I'm not sure about Christmas Island and stuff like that.) While I appreciate NSW and Victoria are already doing similar stuff, and going further than that, as said in my edit summary, it seems fairly weird even considering the population being centred in those 2 states to fail to mention what is going on in the rest of Australia in the lead when it's something as significant as this. (Queensland does have nearly 5 million or ~18% of the population after all.)
I mean we already mention the border closures of the other states. Is there some reason why the federal governments actions to shutdown places of social gathering should only be mentioned in the article but not in the lead? We also already mention the requirement for 4 square metre distancing as well which frankly seems less significant than the complete closure of places of social gathering. Is there something else that I've missed and the sources haven't made clear? Are the federal government ordered shutdowns only advisory and it's up to the other states to implement them or something?
Official statistics have more recent numbers
I checked "Coronavirus (COVID-19) current situation and case numbers"[10], which is official statistics by the government. Although each state website is not updated as the federal health department. What is the best way to update the cumulative total cases table in this case? should I just update all numbers and leave cite on total? — Preceding unsigned comment added by Johnanderson632 (talk • contribs) 06:27, 23 March 2020 (UTC)
March: Overly Detailed
Hi Contributors. I was considering placing the Template:Overly detailed on the March 2020 sections but thought I'd bring the conversation here first. There is absolutely no need for the level of detail in those sections which basically list out each case as it was reported. As you can see, by the time you get to week 3 this becomes impossible and hence the level of prior detail becomes irrelevant and I believe needs to be significantly summarised. When you look back at this as a historical event it is definitely more reading than necessary in my opinion. Glancing at a few of the pages for other countries I don't see them being so comprehensive. Thoughts of others? Clifton9 (talk) 11:12, 22 March 2020 (UTC)
I agree with the sentiment, though could they be buried under another layer of headings (eg by day)? I don’t know, but it is becoming a wall of text Iamthinking2202 (talk) 07:26, 23 March 2020 (UTC)
Semi-protected edit request on 23 March 2020
This edit request to 2020 coronavirus pandemic in Australia has been answered. Set the |answered= or |ans= parameter to no to reactivate your request. |
Notice the total cases to date chart has been changed from a linear scale to a logarithmic scale. Personally I preferred the Linear scale as it was easier to predict as the whether the graph was approaching an inflection point ready to curve over.
Just my personal observation but thought I'd put forward the suggestion.
Phil. 203.129.24.45 (talk) 03:21, 23 March 2020 (UTC)
- I don't see how you can interpret that with a cumulative linear graph. On the semilog graph of either the cumulative or new cases data, when the slope weakens (no longer a straight line in the graph) you know that the second derivative of the cumulative case count has become negative: that's the first sign that lockdown type measures are having an effect. This is visible in some of the East/SE Asian and EU countries' data. The new cases graph will show a maximum of new cases/day on the same day, no matter whether the graph is linear or semilog. Boud (talk) 16:41, 23 March 2020 (UTC)
Semi-protected edit request on 24 March 2020
This edit request to 2020 coronavirus pandemic in Australia has been answered. Set the |answered= or |ans= parameter to no to reactivate your request. |
Wanted to be able to edit this page, because some of the formatting is about out, namely the graph at the bottom of the page whch goes into the notes sections, it looks bad. Rorzay (talk) 02:45, 24 March 2020 (UTC)
![]() Done Answer: I think it's fixed now. I added | position = left
HelperAnt (talk)HelperAnt
Done Answer: I think it's fixed now. I added | position = left
HelperAnt (talk)HelperAnt
Impact for WA
No one is gonna lists the impacts it has on WA? NakhlaMan (talk) 09:02, 22 March 2020 (UTC)
@NakhlaMan: If you want to try and bring some impacts for Western Australia, you can help out as I reckon their would be some major events in the state that has been affected. HawkAussie (talk) 05:01, 24 March 2020 (UTC)
Semi-protected edit request on 20 March 2020
This edit request to 2020 coronavirus pandemic in Australia has been answered. Set the |answered= or |ans= parameter to no to reactivate your request. |
Add COVID-19 by Status plot

Laiyiyin (talk) 04:43, 20 March 2020 (UTC)
 Not done Please phrase your request in the form of "change X to Y" and cite your sources. Mgasparin (talk) 19:51, 24 March 2020 (UTC)
Semi-protected edit request on 21 March 2020
This edit request to 2020 coronavirus pandemic in Australia has been answered. Set the |answered= or |ans= parameter to no to reactivate your request. |
Victoria just announced new 51 cases and now total is 229 https://7news.com.au/lifestyle/health-wellbeing/victoria-sees-massive-jump-in-number-of-coronavirus-cases--c-755765 Johnanderson632 (talk) 00:20, 21 March 2020 (UTC)
 Already done Mgasparin (talk) 19:52, 24 March 2020 (UTC)
NSW count for 24 March
Hi, the number of cases you have included for NSW in your tables for 24 March is not consistent with the previous numbers in the series. The number of cases shown for NSW are the number of cases at 8pm on the previous evening (so for example, the 23 March figure is actually the number at 8pm on 22 March). The number you have shown on 24 March is the number at 3pm on 24 March, not the number at 8pm of the previous night. The "correct" number should be 818. This is important as politicians/the press are talking about a 116 increase in cases (which looks like improved numbers from the previous day), whereas the actual increase should be 211. Thanks, Karen Cutter 119.18.2.66 (talk) 22:31, 24 March 2020 (UTC)
External territories
The article states "No cases have been reported in [...] the external territories of Christmas Island, the Cocos (Keeling) Islands and Norfolk Island." What about Australian Antarctic Territory and Coral Sea Islands? Ypna (talk) 02:29, 26 March 2020 (UTC)
Update on total number of cases in Tasmania 26 March 2020
5 new cases, brings tally to 47 [3] Susietran (talk) 10:01, 26 March 2020 (UTC)
Semilog graph option enabled for the states graph
Just as the top of this article has semilog plots for world-scale data, we now have a semilog plot for the per-state data in Oz. I put 1.2^(days) as a round number guide for the eye. Comment: Unsurprisingly, without the extreme lockdowns like in China and Europe (especially PL, CZ, SK), the exponentials will continue unchanged for many weeks. 1.2^13 is just over 10. So "business as usual" or "business just slightly unusual" will mean about 13k lab-confirmed infections by 23+13=36 March, aka 5 April, nationally, with 6000 cases in NSW (and 60 deaths in NSW, if the roughly 1% crude fatality rate in Oz continues). This is slower than most of the EU rates, many of which are around +30% to +40%/day. Maybe because of the lower population density. Or the warm weather. Boud (talk) 00:36, 23 March 2020 (UTC)
- Comment: In case it's not obvious, this also means that without serious lockdowns like in China and the EU (especially PL, CZ, SK around 12 March), another month of 1.2^d would give about 60,000 SARS-CoV-2 cases in NSW by 18 April 2020, with 600 COVID-19 deaths; or 130,000 SARS-CoV-2 cases in Australia, with about 1,300 or so COVID-19 deaths. The semilog graph shows clearly that there is no sign of any weakening of the exponential growth in NSW for three weeks. (I heard a rumour of a "tipping point" - which is nonsense in the light of this data; the tipping point - sustained local transmission giving exponential growth - was passed in NSW three weeks ago, and in several states about two weeks ago. Just look at the graph.) For any of this elementary interpretation to go in the article, external sources would be needed, of course. Boud (talk) 01:42, 23 March 2020 (UTC)
- Comment: The cumulative totals [11] do not "look right" and misrepresent the data to a naive viewer. The graph renderer seems to be rounding points to the nearest line division, which quantises away detail resulting in "flat sections" of the graph. A naive viewer may also not realise what a semi-log graph means in terms of actual growth. The growth graph is also still a "linear" graph. An important property of an exponential curve is that its derivate (rate of change) exhibits the same shape as the original curve, and this would be best shown when both the cumulative totals and growth graphs were shown on a linear graph. — Preceding unsigned comment added by 193.114.96.60 (talk) 02:55, 23 March 2020 (UTC)
- Linear plots misrepresent the data on exponential growth#Biology to a viewer who wants encyclopedic information. This is an encyclopedia about a topic of (for at least the past three weeks in NSW, and for the past two weeks in much of the rest of Australia) the exponential growth of a virus. There is quantisation, because the official data count people as integers, which is quite reasonable. I've added links in the titles and captions to help readers learn.
The growth graph is also still a "linear" graph.
I'm not sure what the argument is here: probably you're trying to say that log(1.2^d) plotted against d is a straight line, because log(1.2^d) = d log(1.2). True. That's why an epidemic, with exponential growth, is most usefully shown with a semilog plot. It's true that a linear graph can help show the reader that d/dt(e^t) = e^t, at the most recent stages, but then most of the early growth phases are missing. The states/territories graph gives the +20%/day line (1.2^d) to encourage the reader to think about what the graph means in simple terms - this has been done in other similar graphs. - The fact that the SARS-CoV-2 epidemic has been exponential for three weeks in NSW (and two weeks in several other populous states) is invisible if the graph is linear; it is clearly visible in the semilog version. It's not the role of Wikipedia to support misinformation - the rumour that the SARS-CoV-2 epidemic in Australia only just started its local transmission, exponentially growing phase. It's true that some people will not understand semilog graphs, despite being given help to do so, but there are also people who have difficulty understanding graphs at all. These graphs do have the powers of 10 written out early primary school style, rather than with indices (1, 10, 10^2, 10^3, 10^4, ...), aiming at the less mathematically advanced reader. Boud (talk) 16:25, 23 March 2020 (UTC)
- Linear plots misrepresent the data on exponential growth#Biology to a viewer who wants encyclopedic information. This is an encyclopedia about a topic of (for at least the past three weeks in NSW, and for the past two weeks in much of the rest of Australia) the exponential growth of a virus. There is quantisation, because the official data count people as integers, which is quite reasonable. I've added links in the titles and captions to help readers learn.
Solution: return an original graph seen with those on the Coronavirus pandemic pages of other countries (eg: United Kingdom) that demonstrate the curve, and continue to have the logarithmic graph for those who prefer to see case data in that format. The best of both worlds for different viewers with different preferences! Macraesam17 (talk) 01:48, 26 March 2020 (UTC)
Also to my previous comment on having both forms of graphs^ include both for the states, and the national totals for Australia. Macraesam17 (talk) 01:50, 26 March 2020 (UTC)
- Do you mean to have a button to click, like for sortability? So that the user can choose which s/he wants? I think that that would be an excellent idea. That would require someone who knows lua/html well enough to propose a change in the de:Modul:Graph and get it tested properly before making it "live". I'm not sure which page is the natural page for attracting geeky attention and discussing this. Possible pages include: Module_talk:Chart, Template talk:Graph:Chart or Module_talk:Graph.
- A temporary alternative would be to include two copies, one with |yScaleType = log and one without. But then editors would have to update the data for both graphs each time. It's doable, but not the neatest solution. Another option would be to find one of the navboxes to enclose the graph - like Template:Side box - that has an option to make the graph hidden by default, like for some tables, with an obvious button "Show" (and "Hide" to toggle back). That way, one option could be chosen to be unhidden by default, and the other to be hidden by default. Boud (talk) 14:46, 26 March 2020 (UTC)
cases jump
pls add additional information about Australia case has been increasing due to the ships, where people disembarked. — Preceding unsigned comment added by 194.193.223.146 (talk) 00:35, 27 March 2020 (UTC)
new cases ACT 27.3.20
[4] 9 new cases, total now 62Susietran (talk) 02:47, 27 March 2020 (UTC)
Panic Buying and Shortages in Goods
The Coronavirus resulted in panic buying across Australia resulting in shortages in durable and long life. This resulted in people across Australia and globally to panic buy toilet paper resulting in shortages and reports of violence in Australia and abroad.
It is unclear exactly why toilet paper has become the hot ticket item for a potential battle with a respiratory infection, but there isn't much logical about these scenes, which some psychologists are suggesting is a demonstration of herd mentality. — Preceding unsigned comment added by 220.240.22.51 (talk) 06:47, 27 March 2020 (UTC)
Edit Request
Groovin The Moo and Download Festival cancelled (Victoria) Lmills36 (talk) 07:01, 27 March 2020 (UTC)
Recoveries
It is clear that the relevant state authorities are not maintaining the data on 'recovered' cases and in all likelihood it is not possible for it ever to be accurate. Therefore, if it is not accurate then there really is no point in publishing it on this page and I suggest that it needs to be removed. I think it is reasonable to consider that this data is dubious and it's removal requires discussion.Clifton9 (talk) 07:36, 25 March 2020 (UTC)
- Recovered numbers are remarkably similar to cases for 14 days earlier, which is what you would expect. It suggests that over time recoveries are reported.--Grahame (talk) 01:59, 26 March 2020 (UTC)
- Thanks Grahame, good observation. Will continue to monitor it and re-visit the topic if it doesn't appear to be keeping up. Clifton9 (talk) 02:23, 26 March 2020 (UTC)
- NSW finally disclosed how many patients are receiving active treatment, it should be safe to assume the others have recovered. They only officially reported the original 4 patients from China. https://www.health.nsw.gov.au/news/Pages/20200327_00.aspx Liam Skoda (talk) 04:13, 27 March 2020 (UTC)
- Just saw this on the ABC website - *Recoveries are likely to be much higher as this figure is only reported in four jurisdictions. and A NSW Health media spokeswoman told ABC News it does not report this figure because it is too difficult to define when a person is considered to have recovered from the disease. I think based on these statements all of the reporting in these graphs should be removed as it's inaccurate and provides false data. Clifton9 (talk) 23:09, 28 March 2020 (UTC)
- NSW finally disclosed how many patients are receiving active treatment, it should be safe to assume the others have recovered. They only officially reported the original 4 patients from China. https://www.health.nsw.gov.au/news/Pages/20200327_00.aspx Liam Skoda (talk) 04:13, 27 March 2020 (UTC)
- Thanks Grahame, good observation. Will continue to monitor it and re-visit the topic if it doesn't appear to be keeping up. Clifton9 (talk) 02:23, 26 March 2020 (UTC)
References - Someone removed all the references for the count.
Do you think the references for case numbers per day for the states in the table should still be included? — Preceding unsigned comment added by 112.213.221.145 (talk) 01:15, 30 March 2020 (UTC)
- Definitely not. There is no need to have a reference per state for each and every day this continues. This comes under WP:TOOMANYREFS. Clifton9 (talk) 06:45, 30 March 2020 (UTC)
- Yes, there is a need. Especially as they are inconsistent with the commonwealth figures. Not every single figure, but the general sources should certainly be referenced.Tuntable (talk) 01:48, 31 March 2020 (UTC)
- Most other countries seem to have a column at the right hand side of the table for the references of where the figures came from. For instance in this table on Switzerland's page. https://en.wikipedia.org/wiki/2020_coronavirus_pandemic_in_Switzerland#Statistics — Preceding unsigned comment added by 112.213.221.145 (talk) 02:24, 31 March 2020 (UTC)
- There is a need to have a reference for each state's data, but there doesn't need to be a fresh reference added every day for every state as was occurring. It was just clutter and as per prior comment, was WP:TOOMANYREFS. We also have duplicated data and the whole thing needs a clean up. A template such as the Switzerland example is required. Clifton9 (talk) 03:31, 31 March 2020 (UTC)
- Most other countries seem to have a column at the right hand side of the table for the references of where the figures came from. For instance in this table on Switzerland's page. https://en.wikipedia.org/wiki/2020_coronavirus_pandemic_in_Switzerland#Statistics — Preceding unsigned comment added by 112.213.221.145 (talk) 02:24, 31 March 2020 (UTC)
- Yes, there is a need. Especially as they are inconsistent with the commonwealth figures. Not every single figure, but the general sources should certainly be referenced.Tuntable (talk) 01:48, 31 March 2020 (UTC)
Semi-protected edit request on 26 March 2020 - update Death Count
This edit request to 2020 coronavirus pandemic in Australia has been answered. Set the |answered= or |ans= parameter to no to reactivate your request. |
UPDATE DEATH COUNT, so CHANGE Genyobne (talk) 03:15, 26 March 2020 (UTC)
- Pretty sure this has happened by now. Count today is 19. Graeme Bartlett (talk) 03:35, 31 March 2020 (UTC)
Semi-protected edit request on 26 March 2020
This edit request to 2020 coronavirus pandemic in Australia has been answered. Set the |answered= or |ans= parameter to no to reactivate your request. |
Change Genyobne (talk) 03:36, 26 March 2020 (UTC)
- You haven't asked what to change. Graeme Bartlett (talk) 03:36, 31 March 2020 (UTC)
Inconsistent data, no citation
Where did the numbers for the graphs at the end of the article actually come from? We need a specific reference. Certainly they are inconsistent with the Australian government one
which shows 195 and 100 new cases for 28 and 29 March.
There is minimal analysis either in this article or elsewhere as to what these numbers actually mean, due to very poor data that seems to be publicly available.
If anyone has better data that would be good. Reading back from the Source of Transmission on that page using archive.org would give some better info, but is tedious and I cannot bother doing battle with Original Research nazis even though it is government data. If I get support I might do that.
But if anyone knows or can access better data that would be great. Tuntable (talk) 01:30, 31 March 2020 (UTC)
- Some one removed all the citations for the state counts. However basically they are the official state health department releases that come out at various times in the day. Vic and NSW in the morning, ACT at 1.30 pm, Tas very late in the day ... The Australian govt figures will be one point in time on the day, with figures posted many hours later. Our state's figures will be whatever is released by midnight. You cannot really count on knowing exactly what happened by midnight as it takes time for all the organisations to report and compile and release. If we want a better picture we would need to know when the sample was collected, and confirmed positive for each case. Poibly back date to when symptoms first appeared. Graeme Bartlett (talk) 03:32, 31 March 2020 (UTC)
- Graeme Bartlett Do you know where they actually come from?
Citations should definitely be there. Maybe generic ones if there is a date in the URL, but not nothing. There is not much from Queensland that I could find, for example. Tuntable (talk) 04:39, 31 March 2020 (UTC)
- I will also admit I have updated based on a press conference of the premiers of the states. They regularly announce their figures at a press conference. Graeme Bartlett (talk) 05:26, 31 March 2020 (UTC)
- Listing indexes to sources as I come across them:
- ACT https://www.covid19.act.gov.au/updates
- SA http://emergencydepartments.sa.gov.au/wps/wcm/connect/public+content/sa+health+internet/health+topics/health+topics+a+-+z/covid+2019/latest+updates/confirmed+and+suspected+cases+of+covid-19+in+south+australia
- TAS https://www.dhhs.tas.gov.au/news/2020
- NT https://coronavirus.nt.gov.au/home has count at the top and updates listed lower down the page
- QLD https://www.qld.gov.au/health/conditions/health-alerts/coronavirus-covid-19/current-status/current-status-and-contact-tracing-alerts
- NSW https://www.health.nsw.gov.au/news/Pages/2020-nsw-health.aspx
- VIC https://www.dhhs.vic.gov.au/coronavirus
- WA https://ww2.health.wa.gov.au/Articles/A_E/Coronavirus/COVID19-statistics
Also the ABC Chinese site is not too far behind: https://www.abc.net.au/chinese/2020-03-27/australia-coronavirus-live-update-latest-news-/12095358 Graeme Bartlett (talk) 05:26, 31 March 2020 (UTC)
- Added most of those references into the table except NT link didn't work. The Guardian website also has good stats but ultimately there isn't always going to be alignment due to different reporting times. It would take a bit of time and patience to grab all the data from that site and align it to what is on this page and then double check all the data that has been loaded into all the separate graphs.Clifton9 (talk) 06:49, 31 March 2020 (UTC)
Semi-protected edit request on 31 March 2020
This edit request to 2020 coronavirus pandemic in Australia has been answered. Set the |answered= or |ans= parameter to no to reactivate your request. |
The chart showing Australian deaths by date has the wrong Y axis as the first two rows are both noted as 1 death. Paul Arthur Stevenson (talk) 11:16, 31 March 2020 (UTC)
 Done. Had to set a maximum y-axis value of 7 to make it work so should Australia unfortunately exceed that figure in 1 day then the value will need updating to display correctly. Clifton9 (talk) 12:31, 31 March 2020 (UTC)
NSW Epidemiological curve -- Where Aquired
This is work in progress for what I think is the most important graph.Tuntable (talk) 06:40, 1 April 2020 (UTC) https://www.health.nsw.gov.au/Infectious/diseases/Pages/covid-19-latest.aspx#statistics
| Graphs are unavailable due to technical issues. There is more info on Phabricator and on MediaWiki.org. |
Damn. Only supports two stacks.
Interesting link, opinion on fall. https://www.theguardian.com/australia-news/datablog/2020/apr/01/is-australia-flattening-the-coronavirus-curve-look-at-the-charts-
And some attempt at analyzing effect of measures https://colab.research.google.com/drive/1X72xXEm1FCYpwo5OiRGhDUelMyicRj2L
Semi-protected edit request on 1 April 2020
This edit request to 2020 coronavirus pandemic in Australia has been answered. Set the |answered= or |ans= parameter to no to reactivate your request. |
Additional case numbers and references for Queensland to be added to the table "Cumulative confirmed cases by State, Territory & Nationally"
Confirmed cases as at 22 February 2020 "7" [5]
Confirmed cases as at 29th February 2020 "9" [6]
Confirmed cases as at 3rd March 2020 "10" [7] Realjbrown (talk) 05:27, 1 April 2020 (UTC)
- Done. Thanks. Clifton9 (talk) 09:15, 1 April 2020 (UTC)
References
- ^ "More COVID-19 cases confirmed in Victoria". Victorian Department of Health & Human Services. 2020-03-12. Retrieved 2020-03-12.
{{cite web}}: CS1 maint: url-status (link) - ^ https://www.health.gov.au/news/health-alerts/novel-coronavirus-2019-ncov-health-alert#travellers-and-visitors
- ^ https://www.dhhs.tas.gov.au/news/2020/coronavirus_update_-_26_march_2020
- ^ https://www.theguardian.com/australia-news/live/2020/mar/27/coronavirus-news-australia-update-live-stage-2-3-lockdown-nsw-victoria-qld-scott-morrison-restrictions-cases-death-toll-covid-19-latest-updates
- ^ "Coronavirus patients touch down in Brisbane, another expected tomorrow.", 22 February 2020. Retrieved on 1 April 2020.
- ^ "Queensland coronavirus update", 29 February 2020. Retrieved on 1 April 2020.
- ^ "Queensland coronavirus update", 3 March 2020. Retrieved on 1 April 2020.
Semi-protected edit request on 1 April 2020
This edit request to 2020 coronavirus pandemic in Australia has been answered. Set the |answered= or |ans= parameter to no to reactivate your request. |
I hope that I am taking the right approach to help fill in the gaps. I am only a new user and unfortunately do not yet have the ability to make the edits directly myself at this time for this article.
Additional case numbers and references for New South Wales to be added to the table "Cumulative confirmed cases by State, Territory & Nationally"
Confirmed cases as at 22 February 2020 "4" [1]
Confirmed cases as at 29 February 2020 "5" [2]
Confirmed cases as at 1 March 2020 "6" [3]
Confirmed cases as at 2 March 2020 "9" [4]
Confirmed cases as at 3 March 2020 "15" [5] Realjbrown (talk) 10:51, 1 April 2020 (UTC)
- Done. Clifton9 (talk) 11:08, 1 April 2020 (UTC)
References
- ^ "Novel coronavirus statistics - 2:30pm", 22 February 2020. Retrieved on 1 April 2020.
- ^ "Fifth case of COVID-19 confirmed after man returns from Iran", 1 March 2020. Retrieved on 1 April 2020.
- ^ "Sixth COVID-19 case after woman returns from Iran", 1 March 2020. Retrieved on 1 April 2020.
- ^ "Nine cases of COVID-19 confirmed in NSW", 3 March 2020. Retrieved on 1 April 2020.
- ^ "Fifteenth COVID-19 case confirmed in NSW" 3 March 2020. Retrieved on 1 April 2020.
Semi-protected edit request on 26 March 2020
This edit request to 2020 coronavirus pandemic in Australia has been answered. Set the |answered= or |ans= parameter to no to reactivate your request. |
please update the information with the latest reference on the page for the 26th.
You have provided new data for the 26th however the page information has not been changed to reflect these new data figures. 1.152.106.35 (talk) 03:07, 26 March 2020 (UTC)
 Partly done: should now be up to date. Mdaniels5757 (talk) 00:00, 2 April 2020 (UTC)
Inconsistent Data
I just noticed that if you look at the graph on https://www.health.gov.au/news/health-alerts/novel-coronavirus-2019-ncov-health-alert/coronavirus-covid-19-current-situation-and-case-numbers you will notice that the numbers are quite different from the numbers in the table in the main statistics table, which have been derived from the same source(!!).
One possible reason is that the graph data is delayed a day or two, and the table data may include noise like unconfirmed testing. Still, it confirms one's suspicion as to the competency of our health administrators. Any ideas as to the inconsistency?
We use the graph data for the graph at the head of the article, and the table data for the table in the body, which matches the sources. I added a note about the inconsistency above the table.
At a high level it does not matter. They both tell the same story. A leveling off of cases.Tuntable (talk) 05:44, 2 April 2020 (UTC)
- Would it be possible to increase the accuracy or at least the consistency of this graph by using data from the table under "Number of Cases". The data is sourced and attributed to individual health department media releases which do not change. It also does not rely on another party updating a graph that may later be updated again.
- This would at least increase the consistency of data across the page.
Additional comment - 6 April 2020 - the NSW figure for 6 April is wrong. It should be 2,637, not 2,673.
Graph of Recoveries (in main) looks wrong
People usually recover within 14 days. So as the number of cases grows one would expect the number of recoveries to grow, where that is not being shown.
Where exactly is the data being retrieved from?
And what does "Recovered" actually mean? If it means recovered from Hospital, then the main should be Cases Admitted to Hospital. And what happens to people that leave the country?
The current chart suggests that very few people recover, which is clearly not the case. Unless decent data can be found I think it needs to go. There is very little useful data on Covid-19 for Australia.
I will move it to the bottom until this is clarified. Tuntable (talk) 22:45, 2 April 2020 (UTC)
- Yes there are issues with the data on Recoveries, that has already been discussed in this talk page and hence why the other recovery data has been removed. But that is not justification to push the graph out of the way. Have a look at almost every other nations page and you'll see this graph is in the same location for all of them. Clifton9 (talk) 23:43, 2 April 2020 (UTC)
- If the recovery data is plain wrong, as you noted, then it should be removed completely unless you want to create another section titled "Incorrect data being published". The fact that other pages may chose to publish obviously flawed data does not mean this page should. And there is no citation for where the data came from. It is now completely obvious that the data is wrong, and I have added a dubious tag to it. Tuntable (talk) 05:36, 3 April 2020 (UTC)
- Then remove the data from that graph as has occurred with other graphs. My reference to others nations was in relation to the location of the graph, not the recovery data. You also don't get to personally decide what is the 'single most important data'. You have, as has been pointed out multiple times, created a duplicate graph, with differing information to the rest of the page without addressing those differences, and placed it in the lead section rather than the data section because of your personal choice. You need to discontinue edit-warring and address the inconsistency that you have created. Clifton9 (talk) 09:20, 3 April 2020 (UTC)
- While the recovery data is not credited on the page it is a true figure. The reference should be "Coronavirus update for Victoria - 2 April 2020" which does state 422 recoveries. However, it is still incomplete data, because Victoria is the only state I believe to consistently publish a recovered figure, with some other states indicating they may even stop testing for a recovery. Realjbrown (talk) 09:48, 3 April 2020 (UTC)
- I have moved the graph in the lead to the statistics section following the other graph. It does not belong in the lead. There is an existing statement that clarifies the difference between the two graphs but I think it might need some work. Re the recoveries data, this source has provided the figure of 636, which I have updated. I have removed the dubious tag and replaced it with a note that explains that the data is an underestimate - but the data is not wrong and should still be included, even if it is not updated periodically. Ljgua124 (talk) 22:56, 3 April 2020 (UTC)
- Then remove the data from that graph as has occurred with other graphs. My reference to others nations was in relation to the location of the graph, not the recovery data. You also don't get to personally decide what is the 'single most important data'. You have, as has been pointed out multiple times, created a duplicate graph, with differing information to the rest of the page without addressing those differences, and placed it in the lead section rather than the data section because of your personal choice. You need to discontinue edit-warring and address the inconsistency that you have created. Clifton9 (talk) 09:20, 3 April 2020 (UTC)
- If the recovery data is plain wrong, as you noted, then it should be removed completely unless you want to create another section titled "Incorrect data being published". The fact that other pages may chose to publish obviously flawed data does not mean this page should. And there is no citation for where the data came from. It is now completely obvious that the data is wrong, and I have added a dubious tag to it. Tuntable (talk) 05:36, 3 April 2020 (UTC)
Continue disucssion on talk at Template:2019–20 coronavirus pandemic data/Australia medical cases chart
Citation needed -- Number of Recoveries
Statements in Wikipedia need to be referenced. I do not want to be a reference nazi but in this case they are clearly controversial and many people think they are plain wrong. If so they are very misleading because they suggest Covid-19 is far worse than it is. If each day is a separated reference then a generic reference to the source of one of the days would be sufficient and much better than nothing.
Therefor I have removed the graph from the article. Please do not put it back unless you can find out where the data came from. It is clearly against Wikipedia policy to include unreferenced data for controversial topics. Tuntable (talk) 23:12, 3 April 2020 (UTC)
Semi-protected edit request on 30 March 2020
This edit request to 2020 coronavirus pandemic in Australia has been answered. Set the |answered= or |ans= parameter to no to reactivate your request. |
Hi. This is the first time that I am submitting anything to Wikipedia, hence apologies if I am not doing it right.
I found the following method to be the best way to visualise if the infection rate is slowing down. My suggestion is to add a table and a graph that shows for every day the percentage of increase/decrease from the previous day, i.e.
100*(new cases today - new cases yesterday) / new cases yesterday.
For linear growth that percentage is 0, more than 0 indicates exponential growth and less than 0 indicates slowing in the infection rate. Staying below 0 should eventually stop the spreading of infection.
I tried to insert an example of the chart and graph, but was not able to. ZelkoZahtila (talk) 10:43, 30 March 2020 (UTC)
- True, but that is now negative. Better is just a simple number of new cases. Simple, would show the data, and not be controversial.Tuntable (talk) 01:32, 31 March 2020 (UTC)
I think this is a good idea, but I been trying graph this myself and they didn't turn out well. The media seems to be showing that is it getting worse everywhere in the world (no citation provided), but Italy's total number of infections growth rate has been slowing since they locked down the whole country as with NZ, Australia and many others. So, I believe there needs to be more awareness that the systems governments are putting in place are working and will continue to work if we continue to participate. How to show this I don't know, but it seems new cases can increase while growth in total number of infections decreases (See Italy's stats around the 19-20-21 March). Thanks, Grant. — Preceding unsigned comment added by Grantwalls (talk • contribs) 02:45, 31 March 2020 (UTC)
Hi. Does it work if you simply divide the number of new cases today by the number of new cases yesterday, then minus 1?
For example: sum=(222 / 272)-1
Then you get a simple number you can plot (in this instance, -18.38%) — Preceding unsigned comment added by 2001:8003:244B:8700:5441:4FD6:1426:D32A (talk) 23:21, 3 April 2020 (UTC)
Remove Orange Number of New Cases Graph
The data in this chart is clearly different from the one shown on the Australian government web site, even though both have been derived from data on that website.
I think that the problem is that the data used for the orange graph is based on differencing the daily totals. However, those totals are probably inaccurate when first published. But when they get updated the government does not publish the updated totals, only the most recent ones.
The graph on the government website does not cover the last couple of days, allowing for data to stabilize. And then the last couple of days on the chart vary a bit, and then stabilize. They are not fixed. I suspect (hope!) they vary because new data becomes available. This suggests that the government char is more accurate. It certainly looks more stable.
But in any case, the government chart is from a authoritative source, whereas the orange graph has an element of Original Research, being derived from data. So unless someone has a good reason to keep the Orange graph, I have removed it. I also remove the notes that I added to the article on the subject. Tuntable (talk) 23:23, 3 April 2020 (UTC)
UPDATE The government is not tracking recoveries. Further Professor Allen Cheng, a physician at The Alfred hospital, said 10 days from the point of displaying symptoms was a conservative buffer for most patients to no longer be infectious. I would not object to recoveries being inferred as 10 day old total, provided that method was stated. https://www.smh.com.au/national/you-need-both-stories-who-adviser-calls-for-national-coronavirus-recovery-tally-20200402-p54ght.html
Tuntable (talk) 00:58, 4 April 2020 (UTC)
Continue disucssion on talk at Template:2019–20 coronavirus pandemic data/Australia medical cases chart
Semi-protected edit request on 3 April 2020
This edit request to 2020 coronavirus pandemic in Australia has been answered. Set the |answered= or |ans= parameter to no to reactivate your request. |
Adding citation for "On 17 March, Tasmania declared a public health emergency.[citation needed] "
Citation as provided below
"Public Health Emergency for Tasmania declared". dhhs.tas.gov.au. 17 March 2020. Archived from the original on 19 March 2020. Retrieved 03 April 2020. {{cite web}}: Check date values in: |access-date= (help) Hittingman (talk) 09:52, 3 April 2020 (UTC)
- Done. Thanks. Clifton9 (talk) 12:03, 5 April 2020 (UTC)
Semi-protected edit request on 4 April 2020
This edit request to 2020 coronavirus pandemic in Australia has been answered. Set the |answered= or |ans= parameter to no to reactivate your request. |
Please update the following to insert the age of the Orange woman who died [1]
1 April: the 20th death was a 95-year-old woman who died at the Dorothy Henderson Lodge in Sydney,[197] and the 21st was a 67-year-old woman in Orange, in the Central West of NSW. This was the first NSW death outside of metropolitan Sydney and another that had been a passenger on the Ruby Princess cruise ship. Scooter60 (talk) 00:08, 5 April 2020 (UTC)
- Done. Clifton9 (talk) 12:08, 5 April 2020 (UTC)
References
- ^ "COVID-19: Woman, 67, confirmed as first coronavirus death at Orange" Daily Liberal from the original on 2 April 2020. Retrieved 5 April 2020. https://www.dailyliberal.com.au/story/6708138/woman-in-60s-confirmed-as-first-coronavirus-death-at-orange/)
Chart of new Cases
I put back (and updated) the chart of new cases. This is the most important aspect of the entire story -- is it getting better or worse, and later, how did it change over time. That is why it is in the lead. Cumulative graphs do not make that clear at all.
I might add that this is the first chart on the official Australian Government website so they also think that it is important. https://www.health.gov.au/news/health-alerts/novel-coronavirus-2019-ncov-health-alert/coronavirus-covid-19-current-situation-and-case-numbers
As to the data being inaccurate, it is read from the reference cited on the chart. If someone has better data then by all means update it but with citations. I do not think that a few percent errors actually matters much though, it is the big picture that is important. Note that the data over the last few days changes as more test results come in. Tuntable (talk) 23:09, 1 April 2020 (UTC)
- I do not understand why the same information is source from multiple different locations. Each state health department releases the number of new cases and their total each day which is being used for the table "Cumulative confirmed cases by State, Territory & Nationally". If that data is accurate enough to create the table, is it not accurate enough to populate this graph? Realjbrown (talk) 11:05, 4 April 2020 (UTC)
- The table shows the state of play as recorded at the end of the day. But extra figures come in over the following days. So if you could see the data over time, then you would see the numbers change for the last few days. The graph on the Aust Govt website actually changes the last couple of days each day. You will note that it also looks a lot more stable, which is what you would expect.
- That is my theory anyway. But we can simply say that data compiled by they government is more authoritative than data compiled by us. The numbers are different, so we should use the authoriative ones.Tuntable (talk) 00:42, 6 April 2020 (UTC)
Where is the source for the blue graph data?
The new blue graph on the page doesn't seem to match the AU government page graph here: https://www.health.gov.au/news/health-alerts/novel-coronavirus-2019-ncov-health-alert/coronavirus-covid-19-current-situation-and-case-numbers or the data figures released from each state government as listed in the table in the article. The old orange one was getting updated daily from the total of the state government released daily figures but the new blue graph hasn't been updated since April 2. Where are you getting the data from?
— Preceding unsigned comment added by HelperAnt (talk • contribs) 07:06, 4 April 2020 (UTC)
- The data came directly from that graph. By reading back the numbers. They could be off by a few percent, you are welcome to make them more accurate.
- Note that the numbers on the graph are different from those in the table, and are delayed a couple of days so that the data stabilizes Tuntable (talk) 00:51, 6 April 2020 (UTC)
Semi-protected edit request on 30 March 2020
This edit request to 2020 coronavirus pandemic in Australia has been answered. Set the |answered= or |ans= parameter to no to reactivate your request. |
Section: https://en.wikipedia.org/wiki/2020_coronavirus_pandemic_in_Australia#Federal_Government
At end of paragraph beginning "On 13 March, at a meeting of the Council of Australian Governments..."
Add: Prime Minister Morrison also announced he intended to attend a Rugby League match on Saturday the 14th of March; "I do still plan to go to the football on Saturday"
Sources: https://www.theguardian.com/australia-news/video/2020/mar/13/scott-morrison-defends-decision-to-attend-rugby-league-game-during-coronavirus-outbreak-video https://www.abc.net.au/news/2020-03-13/coronavirus-scott-morrison-coag-premiers-cancelling-events/12053382 101.165.104.244 (talk) 02:00, 30 March 2020 (UTC)
Ventilators, currently hospitalized, ICU
Do you think it should be included on the page or do you know if the government releases information such as ventilators and health status of cases such as is recorded in the Israel page?
https://en.wikipedia.org/wiki/2020_coronavirus_pandemic_in_Israel#Statistics — Preceding unsigned comment added by HelperAnt (talk • contribs) 02:24, 2 April 2020 (UTC)
- If you could find stats on number of people are sick enough to be in hospital that would be wonderful. But there is very little publicly available data. Lots of talk, logs of opinions, very little data. Try telephoning departments, NSW seems most forthcoming.Tuntable (talk) 04:58, 2 April 2020 (UTC)
- The data is available, just not on an up to date daily basis. The Australia wide numbers for Hospitalisations, ICU addmissions and ventilators used are included in reports found here "Coronavirus disease (COVID-19) weekly epidemiology reports" an example from the Report 9 for week ending 29 March 2020 is below.
- "Hospitalisation status was recorded for 2,129 cases, of which 19% were reported to have been hospitalised due to their COVID-19 infection. Of these hospitalised cases, ICU (Intensive Care Unit) status was recorded for 176 cases, of which 22% (n = 38) were admitted to an ICU, with five cases requiring ventilation; and" Realjbrown (talk) 10:24, 3 April 2020 (UTC)
- From today, the D. of Health website is posting an infographic with data, including number of people in ICU and hospitalised. We could start reporting those numbers here. Jpdehollain (talk) 01:33, 6 April 2020 (UTC)
Timeline of deaths per day graph vs new cases per day graph.
Not sure if it's better to have the deaths per day graph start at the first of March with the first death as it is in the article or as it is below starting at the date of the first case to make it more comparable by time to the new cases by day graph.
For example, on China's page these two graphs are very comparable by time. https://en.wikipedia.org/wiki/2019%E2%80%9320_coronavirus_pandemic_in_mainland_China#Statistics
- HelperAnt
| Graphs are unavailable due to technical issues. There is more info on Phabricator and on MediaWiki.org. |
- This graph will soon become unmanageable when displaying daily. It may have to be changed to weekly and eventually, monthly. In the interim, the days leading up to the first death may need to be removed. Clifton9 (talk) 12:24, 25 March 2020 (UTC)

Graphs are unavailable due to technical issues. There is more info on Phabricator and on MediaWiki.org. - I propose condensing the period from 25 Jan to 29 Feb, as per above. Ejay (talk) 04:56, 1 April 2020 (UTC)
- Yes that's how I did the death graph originally then changed it to have the time span the same as the new cases per day so they are comparable but I am leaving it to others to change however is wanted. The bigger problem seems to be two graphs are on the page with different numbers but both say they are 'new cases per day.' HelperAnt (talk)HelperAnt
- Yes Ejay I think it needs to be condensed and I agree with HelperAnt that it is problematic that there is now two graphs for the same purpose but with different data. Clifton9 (talk) 12:10, 1 April 2020 (UTC)
- Yes that's how I did the death graph originally then changed it to have the time span the same as the new cases per day so they are comparable but I am leaving it to others to change however is wanted. The bigger problem seems to be two graphs are on the page with different numbers but both say they are 'new cases per day.' HelperAnt (talk)HelperAnt
Is anyone able to remove the large amount of white space on the left of the main per day stats chart? That would make it easier to read.Serendipity33 (talk) 05:19, 4 April 2020 (UTC)
- The white space is created by Tuntable constantly putting their 'new cases' graph in the timeline. It doesn't matter how many times it gets moved back down to the statistics section, Tuntable insists on putting it wherever Tuntable thinks it should go. As you have observed, apart from being in the wrong section, it causes display issues. I can try and re-locate it again, but can almost guarantee that Tuntable will move it again because they seem to think that they know best. Tuntable will make more comments like, take it to the talk page, despite it constantly being taken to the talk page, where Tuntable will ignore the conversations, in the same way that Tuntable will delete the new cases graph that actually matches the data. Clifton9 (talk) 10:27, 6 April 2020 (UTC)
Semi-protected edit request on 6 April 2020
This edit request to 2020 coronavirus pandemic in Australia has been answered. Set the |answered= or |ans= parameter to no to reactivate your request. |
The % change of total cases in Australia on 5 April should be 2.5% not 2.4%. Titanic Rail (talk) 11:18, 6 April 2020 (UTC)
- Done. Thanks. Clifton9 (talk) 12:39, 6 April 2020 (UTC)
Treatments/Vaccine
Do you think the article should include about vaccine development and promising treatments studies/used in Australia? — Preceding unsigned comment added by 112.213.221.145 (talk) 11:02, 5 April 2020 (UTC)
- Sounds reasonable if you want to supply some text and references to add to the page. Clifton9 (talk) 12:48, 6 April 2020 (UTC)
Semi-protected edit request on 31 March 2020
This edit request to 2020 coronavirus pandemic in Australia has been answered. Set the |answered= or |ans= parameter to no to reactivate your request. |
Can a simple moving average trend line be added to the “new cases” by date be added please? Paul Arthur Stevenson (talk) 11:30, 31 March 2020 (UTC)
- Not done for now: Sounds reasonable but not sure how to implement it, nor if there is consensus. Will leave for other users to consider. Clifton9 (talk) 12:54, 6 April 2020 (UTC)
Semi-protected edit request on 1 April 2020
This edit request to 2020 coronavirus pandemic in Australia has been answered. Set the |answered= or |ans= parameter to no to reactivate your request. |
Please add tested number of people (daily) to the main table Varol.cavdar (talk) 11:37, 1 April 2020 (UTC)
- Not done for now:. Not sure if the historical data is available to implement this. Clifton9 (talk) 12:56, 6 April 2020 (UTC)
Semi-protected edit request on 1 April 2020
This edit request to 2020 coronavirus pandemic in Australia has been answered. Set the |answered= or |ans= parameter to no to reactivate your request. |
Under the Statistics section additional note for NSW regarding infections from passengers onboard Ovation of the Seas.
Suggest adding "79 infected on the Ovation of the Seas"
[1] Realjbrown (talk) 05:10, 1 April 2020 (UTC)
References
- ^ Trask, Steven. "Humanitarian call to repatriate Ruby crew", The Port News, 31 March 2020. Retrieved on 1 April 2020
- Already done Mdaniels5757 (talk) 22:14, 6 April 2020 (UTC)
Australian Govt Data -- work in progress
They also might have stopped updating the page, maybe they do not like the new numbers!
Note that these numbers are different from the article and different from, say, https://www.theguardian.com/australia-news/datablog/ng-interactive/2020/mar/30/coronavirus-cases-in-australia-map-confirmed-numbers-stats-how-many-cases-of-covid-19-nsw-maps-victoria-live-data-qld-sa-wa-tas-nt-latest-statistics-update
Madness! Tuntable (talk) 05:26, 31 March 2020 (UTC)
I have moved (and corrected) this graph to the beginning Tuntable (talk) 06:29, 1 April 2020 (UTC)
- So Tuntable are you doing something with the other graph because there are now 2 graphs that are titled "new cases" but they have different numbers in them? Also, are you updating the tables with the cumulative data so they match the data in your new graph as they differ? Clifton9 (talk) 09:19, 1 April 2020 (UTC)
- Yes, I removed the Orange graph. Tuntable (talk) 23:32, 6 April 2020 (UTC)
Semi-protected edit request on 26 March 2020
This edit request to 2020 coronavirus pandemic in Australia has been answered. Set the |answered= or |ans= parameter to no to reactivate your request. |
Still looking at the graph which has changed from a linear to logarithmic scale. I do see the merit of both.
I also have had a quick read of https://en.wikipedia.org/wiki/Semi-log_plot & noticed https://en.wikipedia.org/wiki/File:Influenza-2009-cases-logarithmic.png
Replicated the chart in Excel & got this with a Base2 Y-Axis.... but can't upload that image without setting up an account, but have saved the image here.... http://weather.inverellit.com/images/casesbase2.jpg
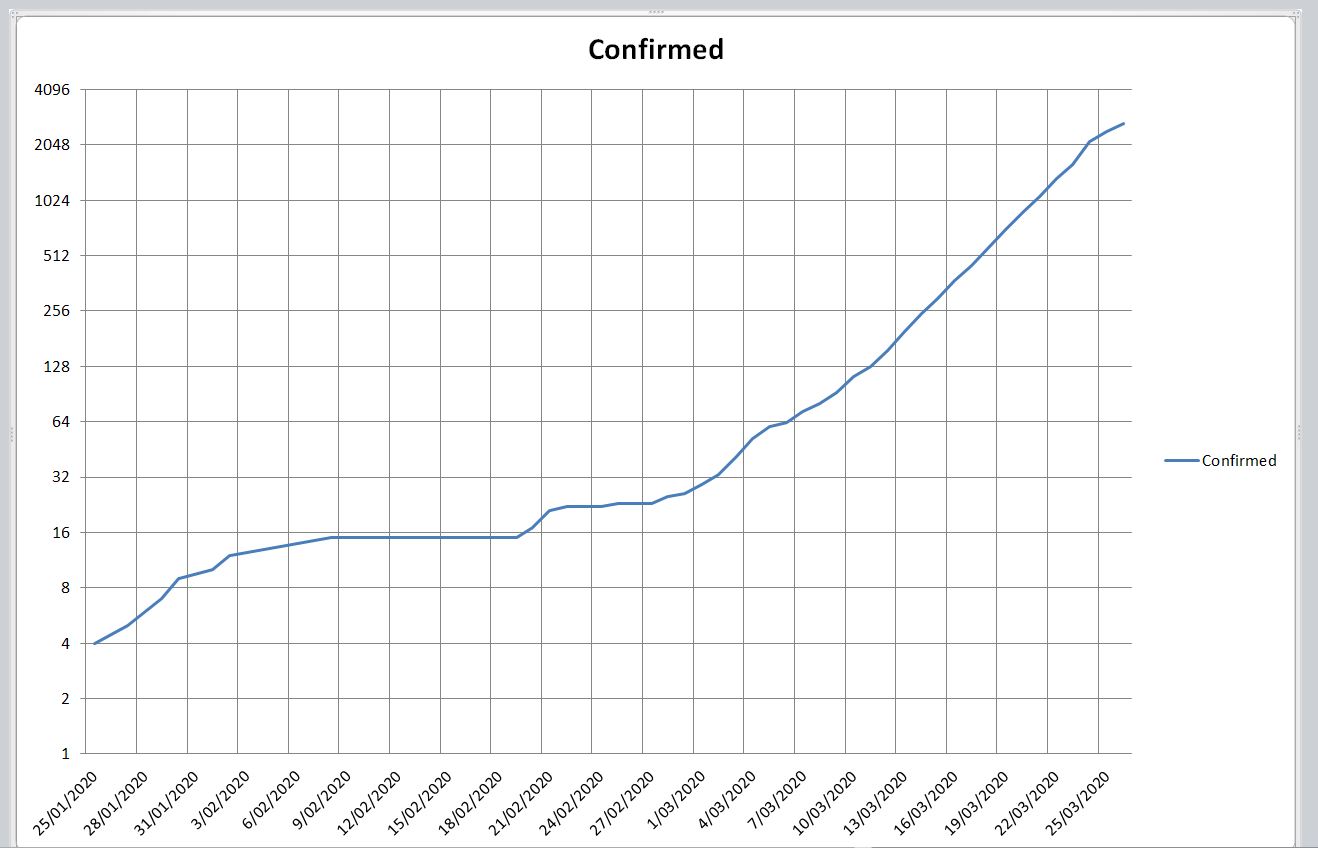
Just food for thought. Not sure what is most appropriate.
Cheers. 203.129.24.45 (talk) 03:00, 26 March 2020 (UTC)
Here are some graphs the other way if others want to include both. HelperAnt (talk)HelperAnt
| Graphs are unavailable due to technical issues. There is more info on Phabricator and on MediaWiki.org. |
Also if others want to include boths ways for the states:
| Graphs are unavailable due to technical issues. There is more info on Phabricator and on MediaWiki.org. |
 Note: This is an unanswered request that I've unarchived. –Deacon Vorbis (carbon • videos) 17:16, 5 April 2020 (UTC)
- Not done for now: please establish a consensus for this alteration before using the
{{edit semi-protected}}template. @Deacon Vorbis: I have no issues with graphs, charts, etc. However the article already has a variety of graphs including some semi-log plot graphs some of which look similar to what has been proposed here that are more up to date. I'm closing this for now and the IP or HelperAnt can continue the discussion if the graphs in the article are not what they desired/intended. HelperAnt doesn't need to reactivate the edit request as they have the adequate permissions to edit the article however if the IP feels the request wasn't answered properly they can changedanswered=yesback toanswered=no. Alucard 16❯❯❯ chat? 07:07, 7 April 2020 (UTC)
Background section
For a debate about the new introduction of the Background section, please see Wikipedia_talk:WikiProject_COVID-19#Mass_duplicates_for_"Background".--walkeetalkee 17:24, 7 April 2020 (UTC)
New cases graph -- the plot thickens
There have been two charts, the blue one at the top based on government data and the orange one at the bottom based on the official chart. The former seemed more accurate as the daily totals get updated over a couple of days.
However, on 7 April the official chart changed radically and now reflects the differencing approach. I will wait a day or two to see what happens. But maybe the charts should be swapped.
The government obviously treats data given to the public with contempt! Tuntable (talk) 00:24, 7 April 2020 (UTC)
OK, the original graph is dead. The government changed the method. But I put the new graph in a template for easy editing. Tuntable (talk) 22:54, 7 April 2020 (UTC)
Semi-protected edit request on 8 April 2020
This edit request to 2020 coronavirus pandemic in Australia has been answered. Set the |answered= or |ans= parameter to no to reactivate your request. |
Delete 'Semi-log' from the title of the second-to last graph.
The second-to-last graph is titled 'Semi-log plot of SARS-CoV-2 cases and COVID-19 deaths in Australia'. The chart is _not_ a semi-log plot and should be titled 'Plot of SARS-CoV-2 cases and COVID-19 deaths in Australia'. The y-axis is linear (option yScaleType=linear rather than yScaleType=log for the semi-log plots).
Thanks. 110.174.30.127 (talk) 02:31, 8 April 2020 (UTC)
- Done. Thanks. Clifton9 (talk) 03:27, 8 April 2020 (UTC)
Misdirection of events
Under BACKGROUND: On 12 January, the World Health Organization (WHO) confirmed that a novel coronavirus was the cause of a respiratory illness in a cluster of people in Wuhan City, Hubei Province, China, who had initially come to the attention of the WHO on 31 December 2019.
The above sentence, specifically the phrase "who had initially come to the attention of the WHO" gives the impression that it was the WHO that first noticed this respiratory illness. The reality is that it was the Chinese national authorities that reported the virus to the WHO office in China. Please see situation report 1 issued by the WHO on 21 Jan 2020.
On 31 Dec 2019, the WHO China Country Office was informed of cases... — Preceding unsigned comment added by 2001:8003:74F5:A800:1DD6:CB19:C673:EC41 (talk) 11:46, 7 April 2020 (UTC)
- From other discussions I believe this section has been added to most if not all related pages for the coronavirus pandemic in a bulk fashion. However, looking at some of the other countries a small but significant difference in wording has been used. The part of the sentence your concern raises is often written as "which was reported to the WHO on 31 December 2019." in some other country pages. I have made the adjustment in wording. Realjbrown (talk) 09:11, 10 April 2020 (UTC)
Semi-protected edit request on 10 April 2020
This edit request to 2020 coronavirus pandemic in Australia has been answered. Set the |answered= or |ans= parameter to no to reactivate your request. |
Please correct the number of confirmed cases in the NT on 2 April and 3 April and associated figures. Thanks.
Number of confirmed cases as at 2 April 2020: 22 [1]
Number of confirmed cases as at 3 April 2020: 26 [2]
References
- ^ "22nd COVID-19 case in NT". coronavirus.nt.gov.au. 2020-04-02. Retrieved 2020-04-09.
- ^ "New COVID-19 cases in Darwin". coronavirus.nt.gov.au. 2020-04-03. Retrieved 2020-04-09.
124.188.43.87 (talk) 05:08, 10 April 2020 (UTC)
- Done. Thanks. Onmaditque (talk) 17:44, 10 April 2020 (UTC)
Semi-protected edit request on 12 April 2020
This edit request to 2020 coronavirus pandemic in Australia has been answered. Set the |answered= or |ans= parameter to no to reactivate your request. |
12 April total cases NSW is incorrect. Supposed to be 2864. When adding the cases someone forgot to change the ‘5’ to a ‘6’. As it stands it’s actually showing a reduction in accumulated cases I.e. accumulated cases lower today than yesterday. Please amend 114.77.138.222 (talk) 11:37, 12 April 2020 (UTC)
- It is written in the notes explaining this The number of cases from 11 April in NSW was revised down to 2,847. Nine patients tested in NSW have been identified as residents of ACT and Queensland and living in their home jurisdiction, while another previously reported case was a false positive. 7 new cases were identified on the 12th of April. Keroks (talk) 12:04, 12 April 2020 (UTC)
Significant Errors in Death data
Initially earlier today I detected two incorrect totals for deaths in QLD and VIC in the line "Deaths by State/Territory" on the table "Cumulative confirmed cases by State, Territory & Nationally". At the time QLD was showing 4 deaths and VIC was showing 14. However, based on the latest media releases at the time QLD had 5 deaths a figure that QLD Health had been publishing since the 5th of April. While Victoria was showing 13 deaths in their most recent media release for the 10th of April. I rectified the totals. However, checking the page this evening and the total for QLD has been changed back to 4 which is incorrect. While the total for Victoria has been changed back to 14, but this does reflect the change with the newest data for the 11th of April.
Which led me to look closer and reconfirm all numbers and each of the death totals does match the state based media releases except for QLD which is one short. But the totals currently listed does total to 56, when there is in fact 57 deaths based on the state based media releases. I do not at this stage know if that is truly an accurate figure or if maybe two states are including the same death in their figures. It will require more detailed checking.
Another piece to this is that in the daily government infographic there are 56 deaths mentioned. Which does show 5 in QLD, but only 22 in NSW. Where NSW media release today indicates 23 deaths. Which could explain that there may be 57 deaths in total.
Looking deeper into the the individual death register, where each death is listed by date there are multiple inconsistency created by referencing news articles instead of government data. In ordinary course I can understand referencing a news article where the information being reported is known to be complete. However, in the course of a changing situation it creates some issues. Partially due to excessive references. For example the following excerpt from the 5th.
"5 April: six men died in NSW (aged 91, 86, 85, 80, 76, and 61), three of whom had been passengers on the Ruby Princess,[231][232]and one man in Queensland (aged 78) who had also been a passenger on the Ruby Princess.[233]"
In fact on 5 April only four people died in NSW and one in QLD. The additional two attributed to NSW actually died the day before, but were mentioned in the referenced news article and seem to have just been added in to the count. The following two days also contain similar inconsistencies.
The entire section needs to be rewritten using consistent data sources, such as government media releases, as in some cases the news articles are not consistent or accurate. I am just slightly hesitant to start working on this as it is going to be significant work and even a small correction I made today was reverted, with no cause except that it did not fit the calculation. Realjbrown (talk) 10:03, 11 April 2020 (UTC)
- @Realjbrown: I agree, this is what I was referring to a couple of days ago. There needs to be a routine and consistent data sourcing standard, and should only be directly from a government source. The table should never be updated based on ad hoc news reporting. It is why I proposed the federal government's daily release, as it reports all the states and territories at the same time each day. If you are doing it with different news reporting or even the various state level government reporting, you are always going to run into tally errors due to the inconsistent timing of releases that people will feel compelled to correct etc. and we will forever be going in circles. Maranello10 (talk) 00:13, 12 April 2020 (UTC)
- @Maranello10: I agree with this, we need to have consistency reporting and should be going off from the Australian Government's infographic. State Government's numbers are inconsistent and don't line up with the Federal Government's. I have rectified this by changing the numbers from 5th April to now to reflect the Government's infographic. Keroks (talk) 12:07, 12 April 2020 (UTC)
- The Infographic numbers are also dubious. Note the way that the recovery times seem to be increasing, suggesting that they are missing figures. The amount of publicly available data is appalling, and much of it is tweaked for propaganda purposes rather than to be transparent. There is no one good source. I think the critical thing is that all numbers are well referenced, and inconsistencies noted.Tuntable (talk) 23:24, 12 April 2020 (UTC)
Statistics?
For number of cases under the statistics section, it's not even the 13th (it's only 9PM AEST here), yet there are already numbers for the 13th? In the Tasmania column, there's an extra 11 cases for the 13th but it's still the 12th, so where are the 11 coming from?
Edit: Okay I see where the extra 11 are coming from, but why are they in the 13th instead of being added on to the 12th? Alpha Centauri 5932 (talk) 11:05, 12 April 2020 (UTC)
- @Alpha Centauri 5932: It seems that we should be referring to the standardised Australian Government's official infographic as stated in the Wikipedia page: The numbers of cases in the tables below referred to the number of cases at the end of each day (23:59 AEDT) until April 4 2020. Since April 5 2020, the federal government standardised the daily case number release time to 15:00 AEST which is reflected in the data.. Since this infographic is produced at 3PM AEST everyday, Tasmania usually reports their numbers after that time, making it 'official' on the infographic the next day. I'm not sure if this is the correct way to be reporting it, but it should be best to have consistency with the Government? Keroks (talk) 12:02, 12 April 2020 (UTC)
- I disagree with using this source. We have been reporting the figures by midnight (and it doesn't matter the Australian timezone), and now we switch to 15:00. Earlier the Australian govt, figures used different cut off times, and were published many hours later, so we end up with very out of date figures by the time they appear. Graeme Bartlett (talk) 23:30, 13 April 2020 (UTC)
- @Graeme Bartlett: The figures are not out of date, the figures are exactly what they are, the situation at a particular moment in time. To say the figures are out of date is like saying the number of cases reported a week ago should be discarded because they are now out of date. We are not trying to provide a running total which would require an update every ten minutes and encounter constant sourcing inconsistencies. Whatever is recorded needs to be something released at the same time every day to create a historical record, it doesn't matter if it is at 15:00 AEST or anything else. It just happens that the best and only consistent source for the entire nation is a snapshot of the case numbers as of 15:00 each day. The figures were previously getting reported at midnight and at various other times was because we lacked a consistent source, which we have now. Maranello10 (talk) 02:39, 14 April 2020 (UTC)
- I disagree with using this source. We have been reporting the figures by midnight (and it doesn't matter the Australian timezone), and now we switch to 15:00. Earlier the Australian govt, figures used different cut off times, and were published many hours later, so we end up with very out of date figures by the time they appear. Graeme Bartlett (talk) 23:30, 13 April 2020 (UTC)
One consistent source is needed for consistency between "COVID-19 Cases Chart" and "Number of Cases" table
Since April 5, the federal government has been releasing a daily update at 3pm AEST with forms the basis of the flagship "COVID-19 Chart" that appears near the start of every country's COVID-19 page. I understand it is probably down to legacy habits that predate April 5, but is there any reason anymore to update the "Number of Cases" table with state-level data after 3pm until 11:59pm? As in, why create an inconsistency within the page? We are no longer at the very start of the crisis, so I don't see the need at this moment to have a running total throughout the day of state level data that isn't referenced and not updated in a predictable and routine manner.
I don't want to start an edit war so if we can discuss a consistent standard moving forward that would be great. I believe the federal government's 3pm update that can be found here [12] is the obvious candidate, particularly given both the table and chart use it as its cited reference. Please ping anyone else who may be interested. Maranello10 (talk) 01:57, 10 April 2020 (UTC)
- I believe there is reasonable cause to maintain the state level data in the "Number of Cases" table. Each states column is referenced to the individual health department where they release the updates so the data is referenced, just not every individual number on every day. By changing it there is potential for inconsistent data pre and post 5 April.
- @Realjbrown: I have no problem using the state data prior to 5 April but if this thing goes on for months the pre 5 April data will be far outweighed by the post April 5 releases, a simple caveat just like there is with the COVID-19 Cases Chart can be written explaining that the infographic was used from 5 April onwards. I don't see why we need to have 8 sources when we can just have one. And people keep updating the figures based on media releases rather than what is reported by the health authorities. However, I have made peace with the fact that it is an outlet for people to feel useful during the day, so they are probably going to update the data when they hear about a new death or something whether there is a universal reporting standard or not, unless the page receives more protection. Otherwise, a decision can be made later on or after the pandemic of how to report the historical record. If you want to use state level data, however, it should be referenced as such, as the intro to the section currently points to the federal infographic. Maranello10 (talk) 23:48, 11 April 2020 (UTC)
- Which leads to today, as at 6.30pm the federal government has not updated their infographic. If that does not get updated today, because it was not delegated to anyone to complete on the public holiday it compromises the data set. Do you then just leave a gap in the data and bump up the figures the next day the infographic is updated? On the other hand 6 out of 8 states have released updates. Realjbrown (talk) 08:39, 10 April 2020 (UTC)
- @Realjbrown: The 3pm update was late on the 10th April, but it got released eventually. It is a public health crisis, they are not going to miss a day because of a public holiday. Australia was actually very late introducing a uniform national reporting time compared to other countries, but other nations have been keeping a consistent reporting schedule throughout so I don't think there will be a missed day here. Maranello10 (talk) 23:48, 11 April 2020 (UTC)
- @Maranello10: Switching from the data reported by states and territories at 11:59 pm AEST each day to the data reported by the Australian Government Department of Health at 3:00 pm AEST each day will create inconsistencies and can be misleading for the following reasons:
- Not all states and territories report their daily tally before 3 pm AEST. In fact, Tasmania doesn't report its daily tally until late at night and sometimes the Northern Territory updates its daily tally at night. This is why the Tasmanian tally reported by the Australian Government Department of Health at 3:00 pm each day is close to the tally reported by the Tasmanian Government Department of Health the previous day. Therefore mixing the figures reported each day and the figures reported the previous day in a single column creates an inconsistency for the Tasmanian tally. What's more, for the same reason, using the increase from 11:59 pm AEST 4 April to 3:00 pm AEST 5 April to represent the daily increase of cases for 5 April creates an erroneous number of daily new cases for 5 April.
- There are sometimes discrepancies between the tally reported by the department of health for a jurisdiction and the tally reported by the Australian Government Department of Health for that jurisdiction for reasons that cannot be explained.
For example, as it can be seen from the following chart, from 5 April to 10 April, the Tasmanian tally reported by the Australian Government Department of Health at 3:00 pm each day was 1 less than the tally reported by the Tasmanian Government Department of Health the previous day, on 10 April the Tasmanian tally reported by the Australian Government Department of Health at 3:00 pm was the same as the tally reported by the Tasmanian Government Department of Health the previous day, on 11 April was one more and from 12 April the same again. There are discrepancies between the Tasmanian tally reported by the Australian Government Department of Health at 3:00 pm each day and the Tasmanian tally reported by the Tasmanian Government Department of Health the previous day for reasons that cannot be explained. Therefore the Tasmanian tally reported by the Australian Government Department of Health at 3:00 pm each day is of low quality and should not be used.
| Date | Tasmanian tally reported by Tasmanian Government Department of Health each night [1] | Tasmanian tally reported by Australian Government Department of Health at 3:00 pm each day [2] |
|---|---|---|
| 4 April | 82 | N/A |
| 5 April | 86 | 81 |
| 6 April | 89 | 85 |
| 7 April | 98 | 88 |
| 8 April | 107 | 97 |
| 9 April | 111 | 106 |
| 10 April | 122 | 111 |
| 11 April | 133 | 123 |
| 12 April | 144 | 133 |
| 13 April | 150 | 144 |
For the sake of consistency, we should use the data reported by the Australian Government Department of Health at 3:00 pm each day for the whole table or the data reported by state and territory governments at 11:59 pm AEST each day for the whole table. Since the Australian Government Department of Health at 3:00 pm each day didn't always update the daily number of new cases at 3:00 pm each day until 5 April, we can only take the second approach to use the data provided by state and territory governments at 11:59 pm AEST each day. Onmaditque (talk) 03:24, 14 April 2020 (UTC)
- @Onmaditque: The argument you are making is actually proving my point as to why you need to go off the one data source (the federal government). Yes, I acknowledge that the state and territories report the data at different times, it is the exact reason why it is not appropriate to use eight different reporting sources to complete one table. But apart from being inconsistent with one another from a timing perspective, many of the discrepancies you are describing are likely corrections (false positives, incorrect state attribution) that are attributed before the reporting cutoff in one jurisdiction but added later on in another. Why would you even begin to try and second guess all these eventualities in real time (eg: a Ruby Princess type scenario where a passenger has been deducted from NSW, but not added to Tasmania yet)? Your concerns about the Tasmanian figures that they are attributed to the next 15:00 count, it doesn't really matter if a count occurs at 8:00, 15:00 or 23:59, all that matters is consistency.
- As for your worry about the continuity on April 5; this pandemic is likely to go for at months at the very least. It is not an argument to stick to the weaker, less consistent data sourcing method to avoid one day of broken continuity, a break which is already well referenced in the table, when you have a better data source available for what would almost surely be the vast majority of reporting days in this crisis. Maranello10 (talk) 06:52, 14 April 2020 (UTC)
@Onmaditque: Just back to the original point of this thread, why are we even contemplating having a difference in totals between the national figures at the start of the page (where there is no argument that it needs to take the daily national figures reported by the federal government as it is the national figure) and another table later on the same page, when we don't have to? By your method, the reader needlessly sees two different totals for each day on the same page. Maranello10 (talk) 07:08, 14 April 2020 (UTC)
- @Maranello10: I still don't understand why you insist on creating major inconsistencies by mixing figures reported at 3:00 pm AEST and 11:59 pm AEST each day in the state-by-state breakdown table and the "COVID-19 cases in Australia" chart in the "Timeline" section, which are much bigger inconsistencies than the inconsistency between the national total at the Infobox and the national total at the state-by-state breakdown table, and create unnecessary errors for the national and Tasmanian/NT increases of cases on April 5. As for the inconsistency between the national total at the Infobox and the state-by-state breakdown table, we can fix this so that the national total used in the Infobox is also based on the sum of data reported by state and territory governments at 11:59 pm AEST each day. If we all agree to use the data provided by state and territory governments throughout the article, we can have consistent sources for all tables, charts and graphs and there will be no break of continuity or erroneous figures of daily increases caused by the break of continuity. To prevent readers seeing different national totals for each day, we can refrain from giving the national total for a day in the state-by-state breakdown table until the end of the day. Onmaditque (talk) 11:43, 14 April 2020 (UTC)
- @Onmaditque: Why would we ever create our own national figure by adding up eight inconsistent state/territory data points with all the associated problems, when the federal government literally releases the official national figure each day? Your method creates the inconsistencies; without repeating myself too much, as previously explained we have one federal government source that has all the information, is consistent and needs updating only once a day. It's not hard. Maranello10 (talk) 17:15, 14 April 2020 (UTC)
Noosa Sails related cases- what is the real number?
The above news article states, 'At least 24 people at the party were infected that night, including four staff.' but the wiki article states only 17 cases. What is the correct number?
- You are right, however, I am willing to go with the ABC News article rather than the Triple J reporting, since they both come from the same organisation but one is from their actual news room. If you find other sources that state 24 rather than 17 though you should post them here. Maranello10 (talk) 01:52, 15 April 2020 (UTC)
I have found these below also that say 24, I am not certain but perhaps more were diagnosed since the first article was written by ABC, unless there has been an error in one of the articles, not sure how to verify for certain the correct number.
- I checked the articles you provided and had a search myself, all the articles that came out on either March 24 or March 25 cite either 24 or 28 cases, whereas the article that is referenced on the page was updated on March 26, and says 17. I suspect that the initial reporting was incorrect and only the ABC made a correction once more information came to light. Maranello10 (talk) 08:50, 15 April 2020 (UTC)
Sorry
The Tasmanian death on April 17 was a man in his 70s Source: https://www.sbs.com.au/news/australia-s-coronavirus-death-toll-rises-again-after-new-fatalities-in-wa-tasmania
Sorry I tried to update but it all went stupid. RickWall99 (talk) 11:15, 17 April 2020 (UTC)
- Done @RickWall99: No worries, it's all fixed. I added your source too.
Semi-protected edit request on 17 April 2020
This edit request to 2020 coronavirus pandemic in Australia has been answered. Set the |answered= or |ans= parameter to no to reactivate your request. |
Please change write style format from:
- Australia subsequently imposed travel bans on Iran (March 1)
to
- Australia subsequently imposed travel bans on Iran (1 March) 36.77.64.50 (talk) 22:31, 17 April 2020 (UTC)
Tests per day for the country or per state.
I think including tests per day as well as new cases per day would be good if this information is publicly available then people can see if any drop in new cases might be due to a drop in testing or not.
- Can you suggest a template and/or data source? Maranello10 (talk) 07:56, 17 April 2020 (UTC)
- @Maranello10: The infographic has the number of tests done per state, so we could potentially use that as a data source. Keroks (talk) 00:57, 18 April 2020 (UTC)
- @Keroks: It does, yes I think that would be good. We can use one of ABC's charts as a template [13]. Since you do a lot of the updating do you have a suggestion? Maranello10 (talk) 07:14, 18 April 2020 (UTC)
- @Maranello10: The infographic has the number of tests done per state, so we could potentially use that as a data source. Keroks (talk) 00:57, 18 April 2020 (UTC)
Spelling
Apologies if this is the wrong place, never used a Talk page before. Can someone who can edit correct 'Preventive' to 'Preventative'. Very annoying but can't fix due to semiprotection. Cheers 101.164.200.104 (talk) 04:52, 17 April 2020 (UTC)
- I wasn't sure if "preventive" was wrong or not, so I did some Googling. This tells me they are both correct and that both mean the same thing. It's an American source. Couldn't find an Australian one. But do you have evidence to the contrary? HiLo48 (talk) 05:38, 17 April 2020 (UTC)
- Done The sources I found suggest both spellings are correct in Australian English. Admittedly, I have seen "preventative" used more lately in the Australian context, so I switched it over. Maranello10 (talk) 07:54, 17 April 2020 (UTC)
- Agree - "preventative" is much better! Preventive is an Americanism. Laterthanyouthink (talk) 09:01, 18 April 2020 (UTC)
Semi-protected edit request on 13 April 2020
This edit request to 2020 coronavirus pandemic in Australia has been answered. Set the |answered= or |ans= parameter to no to reactivate your request. |
| NSW[5][a] | QLD[7] | VIC[8] | SA[9] | WA[10] | TAS[11] | ACT[12] | NT[13][b] | Total[c] | Active | New cases |
% growth |
Deaths Nationally[16] | |
|---|---|---|---|---|---|---|---|---|---|---|---|---|---|
| 12 April[17] | 2,854[d] | 983 | 1,268 | 429 | 517 | 133 | 102[e] | 27 | 6,313 | 2916 | 21 | 0.72% | 59 |
| 13 April[20] | 2,863 | 987 | 1,281 | 431 | 523 | 144 | 103 | 27 | 6,359 | 2804 | 46 | 1.6% | 61 |
| NSW | QLD | VIC | SA | WA | TAS | ACT | NT | Total | Active | New cases |
% growth |
Deaths Nationally | |
| Deaths by State/Territory |
25 | 5 | 14 | 4 | 6 | 5 | 2 | 0 | 61 |
It's statistically meaningless to calculate percentage of daily new cases out of total historical ones. Instead efficiency of isolation and social distancing measures meant to be shown by that percentage could be described with percentage of the new cases in all currently active.
I'm suggesting to fix growth formula that by using active cases instead of total cases in "Cumulative confirmed cases by State, Territory & Nationally" table. Growth in percents is only meaningful when calculated from the number of ongoing cases. (Active) = (total - recovered - deaths), 100% * (new cases) / (Active). Above I provided example for two last days. 58.84.119.54 (talk) 17:36, 13 April 2020 (UTC)
- I agree that it is probably time to create a new "Active Cases" section on the graph and perhaps a chart below; active cases are now dropping and will be an important metric moving forward. The active cases can be backdated to April 5 when recovery statistics started being released. However, I don't think it needs to usurp the growth rate in new cases, both can be recorded. Maranello10 (talk) 02:48, 14 April 2020 (UTC)
If growth rate formula is not modified it's better to be removed altogether. It misleads people, people watch that number going down and think that means something, in reality it does not, e.g.:
- let's say today we have 10000 people sick and say for example 0 recovered 333 new cases would mean 3.33% growth;
- in a month all those first-day 10000 sick people recover, but new 10000 get sick over the month and say for example 333 new cases registered on 30th day again, currently growth formula gives 1.66% growth (which really tells nothing).
In the example above day 1 and day 30 are equal in terms of how many new people get infected by existing sick people. Growth formula was right while we had no recovery cases and number of sick people was almost equal to total, now it needs to be modified or as I said removed altogether (so wikipedia doesn't mislead people with that number). Nicholas Geo (talk) 05:23, 14 April 2020 (UTC)
- One problem is that the recovered numbers provided by the government are obviously wrong. The data for Victoria shows a consistent 10 day lag from numbers to recovery (perhaps a bit too consistent!), while the Australian lag is growing daily. It probably excludes some states.
- That said, the most important statistic is R0 -- the number of people that each sick person infects, on average. If it is < 1, the virus will die out. The scary modeling was based on numbers > 2!. It looks like the current R0 is about 0.2. R0 could be be calculated as (New cases per day locally acquired * Average length of infection / Number of people infected). Currently 40 * 12 / (6400 - 3598) = 17%. It would be good to track in the article.Tuntable (talk) 01:04, 15 April 2020 (UTC)
- @Tuntable: It might be good to add a R0 at some point, do you have any outside references of this calculation being done on either Australian or any other country's data? Is there any other wiki country page doing it that we may be able to leverage a template? If we just add our own calculation it will probably violate WP:NOR. Maranello10 (talk) 01:59, 15 April 2020 (UTC)
- No useful references. A few reports that estimate R0 of 2 or more -- we are all going to die. Obviously nonsense. Surprising given all the hype over Covid-19, nobody has bothered to think about R0, and how R0 responds to different policy measures. And of course any government modeling is secret. Tuntable (talk) 05:51, 15 April 2020 (UTC)
- @Tuntable: I agree. The modelling that assumed 70% vs 80% vs 90% staying at home didn't account for the proportion of people still out but effectively social distancing.... it seems to assume that 30% of people in a 70% scenario would be business as usual. I think the R0 > 2 is a baseline if left unchecked, just a pure epidemiology stat based on the biology of the virus, not accounting for policy. It is obviously under 1 at the moment. I think a chart showing "Active Cases" though provides indirect R0 information, similar to the one in the South Korean page, whose active cases are dropping like Australia's. I believe it is something definitely worth considering. Maranello10 (talk) 07:15, 15 April 2020 (UTC)
Unfortunately, the Australian recovery data is plain wrong. You notice that people are not getting better in a timely manner, currently 18 days and growing. In a few more days that will be obvious. I am surprised that the epidemiologists have not been criticized for their terrible modeling. It is obvious that people will take care when there is a virus about, even flu. Tuntable (talk) 02:56, 16 April 2020 (UTC)
- @Tuntable: I am not so sure, there is no reason why people have to recover in 14 days exactly. Some may be more, some may be less. Some people may be recovered but don't get retested for several days, there may be different protocols in different states or even delays within states due to proximity to a testing centre. I would not expect a perfect linear relationship between New Cases and New Cases + 14 = Recovery. Maranello10 (talk) 04:41, 16 April 2020 (UTC)
- Yes, but the Average will be fairly constant. Anyway, we shall see what happens to the data over the next week or so. Tuntable (talk) 02:04, 19 April 2020 (UTC)
![]() Not done for now:: More discussion needed on the best way to report active cases. Maranello10 (talk) 07:48, 16 April 2020 (UTC)
Not done for now:: More discussion needed on the best way to report active cases. Maranello10 (talk) 07:48, 16 April 2020 (UTC)
References
- ^ "Coronavirus disease (COVID-19)". Tasmanian Government Department of Premier and Cabinet. 25 March 2020. Retrieved 14 April 2020.
{{cite web}}: CS1 maint: url-status (link) - ^ "Coronavirus (COVID-19) current situation and case numbers". Australian Government Department of Health. 17 March 2020. Archived from the original on 17 March 2020. Retrieved 17 March 2020.
- ^ Cite error: The named reference
:1was invoked but never defined (see the help page). - ^ "Coronavirus (COVID-19) current situation and case numbers". Australian Government Department of Health. 17 March 2020. Archived from the original on 17 March 2020. Retrieved 17 March 2020.
- ^ "2020 media releases from NSW Health". NSW Health. Retrieved 31 March 2020.
- ^ Cite error: The named reference
health.nsw.gov.auwas invoked but never defined (see the help page). - ^ "Current status and contact tracing alerts — coronavirus (COVID-19)". QLD Government. Retrieved 31 March 2020.
- ^ "Department of Health and Human Services Victoria | Coronavirus disease (COVID-19)". Department of Health and Human Services Victoria. Retrieved 31 March 2020.
{{cite web}}: CS1 maint: url-status (link) - ^ "Confirmed and suspected cases of COVID-19 in South Australia". SA Health. Retrieved 31 March 2020.
- ^ "COVID-19 statistics". WA Health. Retrieved 31 March 2020.
{{cite web}}: CS1 maint: url-status (link) - ^ "Coronavirus disease (COVID-19)". Tasmanian Government Department of Premier and Cabinet. Retrieved 31 March 2020.
{{cite web}}: CS1 maint: url-status (link) - ^ "Updates - COVID-19". ACT Government. Retrieved 31 March 2020.
{{cite web}}: CS1 maint: url-status (link) - ^ "Updates | Coronavirus (COVID-19)". Northern Territory Government. Retrieved 2020-04-01.
{{cite web}}: CS1 maint: url-status (link) - ^ Cite error: The named reference
number of NT cases adjusted from 12 to 13was invoked but never defined (see the help page). - ^ a b Cite error: The named reference
Territorian treated by NSW Healthwas invoked but never defined (see the help page). - ^ "Coronavirus (COVID-19) current situation and case numbers". Department of Health. Retrieved 31 March 2020.
- ^ "COVID-19 at a Glance Infographic (12th April)" (PDF). www.health.gov.au.
- ^ "COVID-19 (Coronavirus) statistics". www.health.nsw.gov.au.
- ^ "COVID-19 update – 12 April 2020". www.covid19.act.gov.au.
- ^ "COVID-19 at a Glance Infographic (13th April)" (PDF). www.health.gov.au.
Semi-log plot of SARS-CoV-2 cases and COVID-19 deaths in Australia
Why use the name of the virus for "cases" and the name of the disease for "deaths". It is confusing as at first sight it looks like you are comparing COVID 19 to the old SARS epidemic.PiElectron (talk) 23:17, 19 April 2020 (UTC)
- Done I agree. Maranello10 (talk) 23:59, 19 April 2020 (UTC)
Possibly helpful source
![]() External link: The Guardian: Coronavirus numbers in Australia: how many new cases are there? Covid-19 map, stats and graph
Hi guys, dropping in from Template:2019-20 coronavirus pandemic data. An IP editor suggested the above link to us for maps that display virus prevalence by location visually. Maybe y'all can use it. —Tenryuu 🐲 ( 💬 • 📝 ) 21:25, 20 April 2020 (UTC)
External link: The Guardian: Coronavirus numbers in Australia: how many new cases are there? Covid-19 map, stats and graph
Hi guys, dropping in from Template:2019-20 coronavirus pandemic data. An IP editor suggested the above link to us for maps that display virus prevalence by location visually. Maybe y'all can use it. —Tenryuu 🐲 ( 💬 • 📝 ) 21:25, 20 April 2020 (UTC)
"Corona in Australia" listed at Redirects for discussion

An editor has asked for a discussion to address the redirect Corona in Australia. Please participate in the redirect discussion if you wish to do so. -- Tavix (talk) 13:33, 24 April 2020 (UTC)
ACT became Coronavirus free now
We have no cases in ACT. — Preceding unsigned comment added by 112.213.210.94 (talk) 09:14, 2 May 2020 (UTC)
- It is already noted in the active cases section. Maranello10 (talk) 22:01, 2 May 2020 (UTC)
Cite error: There are <ref group=lower-alpha> tags or {{efn}} templates on this page, but the references will not show without a {{reflist|group=lower-alpha}} template or {{notelist}} template (see the help page).