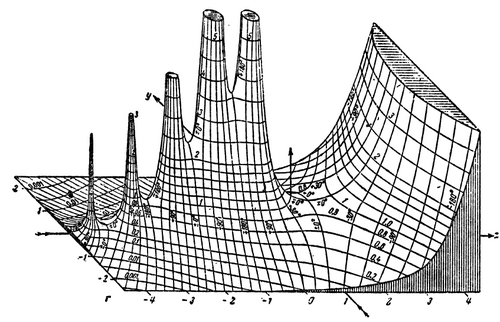
Credit: TakuyaMurata (uploader)
This is a hand-drawn graph of the absolute value (or modulus) of the gamma function on the complex plane, as published in the 1909 book Tables of Higher Functions, by Eugene Jahnke and Fritz Emde. Such three-dimensional graphs of complicated functions were rare before the advent of high-resolution computer graphics (even today, tables of values are used in many contexts to look up function values instead of consulting graphs directly). Published even before applications for the complex gamma function were discovered in theoretical physics in the 1930s, Jahnke and Emde's graph "acquired an almost iconic status", according to physicist Michael Berry. See a similar computer-generated image for comparison. When restricted to positive integers, the gamma function generates the factorials through the relation Γ(n) = (n − 1)!, which is the product of all positive integers from n − 1 down to 1 (0! is defined to be equal to 1). For real and complex numbers, the function is defined by the improper integral . This integral diverges when t is a negative integer, which is causing the spikes in the left half of the graph (these are simple poles of the function, where its values increase to infinity, analogous to asymptotes in two-dimensional graphs). The gamma function has applications in quantum physics, astrophysics, and fluid dynamics, as well as in number theory and probability.
