In optical mineralogy, an interference colour chart, also known as the Michel-Levy chart, is a tool first developed by Auguste Michel-Lévy to identify minerals in thin section using a petrographic microscope. With a known thickness of the thin section, minerals have specific and predictable colours in cross-polarized light, and this chart can help identify minerals. The colours are produced by the difference in speed in the fast and slow rays, also known as birefringence.
.jpg)
Usage
editWhen using the chart, it is important to remember these tips:
- Isotropic and opaque (metallic) minerals cannot be identified this way.
- The stage of the microscope should be rotated until maximum colour is found, and therefore, the maximum birefringence.
- Each mineral, depending on the orientation, may not exhibit the maximum birefringence. It is important to sample a number of similar minerals in order to get the best value of birefringence.
- Uniaxial minerals can look isotropic (always extinct) if the mineral is cut perpendicular to the optic axis (this situation can be revealed with the conoscopic interference pattern).
Principle
editAs polarised light passes through a birefringent sample, the phase difference between the fast and slow directions varies with the thickness, and wavelength of light used. The optical path difference (o.p.d.) is defined as , where t is the thickness of the sample.

This then leads to a phase difference between the light passing in the two vibration directions of . For example, if the optical path difference is , then the phase difference will be , and so the polarisation will be perpendicular to the original, resulting in all of the light passing through the analyser for crossed polars. If the optical path difference is , then the phase difference will be , and so the polarisation will be parallel to the original. This means that no light will be able to pass through the analyser which it is now perpendicular to.


The Michel-Levy Chart (named after Auguste Michel-Lévy) arises when polarised white light is passed through a birefringent sample. If the sample is of uniform thickness, then only one specific wavelength will meet the condition described above, and be perpendicular to the direction of the analyser. This means that instead of polychromatic light being viewed at the analyser, one specific wavelength will have been removed. This information can be used in a number of ways:[citation needed]
- If the birefringence is known, then the thickness, t, of the sample can be determined
- If the thickness is known, then the birefringence of the sample can be determined
As the order of the optical path difference increases, then it is more likely that more wavelengths of light will be removed from the spectrum. This results in the appearance of the colour being "washed out", and it becomes more difficult to determine the properties of the sample. This, however, only occurs when the sample is relatively thick when compared to the wavelength of light.
Gallery
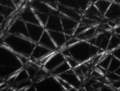
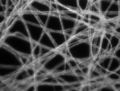
edit- Comparison of transillumination techniques used to generate contrast in a sample of tissue paper, which comprises a random mat of pure cellulose fibers. 1.559 μm/pixel.
-
 Cross-polarized light illumination, sample contrast comes from rotation of polarized light through the sample.
 -
 Bright field illumination, sample contrast comes from absorbance of light in the sample.
 -
 Dark field illumination, sample contrast comes from light scattered by the sample.
 -
 Phase contrast illumination, sample contrast comes from interference of different path lengths of light through the sample.


References
edit- Nesse, W. D., 1991, Introduction to Optical Mineralogy, 2nd edition.
External links
edit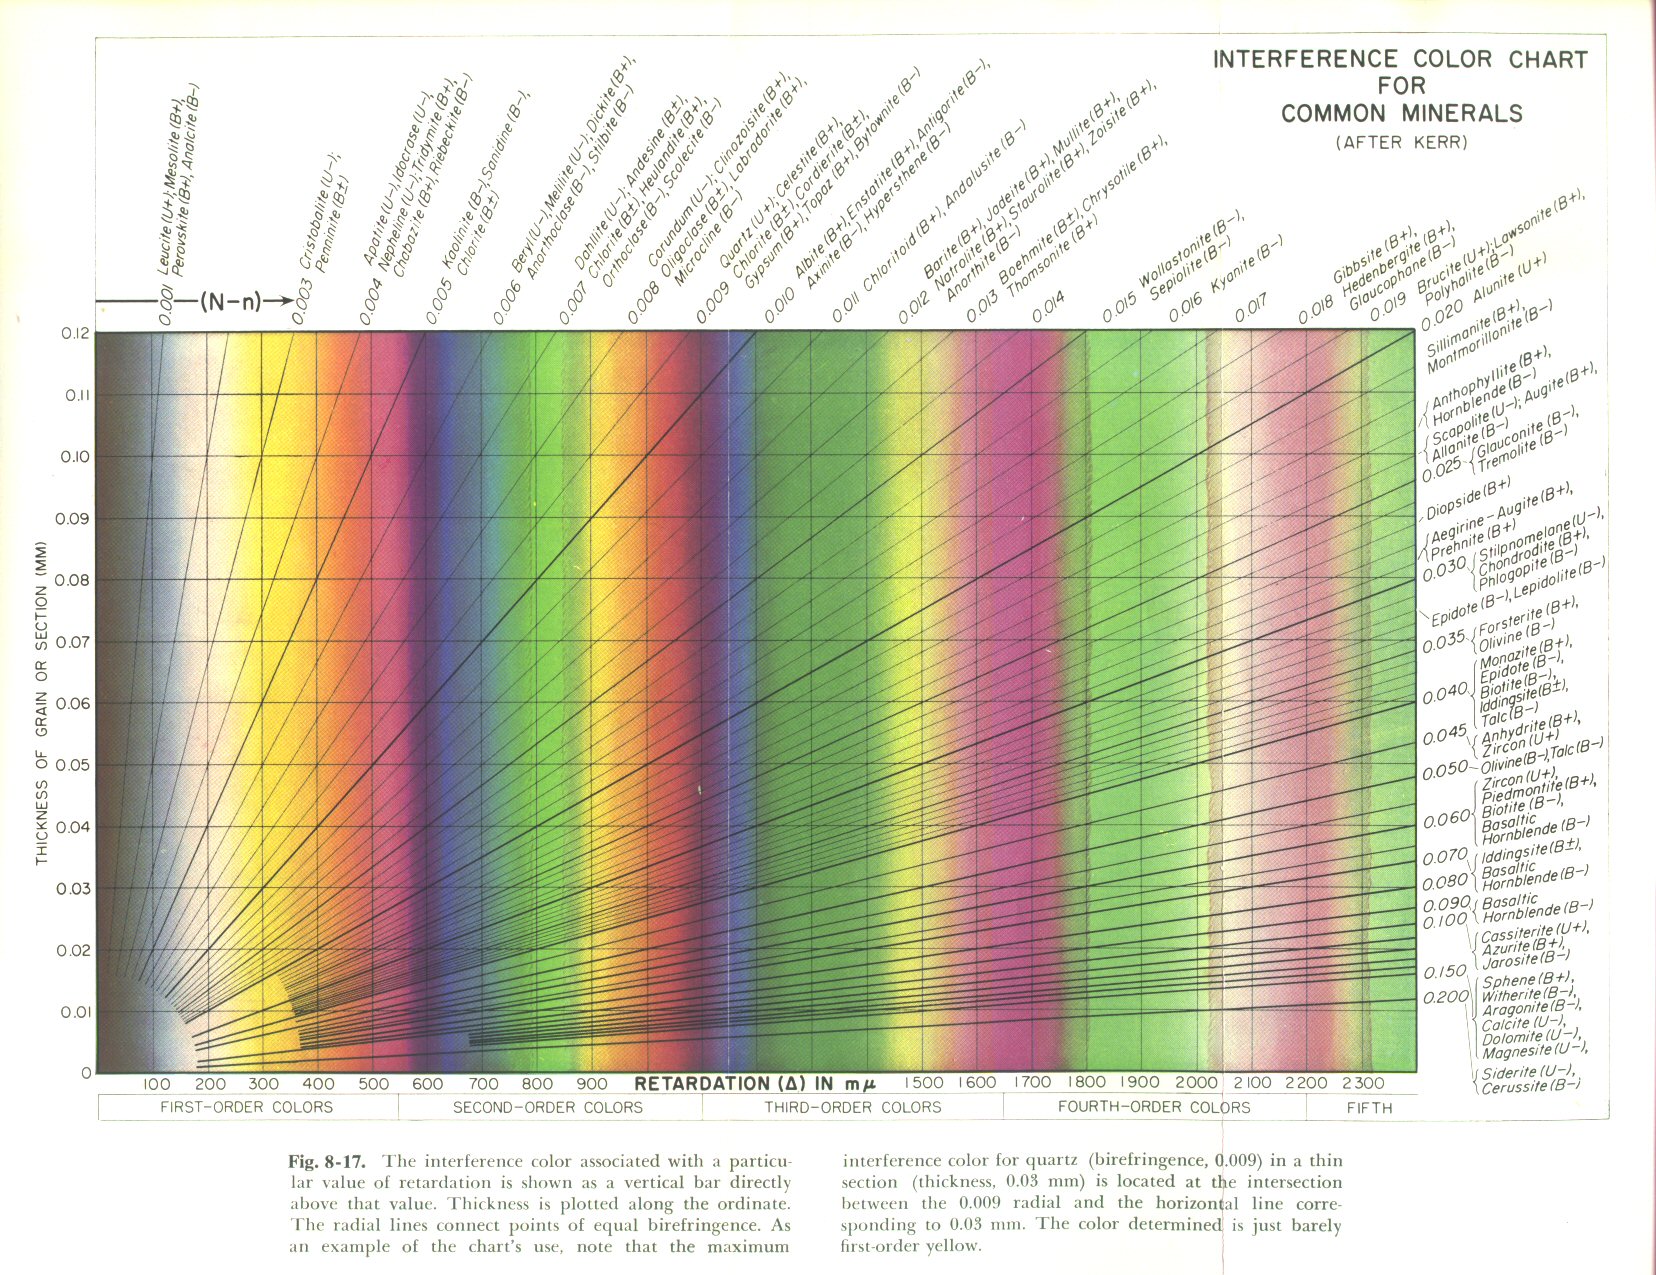
This article related to petrology is a stub. You can help Wikipedia by expanding it. |