Presidential elections
edit
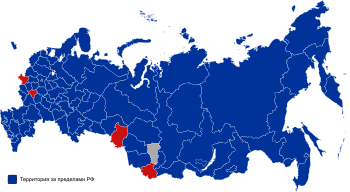
 First round of 1996 election. Grey indicates a win by Yeltsin, red a win by Zyuganov.
| First round of 1996 presidential election
|
| Candidate
|
Party
|
Votes
|
%
|
|
|
Boris Yeltsin |
Independent |
26,665,495 |
35.8
|
|
|
Gennady Zyuganov |
Communist Party |
24,211,686 |
32.5
|
|
|
Alexander Lebed |
Congress of Russian Communities |
10,974,736 |
14.7
|
|
|
Grigory Yavlinsky |
Yabloko |
5,550,752 |
7.4
|
|
|
Vladimir Zhirinovsky |
Liberal Democratic Party |
4,311,479 |
5.8
|
|
|
Svyatoslav Fyodorov |
Party of Workers' Self-Government |
699,158 |
0.9
|
|
|
Mikhail Gorbachev |
Independent |
386,069 |
0.5
|
|
|
Martin Shakkum |
Independent |
277,068 |
0.4
|
|
|
Yury Vlasov |
Independent |
151,282 |
0.2
|
|
|
Vladimir Bryntsalov |
Russian Socialist Party |
123,065 |
0.2
|
|
|
Aman Tuleyev |
Independent |
308 |
0.0
|
| Against all |
1,163,921 |
1.6
|
| Source: Nohlen & Stöver,[1] Colton[2]
|
 Second round of 1996 election. Grey indicates a win by Yeltsin, red a win by Zyuganov.
 2000 election. Blue indicates a win by Putin, red a win by Zyuganov, grey a win by Tuleyev.
| 2000 presidential election
|
| Candidate
|
Party
|
Votes
|
%
|
|
|
Vladimir Putin |
Independent |
39,740,467 |
53.4
|
|
|
Gennady Zyuganov |
Communist Party |
21,928,468 |
29.5
|
|
|
Grigory Yavlinsky |
Yabloko |
4,351,450 |
5.9
|
|
|
Aman Tuleyev |
Independent |
2,217,364 |
3.0
|
|
|
Vladimir Zhirinovsky |
Liberal Democratic Party |
2,026,509 |
2.7
|
|
|
Konstantin Titov |
Independent |
1,107,269 |
1.5
|
|
|
Ella Pamfilova |
For Civic Dignity |
758,967 |
1.0
|
|
|
Stanislav Govorukhin |
Independent |
328,723 |
0.4
|
|
|
Yury Skuratov |
Independent |
319,189 |
0.4
|
|
|
Alexey Podberezkin |
Spiritual Heritage |
98,177 |
0.1
|
|
|
Umar Dzhabrailov |
Independent |
78,498 |
0.1
|
| Against all |
1,414,673 |
1.9
|
| Source: Nohlen & Stöver, University of Essex
|
| 2012 presidential election
|
| Candidates
|
Party
|
Votes
|
%
|
|
|
Vladimir Putin |
United Russia |
45,602,075 |
63.60
|
|
|
Gennady Zyuganov |
Communist Party |
12,318,353 |
17.18
|
|
|
Mikhail Prokhorov |
Independent |
5,722,508 |
7.98
|
|
|
Vladimir Zhirinovsky |
Liberal Democratic Party |
4,458,103 |
6.22
|
|
|
Sergey Mironov |
A Just Russia |
2,763,935 |
3.85
|
| Source: Central Election Commission of the Russian Federation
|


