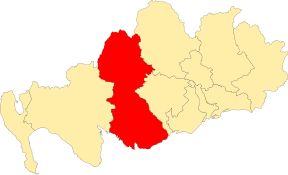
Dee and Glenkens is one of the thirteen wards used to elect members of Dumfries and Galloway Council. It elects four Councillors.
Location of the ward[1]
Councillors
edit| Election | Councillors | |||||||
|---|---|---|---|---|---|---|---|---|
| 2007 | Jane Maitland (Ind.) |
Patsy Gilroy (Conservative) |
Thomas Jacques (SNP) | |||||
| 2012 | Colin Wyper (Ind.) | |||||||
| 2017 | Dougie Campbell (SNP/Ind.) | |||||||
| 2022 | Andy McFarlane (SNP) |
John Denerley (Conservative) |
||||||
Election results
edit2017 election
edit2017 Dumfries and Galloway Council election[2]
| Party | Candidate | FPv% | Count | ||||||||
|---|---|---|---|---|---|---|---|---|---|---|---|
| 1 | 2 | 3 | 4 | 5 | 6 | 7 | 8 | ||||
| Conservative | Patsy Gilroy (incumbent)† | 33.47 | 1,547 | ||||||||
| SNP | Dougie Campbell | 19.56 | 904 | 909.31 | 916.81 | 921.32 | 934.82 | 967.08 | 1,121.83 | 1,250.09 | |
| Independent | Douglas Swan | 15.84 | 732 | 788.11 | 804.12 | 817.64 | 844.2 | 886.49 | 925.55 | ||
| Independent | Jane Maitland (incumbent) | 14.37 | 664 | 824.49 | 833.27 | 850.57 | 937.7 | 983.26 | 1,096.79 | 1,522.66 | |
| Scottish Green | Laura Moodie | 6.32 | 292 | 303.88 | 305.88 | 321.67 | 333.43 | 402.21 | |||
| Labour | Elizabeth Maxwell | 4.69 | 217 | 237.72 | 238.98 | 258.26 | 262.28 | ||||
| Independent | Andi Holmes | 2.60 | 120 | 144.52 | 157.28 | 174.57 | |||||
| Liberal Democrats | Andrew Metcalf | 1.84 | 85 | 106.74 | 111.99 | ||||||
| No description | John Thorn | 1.32 | 61 | 70.6 | |||||||
| Electorate: 8,239 Valid: 4,622 Spoilt: 34 Quota: 1,156 Turnout: 56.5 | |||||||||||
2012 election
edit2012 Dumfries and Galloway Council election[3]
| Party | Candidate | FPv% | Count | ||||||||
|---|---|---|---|---|---|---|---|---|---|---|---|
| 1 | 2 | 3 | 4 | 5 | 6 | 7 | 8 | ||||
| Independent | Colin Wyper | 36.51 | 1,473 | ||||||||
| Independent | Jane Maitland (incumbent) | 18.39 | 742 | 815.4 | 849.4 | 889.9 | 956.9 | 1,055.2 | |||
| Conservative | Patsy Gilroy (incumbent) | 18.05 | 728 | 780.9 | 795.4 | 801.3 | 831.9 | 849.4 | 868.4 | 1,021.2 | |
| SNP | Thomas Jacques (incumbent) | 11.48 | 463 | 525.4 | 536.2 | 567.4 | 600.3 | 693.6 | 701.6 | ||
| Labour | Marsali Caig | 7.06 | 285 | 355.6 | 369.2 | 386.4 | 422.2 | ||||
| Independent | Franca Bruno | 3.5 | 141 | 181.9 | 196.7 | 220.3 | |||||
| Scottish Green | James Smyth | 2.85 | 115 | 127.9 | 140.5 | ||||||
| Liberal Democrats | John Womersley | 2.16 | 87 | 116.3 | |||||||
| Electorate: 7,373 Valid: 4,034 Spoilt: 38 Quota: 1,009 Turnout: 4,072 (54.71%) | |||||||||||
2007 election
edit2007 Dumfries and Galloway Council election[4]
| Party | Candidate | FPv% | Count | ||||||
|---|---|---|---|---|---|---|---|---|---|
| 1 | 2 | 3 | 4 | 5 | 6 | ||||
| Conservative | Patsy Gilroy | 21.0 | 994 | 1,027 | 1,054 | 1,059.04 | 1,143.39 | 1,736.70 | |
| Independent | Jane Maitland | 20.9 | 989 | 1,062 | 1,200 | ||||
| SNP | Thomas Jacques | 19.5 | 924 | 970 | 1,043 | 1,045.25 | 1,122.86 | 1,188.13 | |
| Conservative | Chris Walker | 14.8 | 701 | 713 | 766 | 767.85 | 906.59 | ||
| Independent | Ian McConchie | 8.8 | 418 | 437 | 490 | 494.56 | |||
| Liberal Democrats | Joan Mitchell | 8.1 | 384 | 437 | |||||
| Labour | John Syndney Burt | 6.7 | 319 | ||||||
| Electorate: 7,463 Valid: 4,729 Spoilt: 68 Quota: 1,183 Turnout: 64.3% | |||||||||
References
edit- ^ "Dee and Glenkens: Ward 3 Profile" (PDF). Dumfries and Galloway Council. Retrieved 18 July 2022.
- ^ "Council elections - May 2017".
- ^ "Local Elections Archive Project - 2012 - Dumfries and Galloway".
- ^ https://www.gallowaygazette.co.uk/news/dumfries-and-galloway-council-elections-1-334191 [dead link]
