Leeds, England is the third most populous city in the United Kingdom.
| Demographics of Leeds | |
|---|---|
 Population pyramid of Leeds | |
| Population | 751,485 (2011) |
| Density | 1,388 people per square km. |

Population edit
Leeds's total population, according to the 2011 UK census, was 751,485. The population density was 1,388 people per square km.
Ethnicity edit


The following table shows the ethnic group of respondents in the 2001 and 2011 censuses in Leeds.
| Ethnic Group | 1971 estimations[1] | 1981 estimations[2] | 1991[3] | 2001[4] | 2011[5] | 2021[6] | ||||||
|---|---|---|---|---|---|---|---|---|---|---|---|---|
| Number | % | Number | % | Number | % | Number | % | Number | % | Number | % | |
| White: Total | 772,062 | 97.9% | 660,754 | 96% | 640,997 | 94.16% | 657,082 | 91.85% | 639,487 | 85.10% | 641,801 | 79% |
| White: British | – | – | – | – | – | – | 637,872 | 89.16% | 609,714 | 81.13% | 595,737 | 73.4% |
| White: Irish | – | – | – | – | 9,163 | 1.34% | 8,578 | 1.20% | 7,031 | 0.94% | 6,892 | 0.8% |
| White: Gypsy or Irish Traveller[note 1] | – | – | – | – | – | – | – | – | 687 | 0.09% | 878 | 0.1% |
| White: Roma | – | – | – | – | – | – | – | – | – | – | 1,610 | 0.2% |
| White: Other | – | – | – | – | – | – | 10,632 | 1.49% | 22,055 | 2.93% | 36,684 | 4.5% |
| Asian or Asian British: Total | – | – | – | – | 24,602 | 3.61% | 35,737 | 5.00% | 58,243 | 7.75% | 78,503 | 9.7% |
| Asian or Asian British: Indian | – | – | – | – | 9,900 | 12,303 | 1.72% | 16,130 | 2.15% | 21,087 | 2.6% | |
| Asian or Asian British: Pakistani | – | – | – | – | 9,329 | 15,064 | 2.11% | 22,492 | 2.99% | 31,405 | 3.9% | |
| Asian or Asian British: Bangladeshi | – | – | – | – | 1,759 | 2,537 | 0.35% | 4,432 | 0.59% | 5,876 | 0.7% | |
| Asian or Asian British: Chinese[note 2] | – | – | – | – | 2,066 | 3,447 | 0.48% | 5,933 | 0.79% | 8,117 | 1.0% | |
| Asian or Asian British: Other Asian | – | – | – | – | 1,548 | 2,386 | 0.33% | 9,256 | 1.23% | 12,018 | 1.5% | |
| Black or Black British: Total | – | – | – | – | 10,815 | 1.58% | 10,318 | 1.44% | 25,893 | 3.45% | 45,376 | 5.6% |
| Black or Black British: African | – | – | – | – | 1,343 | 2,435 | 0.34% | 14,894 | 1.98% | 32,211 | 4.0% | |
| Black or Black British: Caribbean | – | – | – | – | 6,554 | 6,718 | 0.94% | 6,728 | 0.90% | 7,889 | 1.0% | |
| Black or Black British: Other Black | – | – | – | – | 2,918 | 1,165 | 0.16% | 4,271 | 0.57% | 5,276 | 0.6% | |
| Mixed: Total | – | – | – | – | – | – | 9,737 | 1.36% | 19,632 | 2.61% | 27,388 | 3.3% |
| Mixed: White and Black Caribbean | – | – | – | – | – | – | 4,603 | 0.64% | 8,813 | 1.17% | 10,028 | 1.2% |
| Mixed: White and Black African | – | – | – | – | – | – | 885 | 0.12% | 2,493 | 0.33% | 4,294 | 0.5% |
| Mixed: White and Asian | – | – | – | – | – | – | 2,516 | 0.35% | 4,906 | 0.65% | 7,410 | 0.9% |
| Mixed: Other Mixed | – | – | – | – | – | – | 1,733 | 0.24% | 3,420 | 0.46% | 5,656 | 0.7% |
| Other: Total | – | – | – | – | 4,308 | 0.63% | 2,528 | 0.35% | 8,230 | 1.10% | 18,885 | 2.3% |
| Other: Arab[note 3] | – | – | – | – | – | – | – | – | 3,791 | 0.50% | 5,980 | 0.7% |
| Other: Any other ethnic group | – | – | – | – | 4,308 | 0.63% | 2,528 | 0.35% | 4,439 | 0.59% | 12,905 | 1.6% |
| Non-White: Total | 16,938 | 2.1% | 27,807 | 4% | 39,725 | 5.8% | 58,320 | 8.1% | 111,998 | 14.9% | 170,152 | 21% |
| Total | 789,000 | 100% | 688,561 | 100% | 680,722 | 100% | 715,402 | 100% | 751,485 | 100% | 811,953 | 100% |
Notes for table above
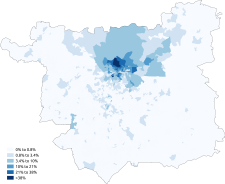
Distribution of ethnic groups in the Leeds Metropolitan District Council area according to the 2011 census.
-
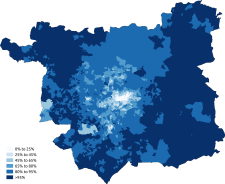 White
White -
 White-British
 -
 White-Irish
 -
 White-Other
 -
 Asian
Asian -
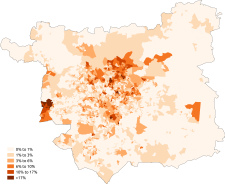 Asian-Indian
 -
 Asian-Pakistani
 -
 Asian-Bangladeshi
 -
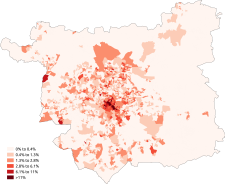 Asian-Chinese
 -
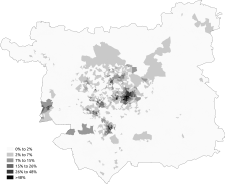
 Black
Black -
 Black-African
 -
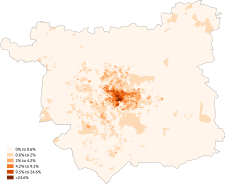 Black-Caribbean
 -
 Other-Arab


Languages edit
The most common main languages spoken in Leeds according to the 2011 census are shown below.[7]
| Rank | Language | Usual residents aged 3+ | Proportion |
|---|---|---|---|
| 1 | English | 670,650 | 92.90% |
| 2 | Polish | 6,717 | 0.93% |
| 3 | Urdu | 4,989 | 0.69% |
| 4 | Punjabi | 4,537 | 0.63% |
| 5 | Arabic | 3,393 | 0.47% |
| 6 | Bengali (with Sylheti and Chatgaya) | 1,955 | 0.27% |
| 7 | Kurdish | 1,772 | 0.25% |
| 8 | French | 1,724 | 0.24% |
| 9 | Persian | 1,623 | 0.22% |
| 10 | Portuguese | 1,260 | 0.17% |
| 11 | Tigrinya | 904 | 0.13% |
| 12 | Spanish | 851 | 0.12% |
| 13 | Lithuanian | 842 | 0.12% |
| 14 | Shona | 793 | 0.11% |
| 15 | Gujarati | 760 | 0.11% |
| 16 | Russian | 737 | 0.10% |
| 17 | Greek | 726 | 0.10% |
| 18 | Czech | 707 | 0.10% |
| 19 | Hindi | 705 | 0.10% |
| 20 | Cantonese Chinese | 704 | 0.10% |
| Other | 15,522 | 2.15% |
Religion edit

The following table shows the religion of respondents in recent censuses in Leeds.
| Religion | 2001[8] | 2011[9] | 2021[10] | |||
|---|---|---|---|---|---|---|
| Number | % | Number | % | Number | % | |
| Christian | 492,656 | 68.86% | 419,790 | 55.86% | 343,311 | 42.28% |
| Muslim | 21,394 | 2.99% | 40,772 | 5.43% | 63,054 | 7.77% |
| Sikh | 7,586 | 1.06% | 8,914 | 1.19% | 10,047 | 1.24% |
| Hindu | 4,183 | 0.58% | 7,048 | 0.94% | 9,217 | 1.14% |
| Jewish | 8,267 | 1.16% | 6,847 | 0.91% | 6,267 | 0.77% |
| Buddhist | 1,587 | 0.22% | 2,772 | 0.37% | 2,874 | 0.35% |
| Other religion | 1,530 | 0.21% | 2,396 | 0.32% | 3,637 | 0.45% |
| No religion | 120,139 | 16.79% | 212,229 | 28.24% | 326,231 | 40.18% |
| Religion not stated | 58,060 | 8.12% | 50,717 | 6.75% | 47,315 | 5.83% |
| Total | 715,402 | 100.00% | 751,485 | 100.00% | 811,953 | 100.00% |
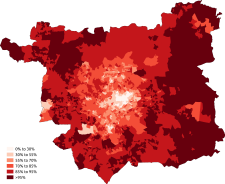
Distribution of religions in the Leeds Metropolitan District Council area according to the 2011 census.
-
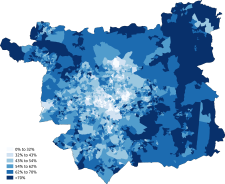 Christianity
 -
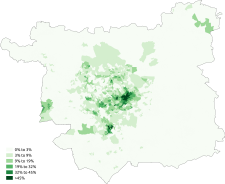 Islam
Islam -
 Judaism
 -
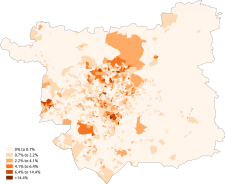 Hinduism
 -
 Sikhism
 -
 Buddhism
 -
 Other religion
 -
 No religion


See also edit
- Demographics of West Yorkshire
- Demographics of the United Kingdom
- Demographics of England
- Demographics of London
- Demographics of Birmingham
- Demographics of Greater Manchester
- List of English cities by population
- List of English districts by population
- List of English districts and their ethnic composition
- List of English districts by area
- List of English districts by population density
References edit
- ^ Jones, P. N. (1978). "The Distribution and Diffusion of the Coloured Population in England and Wales, 1961-71". Transactions of the Institute of British Geographers. 3 (4): 515–532. Bibcode:1978TrIBG...3..515J. doi:10.2307/622127. ISSN 0020-2754. JSTOR 622127. PMID 12157820.
- ^ Equality, Commission for Racial (1985). "Ethnic minorities in Britain: statistical information on the pattern of settlement". Commission for Racial Equality: Table 2.2.
- ^ Data is taken from United Kingdom Casweb Data services of the United Kingdom 1991 Census on Ethnic Data for England, Scotland and Wales Archived 5 April 2022 at the Wayback Machine (Table 6)
- ^ "Office of National Statistics; 2001 Census Key Statistics". webarchive.nationalarchives.gov.uk. Retrieved 7 September 2021.
- ^ "2011 Census: Ethnic Group, local authorities in England and Wales". webarchive.nationalarchives.gov.uk. Retrieved 15 December 2021.
- ^ "Ethnic group - Office for National Statistics". www.ons.gov.uk. Retrieved 29 November 2022.
- ^ "Download:local authorities: county / unitary". NOMIS. Retrieved 17 June 2015.
- ^ "2001 census - theme tables". Retrieved 17 June 2015.
- ^ "Download:local authorities: county / unitary". NOMIS. Retrieved 17 June 2015.
- ^ "Religion". ONS. Retrieved 5 December 2022.