Talk:Opinion polling for the 2024 United Kingdom general election/Archive 2
| This is an archive of past discussions. Do not edit the contents of this page. If you wish to start a new discussion or revive an old one, please do so on the current talk page. |
| Archive 1 | Archive 2 | Archive 3 | Archive 4 | Archive 5 |
Graphical polling
I think, we should go with my version, due it is like Avopeas' Version of his works (Iceland, Austria, Denmark, Norway, Sweden and Finland).these are very popular in my opinion. But what do you think? DerÖsterreicher1 (talk) —Preceding undated comment added 00:25, 31 January 2020 (UTC)
- I don't see the value of a graph that is mostly blank space. It makes more sense for the graph to go up the most recent polls. Bondegezou (talk) 09:57, 31 January 2020 (UTC)
- I am more concerned by the fact that the graph shows a made-up average and compares it with the election result. Is such an average backed by a reliable source? One thing is to calculate average trend lines, a very different one is to show specific, hand-made results. I also don't see these graphs as "popular" (yeah, one user has added them all over Wikipedia but I don't think that counts in terms of popularity). In fact, these have been removed/replaced from articles when an alternative version has been made available. Impru20talk 10:06, 31 January 2020 (UTC)
- Both graphs use averages for smoothing. I'd personally prefer a handmade graph like DerÖsterreicher1's since it include the actual polls as data points. I also don't see the problem with the blank space. It's only been a few weeks since the election, why would you want to try to hide that fact by stretching the timeline? --Gbuvn (talk) 11:49, 31 January 2020 (UTC)
- Using averages for smoothing is one thing and well into WP:CALC. Using a specific average as indication of something, then compare it with election results and present it as such, could go into WP:SYNTH territory in my opinion. Impru20talk 12:10, 31 January 2020 (UTC)
- I concur with Impru20 about the bar charts on the right: these are straying further into WP:OR and should be avoided. Bondegezou (talk) 13:24, 31 January 2020 (UTC)
- Technically, the line chart also compares a specific current average (and former averages) with the election result, it's just harder to see the exact numbers. But that's not my point, I don't really care much for the bar chart. I'm just saying that the graph template is less customizable, shows less information and can get quite ugly, which is why we should use an image as long as long as somebody is willing to update regularly. --Gbuvn (talk) 13:45, 31 January 2020 (UTC)
- I am ready to update it regularly, but you see, many people are against it, even though i made this Graphic even before the first poll (with the results of the general election only, then i added the polls, had one mistake on it, and it got replaced by this ugly chart, i agree, but I have here much Opposition, and as long this is a thing, I can't really do something. Because my edits will be reverted twice, before i can make my edits! And i do not want a Wiki War + Ban so....DerÖsterreicher1 (talk) 14:41, 31 January 2020 (UTC)
- Technically, the line chart also compares a specific current average (and former averages) with the election result, it's just harder to see the exact numbers. But that's not my point, I don't really care much for the bar chart. I'm just saying that the graph template is less customizable, shows less information and can get quite ugly, which is why we should use an image as long as long as somebody is willing to update regularly. --Gbuvn (talk) 13:45, 31 January 2020 (UTC)
- I concur with Impru20 about the bar charts on the right: these are straying further into WP:OR and should be avoided. Bondegezou (talk) 13:24, 31 January 2020 (UTC)
- Using averages for smoothing is one thing and well into WP:CALC. Using a specific average as indication of something, then compare it with election results and present it as such, could go into WP:SYNTH territory in my opinion. Impru20talk 12:10, 31 January 2020 (UTC)
- Both graphs use averages for smoothing. I'd personally prefer a handmade graph like DerÖsterreicher1's since it include the actual polls as data points. I also don't see the problem with the blank space. It's only been a few weeks since the election, why would you want to try to hide that fact by stretching the timeline? --Gbuvn (talk) 11:49, 31 January 2020 (UTC)
- I am more concerned by the fact that the graph shows a made-up average and compares it with the election result. Is such an average backed by a reliable source? One thing is to calculate average trend lines, a very different one is to show specific, hand-made results. I also don't see these graphs as "popular" (yeah, one user has added them all over Wikipedia but I don't think that counts in terms of popularity). In fact, these have been removed/replaced from articles when an alternative version has been made available. Impru20talk 10:06, 31 January 2020 (UTC)
- Personally, I much prefer DerÖsterreicher1 version of the graph, its much clearer. All these graphs have used averages, and the blank space is better than uninformative pointless parallel lines. ~ BOD ~ TALK 15:09, 31 January 2020 (UTC)
- It is not the fact of using averages to calculate trend lines. It is the fact that one of such averages is cherry-picked and presented as the headline figures in comparison to election results. Why those and not any other? This is very obviously original reseach, unless there is some source backing up the use of such specific average as a headline figure. Plus, in most charts of this kind averages tend to be moving ones, which make the presentation of any specific, "headline" figure as pointless as these just grasp a very limited point in the trend which, by itself, does not have to be representative the rest of it.
- The blank space is a non-issue for me, though. Impru20talk 16:07, 31 January 2020 (UTC)
- Yea so, Problem is, you are the only one for this Ugly (easy manipulatable) Graph, that was made there. Well, If you like easy manipulatable Graphs, fine by me, what my problem is with that, is, that I (and mostly I think others too) hate manipulation. With an Excel Graph, you can't let anyone edit it, and then manipulate, that is why I am for regularly-updating Users, who make a Graph for an Opinion Polling page. But, what I have a problem too, that you involve into things, and then bring Arguments, that have nothing to do with the other things, for example, when I wanted to add my Graph to the Opinion_polling_for_the_next_Spanish_general_election, I added it first, you deleted it, for almost no reason, except for "Consistency", which is a "very logical explanation". No that's no proper argument, it's just, you say , it's a verry logical explanation, and idk what was explained, please explain it next time properly, because one word, and then it's a very logical explanation, No, I don't get it, I am sorry, that is Harvard-Like Thinking. But hey, I didn't open my mouth, I was happy with your decision, at hte greek Opinion Polling, Ok, I involved into it, even tho there was a graph, wasn't cool for me. But here I draw the line, I had a graph done before even the first Poll came out, Updated it ASAP, when a Poll came out, Uploaded it yesterday with a Mistake, calling the Conservatives Tories, and you instantly stay ith hte manipulatable graph. let me guess, Consistency, right?DerÖsterreicher1 (talk) 16:26, 31 January 2020 (UTC)
- First, this "easily manipulatable graph" was the result of a consensus in a discussion above, one you just rejected to abide to by trying to enforce your chart without a previous discussion on it. Surely your current tone is entirely out of place here.
- Second, other users have voiced opposition to your graph.
- Third, why is the current graph "easily manipulatable" but yours isn't? In fact, yours is presenting a random, cherry-picked average as headline figures to casual readers, whereas the other doesn't, causing WP:OR concerns. You are not even addressing this issue.
- Fourth, if you have a personal issue with me because I did not agree with your unilateral addition of your graph to Opinion_polling_for_the_next_Spanish_general_election that's your problem, not mine. Nonetheless, just note that this one you point out is just one out of many examples of you seeking to replace other charts with your own all throughout Wikipedia in an unilateral way and without seeking any consensus. I am pretty sure that "consistency" is a much more logical and policy-based explanation that "hey dude I like my chart let's have it instead of the other one whose model has been used for years in Spanish opinion polling articles yeah?"-sort of explanation. What'd you think if I just started uploading charts for every opinion polling article where you have had your charts imposed, then unilaterally sought to replace them all? You would surely complain in a similar way as you do now, right?
- Fifth, yeah, when someone disagrees with you they may "bring arguments". It's a pity that you have a problem with that, because that is how Wikipedia and consensus-building works.
- In my opinion, I would rather have this consistent and use a chart similar to the one used in Opinion polling for the 2019 United Kingdom general election. Though at this point there are just three opinion polls published, which may not even merit a chart yet. Impru20talk 16:41, 31 January 2020 (UTC)
- But is DerÖsterreicher1's graph that much different from the 2019 one? I understand that you're opposed to the bar chart part but what about the rest? I feel like it should be possible for everyone here to agree on using that graph without the bar chart. --Gbuvn (talk) 20:04, 31 January 2020 (UTC)
- In my opinion, there are a number of issues where the 2019 chart is clearly an improvement: poll dots being much more visible (if you choose to have them, I understand that it is for them to be spotted), grid should be less visible (it is the trendlines that should feature predominantly; a very notorious grid will only serve to mislead), unneeded decimals in the Y axis... such things.
- Aside of the fact that three polls is not even enough for a comprehensive chart to be created, but that's a different story. Impru20talk 20:20, 31 January 2020 (UTC)
- You know what? If you really do not appreciate my work, fine by me, I will not do it, case closed, thanks Impru, I will focus on the other things then more, I just wanted to do goo work on this Wikipedia, but if you can't appreciate it, then fine by me, keep this easy manipulable Chart, if possible until 2024. Same with Spain, after you reverted it, I did not care anymore, so is it now with the UK, thanks man, you gave me less work! Even tho I like, no I LOVE the UK, I will not continue this work because of Impru's Negative attitude to my work! DerÖsterreicher1 (talk) 20:50, 31 January 2020 (UTC)
- Oh no no no. One, I am free to give my opinion on your work, just as I have spent almost nine years in Wikipedia receiving opinions on my own work as well. This is a collaborative project, and it's not meant that your work must be automatically accepted or liked by everyone; consensus-building and BRD exist precisely for this. Second, you complain about others' "negative attitude to [your] work" while concurrently showing a complete disregard to the current chart (i.e. other's work) by repeteadly dubbing it "easy manipulable". Yes, it is far from perfect, but it had received at least partial acceptance in this talk page before you unilaterally added yours. If there is any willingness in bringing this discussion to a constructive outcome, I'll be all for it. If this is to be limited to a "accept this or I will leave this forever"-issue, then I would not be engaging in such drama. Impru20talk 21:28, 31 January 2020 (UTC)
- You know what? If you really do not appreciate my work, fine by me, I will not do it, case closed, thanks Impru, I will focus on the other things then more, I just wanted to do goo work on this Wikipedia, but if you can't appreciate it, then fine by me, keep this easy manipulable Chart, if possible until 2024. Same with Spain, after you reverted it, I did not care anymore, so is it now with the UK, thanks man, you gave me less work! Even tho I like, no I LOVE the UK, I will not continue this work because of Impru's Negative attitude to my work! DerÖsterreicher1 (talk) 20:50, 31 January 2020 (UTC)
- But is DerÖsterreicher1's graph that much different from the 2019 one? I understand that you're opposed to the bar chart part but what about the rest? I feel like it should be possible for everyone here to agree on using that graph without the bar chart. --Gbuvn (talk) 20:04, 31 January 2020 (UTC)
- Personally, I much prefer DerÖsterreicher1 version of the graph, its much clearer. All these graphs have used averages, and the blank space is better than uninformative pointless parallel lines. ~ BOD ~ TALK 15:09, 31 January 2020 (UTC)
Sorry I missed this discussion. I'll just give some background to the above discussion. For the 2017 election, I kept the graph updated every few days. After I was away for a while, someone else created an alternative graph and was happy to update it every few days until they were also away for a couple of weeks/lost interest and I recreated my graph. It's perfectly possible to do this again, it just means that it's 1. difficult to check 2. if someone is away then the graph cannot be updated. (However, it does make it more difficult to vandalise) Someone therefore suggested using the model used in the US primary polling which anyone can update. I agreed that it's too soon for a graph, but seeing as there was one already, I thought we should use the graph agreed earlier and which anyone can edit. The average is calculated by taking the mean of the previous polls (I suggest ten but we can agree that later). If we make a single point for one day (rather than one point for each poll even if there are multiple polls on a single day), then it does avoid the jerky lines from earlier graphs. Bellowhead678 (talk) 12:53, 3 February 2020 (UTC)
- Not invested in the bar chart thing but the points for individual polls should be displayed as in previous elections regardless of how the curve is calculated I think. —Nizolan (talk · c.) 13:11, 3 February 2020 (UTC)
- I don't think there's a way to do that with the graphs generated directly on Wikipedia. Bellowhead678 (talk) 13:39, 3 February 2020 (UTC)
- They do it for Canadian federal election articles and I think the method is a similar one. Impru20talk 13:52, 3 February 2020 (UTC)
- That graph is created in R and looks great. The point was, that the built-in template doesn't allow adding data points, which is why I would not use it. --Gbuvn (talk) 13:57, 3 February 2020 (UTC)
- Fair enough, though just IMO that might be a serious enough deficiency in the Graph extension to recommend using a graph made with an external programme instead. I'm not too sure about presenting Wikipedia's own mathematical analysis without a graphical indication of the original data. —Nizolan (talk · c.) 14:17, 3 February 2020 (UTC)
- That graph is created in R and looks great. The point was, that the built-in template doesn't allow adding data points, which is why I would not use it. --Gbuvn (talk) 13:57, 3 February 2020 (UTC)
- They do it for Canadian federal election articles and I think the method is a similar one. Impru20talk 13:52, 3 February 2020 (UTC)
- I don't think there's a way to do that with the graphs generated directly on Wikipedia. Bellowhead678 (talk) 13:39, 3 February 2020 (UTC)
Folks - this conversation seems to have run out of steam without causing the article to reflect collective views. I'm sure this will be controversial, but I would suggest that criteria for a 'good' chart are:
1) Each individual datapoint, as listed in the table in the article, is visible on the chart 2) The trend-line is an easily calculable (checkable) function of some well-understood subset of the datapoints 3) The trendline is 'stable': once the trendline on a given day is established, it will not change as a result of datapoints added in the future 4) The trendlines are the most visible elements of the chart, but the datapoints are visible enought give a natural indication of the dispersion of the data 5) Ideally the sample size of polls is indicated on the chart (datapoint size) 6) ideally the date associated with each datapoint is the mid-point of its survey period 7) There should only be a single trendline point at a given time (no 'jags')
The current chart either does not meet some of these criteria, or else it is entirely opaque (to me) whether it does.
I'm sure I can create a few alternatives in Excel for people to choose between, and I would be happy to update one for each poll at the moment. However, something smarter which would let anybody make updates would be better, especially in the next campaign period when the updates could turn into a full-time job. I'm afraid I don't know the technology well enough to make any suggestions, but I'd be willing to give a hand if some setup were needed.RERTwiki (talk) 09:36, 27 March 2020 (UTC)
- Your criteria seem on point to me. I'd agree - there's a conflict between having a good quality graph and updatability. One thing that was tried the last time was having an open Google sheets document and a workflow description for anyone to update, however it seems to have been too complicated for most users since it included post-processing in Inkscape. --Gbuvn (talk) 10:18, 27 March 2020 (UTC)
- Anybody give me a clue where to find - even how to look for - the code/data for the current chart? I see the code in the source seems to be a reference to the page itself. I'm clearly missing something, but don't really know where to begin to look for this info. RERTwiki (talk) 10:20, 1 April 2020 (UTC)
OK, I'm catching up a little. I found the template for the chart.
The template has the sole advantage that it is 'open' for editing, but is otherwise poor. The list of values is not maintainable, and the only way I can see to catch and fix errors is to independently re-calculate the values. The charts have very poor features compared to Excel: most of the requirements I list above can't be met, as far as I can see. Not only that, the line on the chart is based on an unspecified moving average, with an unspecified 'cubic interpolation' on top of that. Am I the only one who finds this whole situation very unsatisfactory? RERTwiki (talk) 11:27, 1 April 2020 (UTC)
- In Nationwide opinion polling for the 2020 Democratic Party presidential primaries, it’s easy to calculate because we use averages of polling aggregators to achieve our own numbers to insert into the graph. For example, if Joe Biden has 50% according to one website, 46% according to another and 48% according to the last one, we input 48% into the graph as his average until the polling aggregates change. --Comment by Selfie City (talk about my contributions) 12:23, 1 April 2020 (UTC)
Thanks for the response. There are two problems:
1) if you made a typo and input 47% instead of 48%, how does the error get caught? These numbers are supposed to be averages of - well actually, who knows how many polls. In the UK there are many parties - about 7 - not 2. that's a multiple of the chance of error. Can you imagine what the template is going to look like when there are literally hundreds of datapoints in each of 7 comma separated lists? Maybe 70 datapoints might need to be changed if someone discovers a poll that was missed. You have to pick those points from the lists by dead reckoning. That's an invitation to a trainwreck.
2) The graph format is absolutely pants. I've thought about some heroic coding to update or create a new template, but I would be trying to re-create significant features of Excel, after I fought my way through learning whatever language it's written in. That's major re-invention of the wheel, and doesn't sound like the right way to go, especially given problem 1)
I think the way to do this is to have some shared empty Excel sheet which anyone can download, paste in the current table of polls from the wiki page, and run a macro to create the chart. Unless we can use a native Excel output format such as PDF, there is a problem in creating the output graphics format. I've used PDF2PNG before, but in my experience that isn't very reliable.
Any comments? Any experienced editors know how this is best done elsewhere in Wikipedia? RERTwiki (talk) 09:30, 3 April 2020 (UTC)
- I missed this comment. I'll reply to you today when I have the time. --Comment by Selfie City (talk about my contributions) 11:39, 10 April 2020 (UTC)
- RERTWiki, I’m starting to notice unusual curves in the graph that lead me to believe that it could be much better. However, I’m sure there are people who can do the necessary code to improve Wikipedia’s graphs in general.
- However, I believe that whatever graph is used, like this one, should be designed so that anyone can edit it directly on Wikipedia or at some other open-source location. If you know anyone who could do the code, I think we should give them an opportunity to try improving or making a better graph. --Comment by Selfie City (talk about my contributions) 00:57, 11 April 2020 (UTC)
- It looks like the issue with the lines has now been fixed. --Comment by Selfie City (talk about my contributions) 17:23, 11 April 2020 (UTC)
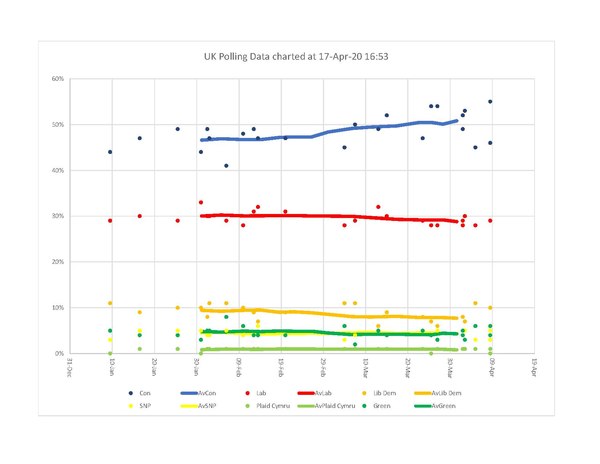
Thanks for the reply, just saw it now. Yes, the lines were crazy and are now 'fixed', but what they are is still desperately obscure. I don't think we should sacrifice a clear presentation while waiting for the graphic capabilities of Wikipedia charts to catch up. If that capability existed, it would be better to use it. But it is a huge task, and currently the graphics are terrible. We can do much better by simply sharing an excel file (somehow) and letting anyone with access to Excel (millions of people) update it.
Second, here is an example of what we could do. This is a chart of the last 10 polls, averaged as discussed above, in as far as I can quickly mock up in an hour or so. RERTwiki (talk) 16:07, 17 April 2020 (UTC)
- I think the Microsoft Excel version is the best alternative of those that have been suggested so far. However, instructions should be added near the graph (presumably in the form of a comment, making it invisible outside of editing mode) to let editors know how the graph can be edited and posted in the new version.
- I would suggest developing a Microsoft Excel graph and then building a consensus to use it over the current graph. As long as it's not too hard to edit (not much harder, if harder at all, than the current version, would be my qualification), I would support that change, as long as it was superior in design to the current graph (which it sounds like it will be). --Comment by Selfie City (talk about my contributions) 22:37, 17 April 2020 (UTC)
OK: I've modified the Excel so that it will now update easily. I've put the instructions on a page in the spreadsheet, and this is what they say:
To Prepare the Chart of Polling Averages
1. Copy all the cells from the Wikipedia table of polling data: select them and press control-c
2. Goto the sheet in this workbook called 'Table': select cell A1 and press control-v
3. The chart on the page 'Averages Chart' should now be up to date.
4. Select that page. If it looks reasonable, from the 'File' menu select 'Save As' and save the chart as a PDF.
5. Upload the PDF to Wikipedia and insert into the page as required
Possible Errors
1. Averaging the last 10 polls in the table makes most sense if they are the last 10 collected. Column AB in 'Table' highlights in pink polls which might have been inserted in the table out of order. (Order published might not be mid-point order) The option here is to fix the table order if you feel the error is significant.
2. If the data entered into the table for Con, Lab, Lib, SNP, Plaid and Green are not numbers (eg "3%[b]"), the datapoint charted will be zero, and the averages will be wrong. The data should really be fixed.
3. The date formats get confused. The most complex part of the sheet is parsing the column of start and end-dates and translating the text into two columns in Excel date format. If someone puts something unexpected in the dates column, it may break the chart.
4. If there are more than about 1000 polls, and the earliest polls and averages will be omitted. In which case the spreadsheet will need a minor edit to extend it down and extend the chart to cover the new data.
Limitations
1. Currently Brexit seems to be aggregated with Other in some polls. Brexit and Other are both excluded from the chart to ensure that the data displayed is reliable. If someone wanted to fix the table it could be extended to include Brexit.
I'd welcome comments, and any suggestions as to where to put the sheet so that everyone can access it. The Spreadsheet contains no Macros, since I know there is a reasonable concern about viruses. We could have a better chart with Macros, specifically individual datapoints could be customised. Again I'd welcome comments on whether that would be worth it.RERTwiki (talk) 09:13, 20 April 2020 (UTC)
- IMO, only a few parties should be included: Labour, Conservative, LibDem, SNP, and Green. As long as those are included, we don't need to worry about the others, as UKIP and the Brexit Party have low polling scores and are largely irrelevant at the moment. This sounds good, so assuming we can gather consensus for the new graph here, I would support adding it. I would personally count consensus as only a few people as not much more than that is realistic. --Comment by Selfie City (talk about my contributions) 13:35, 21 April 2020 (UTC)
Alright, we can wait a day or so to see if there is any more feedback, and give it a try. Meanwhile, here is a link to the sheet in dropbox:
When I click the link there are buttons on the right which give me options to download the file. If you could test that and it works, we might be converging on a solution. RERTwiki (talk) 09:05, 22 April 2020 (UTC)
- The best graphs we've had on this article series was Mélencron's LOESS graph:

- Unfortunately they've retired now, but if we want to move on from the inline one, that's what we should be aiming for. Excel isn't appropriate for generating the sort of graph that's suitable for this page. If someone is comfortable using R and has the time to recreate Mélencron's LOESS graph then I think that would suit the article best, if there's no longer consensus for the graph that's updated inline. Ralbegen (talk) 10:52, 22 April 2020 (UTC)
- I wouldn't support a graph that cannot be edited fairly easily by others. Those graphs become a mess when Melencron left, and no-one knew how to fix them. --Comment by Selfie City (talk about my contributions) 13:19, 22 April 2020 (UTC)
- If people are file-sharing anyway, then updating a CSV and running R would be as easy as doing that for an Excel spreadsheet. It's just about getting it set up again as we don't have Melencron's files. But Excel/Numbers/Sheets aren't really cut out for this kind of graph. Ralbegen (talk) 14:22, 22 April 2020 (UTC)
- I wouldn't support a graph that cannot be edited fairly easily by others. Those graphs become a mess when Melencron left, and no-one knew how to fix them. --Comment by Selfie City (talk about my contributions) 13:19, 22 April 2020 (UTC)
Hi. A few points. The graph shown isn't the LOESS graph, it is a SMA chart. It has the problem of 'jags': multiple average values on the same date. It has another problem which is that the averages are not centred, i.e they lag the data. Centering the averages solves both problems, using the survey date also helps ( fewer polls with the same date ). The LOESS averages were used in the run-up to the last election, and were ditched because they produced completely counter-intuitive results: the element of projection seemed to give current status with, e.g. parties in obviously the wrong order.
I don't really understand the problem with Excel: its charting facilities are excellent and it is commonly in use. I'd suggest that far more people are familiar with Excel than with R. Can you explain your concerns? If you look at the example instructions and link above, you'll see that the process really couldn't be much simpler. RERTwiki (talk) 09:08, 25 April 2020 (UTC)
Can we please go back to the moving averages chart??? I personally find it much more useful since it can show you exactly where changes in public opinion start, and because all of the previous graphs for other UK opinion polling pages are moving averages. Look, even if you want to keep LOESS, at least add the moving averages as well? It can’t do any harm to have both, surely? маsтегрнатаLк 10:21, 9 June 2020 (UTC)
Proposed Merger
- The following discussion is closed. Please do not modify it. Subsequent comments should be made in a new section. A summary of the conclusions reached follows.
- The result of this discussion was Don't Merge. PinkPanda272 (talk/contribs) 11:14, 12 June 2020 (UTC)
I am proposing to merge Leadership approval opinion polling for the next United Kingdom general election into Opinion polling for the next United Kingdom general election. We are at least 4 years from the next election, and I don't think it is necessary to have two pages with similar content, and they can easily be split back out if need be nearer the time. As context, there are two opinion polling pages for the 2015 and 2019 elections, but only one for the 2017 election. Pinging @The Scandinavian Chestnut, Sofia9, Ralbegen, Mattftom, JackintheBox, and Impru20: Thanks, PinkPanda272 (talk/contribs) 07:00, 8 June 2020 (UTC)
- I do not feel strongly either way on this question, but I would have thought both articles are only going to grow (and indeed Leadership approval opinion polling for the next United Kingdom general election is already quite big), so let's keep them separate. Bondegezou (talk) 08:56, 8 June 2020 (UTC)
- Ugh no, you in the UK have already managed to keep both articles separated in a nice way and merging the two of them will only result in a single but oversized and impractical article. Also consider that both of them will only grow bigger (think that they already comprise 30kB and 40kB respectively and it's just slightly over six months since the last election. The parliamentary term can last up to five years. It's very likely each of them will reach or surpass the 100kB mark with the data of this year alone). Also, content is not "similar"; one includes electoral opinion polling whereas the other focuses on leadership opinion polling. Would be like merging the 2019 general election article with the 2019 European Parliament election article just because these two share being elections held throughout 2019. Impru20talk 09:24, 8 June 2020 (UTC)
- I don't think any of the WP:MERGEREASONs apply enough here to justify merging the pages, especially as Bondegezou and Impru20 point out, both are likely to grow. The 2017-19 articles are both enormous for a two-year term, and the 2010-15 article was so big it had to be split into five articles, including the leadership approval article, totalling more than a million bytes. One of those articles is still the 34th biggest page in the encyclopedia. I think it'd be wisest to keep them apart for now. Ralbegen (talk) 10:53, 8 June 2020 (UTC)
- Ugh no, you in the UK have already managed to keep both articles separated in a nice way and merging the two of them will only result in a single but oversized and impractical article. Also consider that both of them will only grow bigger (think that they already comprise 30kB and 40kB respectively and it's just slightly over six months since the last election. The parliamentary term can last up to five years. It's very likely each of them will reach or surpass the 100kB mark with the data of this year alone). Also, content is not "similar"; one includes electoral opinion polling whereas the other focuses on leadership opinion polling. Would be like merging the 2019 general election article with the 2019 European Parliament election article just because these two share being elections held throughout 2019. Impru20talk 09:24, 8 June 2020 (UTC)
Thanks for the responses. I will keep this discussion open for a further day or so in case others wish to contribute, but I think we have a relatively strong consensus against merging. At present there is not much linking the two articles, apart a mention in the 'see also' section. Would it make sense to add the 'leadership approval' article to the infobox, to read (for example):
It may also be an good idea for the infobox to be standardised across the recent election/opinion poll articles, as I have noticed that some pages (such as 2015) don't have a link to the next (2024) election, while this page doesn't link back as far as 2010. Thoughts? PinkPanda272 (talk/contribs) 11:50, 8 June 2020 (UTC)
- That's an interesting idea. The current infoboxes for opinion polling articles aren't really infoboxes so much as navigation aides and I wonder if something more like Template:US 2020 presidential elections series could be the solution here? Ralbegen (talk) 12:03, 8 June 2020 (UTC)
Use of Bristol Elects constituency polls
They don't seem especially less professional than other university pollsters which wikipedia cites for US articles. BPC membership is apparently the usual standard for inclusion here, but is that really necessary if we know the source is reliable and not deemed to be faking the data by other reliable sources? It's not the usual wikipedia standard for inclusion of sources.
We could instead include a key indicating whether a pollster had BPC membership or not. I think these polls add value in the absence of further evidence suggesting they *are* faking their data. - PutItOnAMap (talk) 17:51, 14 June 2020 (UTC)
- Since when is there a consensus for requiring BPC membership? I remember this requirement being rejected back in 2017 (see Talk:Opinion polling for the 2017 United Kingdom general election/Archive 4). Rami R 17:08, 14 June 2020 (UTC)
- BPC is the usual inclusion criterion; if a new BPC member publishes polls, they're included. A contested discussion for an exception, compared to quick agreement to include a BPC member, illustrates that. BPC membership requires adherence to basic rules that ensure standards and comparability. I don't understand how a Twitter account posting voting figures can possibly make the cut, whether or not a local newspaper has mentioned them. If they're conducting scientific polls that produce results that can be reasonably expected to reflect reality then they're eligible for BPC membership and should join. If they're not, then they can't merit inclusion here. Ralbegen (talk) 17:34, 14 June 2020 (UTC)
- Strictly speaking BPC membership is not a prerequisite for wikipedia polling aggregation. We've had this discussion many times and the clear consensus is that BPC is not needed. Otherwise NCP wouldn't be listed and many polls from previous elections would have to be discarded too. Boltonnews is a reputable source that wouldn't be seen conjuring results out of the ether. I am in favour of their addition to the page, *maybe* with a tag showing non-BPC membership. BrexitZZZ (talk) 16:18, 15 June 2020 (UTC)
- Local newspapers also routinely publish the results of zombie polls they conduct on their website. They, like these, do not merit inclusion. To be clear, Bolton Elects are an anonymous month-old Twitter account with fifty-four followers. They have received some coverage in a local newspaper, consisting of a press release and passing reference to other figures which aren't the supposed constituency polls being mooted for inclusion here. Ralbegen (talk) 16:52, 15 June 2020 (UTC)
- Strictly speaking BPC membership is not a prerequisite for wikipedia polling aggregation. We've had this discussion many times and the clear consensus is that BPC is not needed. Otherwise NCP wouldn't be listed and many polls from previous elections would have to be discarded too. Boltonnews is a reputable source that wouldn't be seen conjuring results out of the ether. I am in favour of their addition to the page, *maybe* with a tag showing non-BPC membership. BrexitZZZ (talk) 16:18, 15 June 2020 (UTC)
- BPC is the usual inclusion criterion; if a new BPC member publishes polls, they're included. A contested discussion for an exception, compared to quick agreement to include a BPC member, illustrates that. BPC membership requires adherence to basic rules that ensure standards and comparability. I don't understand how a Twitter account posting voting figures can possibly make the cut, whether or not a local newspaper has mentioned them. If they're conducting scientific polls that produce results that can be reasonably expected to reflect reality then they're eligible for BPC membership and should join. If they're not, then they can't merit inclusion here. Ralbegen (talk) 17:34, 14 June 2020 (UTC)
ComRes polls unsourced.
The recent SavantaComRes poll has no published tables on their website, and as a result most values are unknown. Similarly, ComRes's previous poll sends to a link that no longer exists, and no record exists of that poll other than others quoting it. Neither of the two polls have any documentation on their website and their last poll published under "Voting Intention" https://comresglobal.com/poll-category/voting-intention/ was one in February. Should the two polls be removed from the table? BrexitZZZ (talk) 14:32, 24 June 2020 (UTC)
- The May tables can still be access through the Wayback Machine here. I agree that it's odd that Savanta ComRes haven't published tables for their June poll but they are a quality polling firm and the Telegraph is fine. The tracker's results are here but it doesn't include a sample size or voting intentions for any but a few parties. Ralbegen (talk) 14:39, 24 June 2020 (UTC)
YouGov 26-28 June poll missing
Like the heading says. 2A01:E34:EE61:5F0:A180:AB10:93E9:7E40 (talk) 07:19, 15 July 2020 (UTC)