Talk:Opinion polling for the 2024 United Kingdom general election/Archive 1
| This is an archive of past discussions. Do not edit the contents of this page. If you wish to start a new discussion or revive an old one, please do so on the current talk page. |
| Archive 1 | Archive 2 | Archive 3 | → | Archive 5 |
Article's purpose
There are no opinion polls yet and the only edits seem focused on a rather weird struggle over how many regional/local results get to be included into the article. I think it is obvious that opinion polling will start coming out in shortly (hopefully), so I don't think deleting the article will prove useful at this point, but the actual issue is: What is the current purpose of the article aside of being a placeholder-in-waiting for opinion polls to come? Shouldn't it have been hold off until there was at least one opinion poll to list? Impru20talk 15:48, 23 December 2019 (UTC)
- It's going to be pretty bare for a bit. It might have been better to have kept it in draftspace until there were any polls, but there are a lot of eyes on this article series, so its premature start was probably inevitable. Ralbegen (talk) 16:33, 23 December 2019 (UTC)
- No, leave it there. And it should always be there, even before polls happen. This way, little problems can be ironed out, such as column order. What's the point of hiding it only to bring it back a few days later? Doh! And in any case pollsters are late this year. Usually, 12 days from polling day, there's been an opinion poll. Boscaswell talk 22:36, 23 December 2019 (UTC)
- Maybe you are forgotting what Wikipedia is and what it is not and the Wikipedia's notability criteria for article creation. Any other article being created before the information it intends to cover is even reported by reliable sources would be deleted outright, because it would fail the primary criterion justifying its very existence: verifiability. For us to attempt to presume when and how will opinion polls start coming out would be a violation of WP:CRYSTALBALL. The current article lacks any sources on its topic, and none can't be provided because no opinion poll has been published yet. So yes, it's premature (Doh!).
- Further, opinion polling articles exist because of WP:SPLIT, i.e. the amount of information they typically handle being too large for the main article to cover. No information excess, no separate article (much less if no information at all exists yet!). These are basic Wikipedia rules that the premature creation of this article, out of some desire for rushing it into existence, is breaching.
- I think we can be fairly sure that opinion polls will eventually come out. However, the article currently serves no purpose other than for some people to start some preparations, then for other people to remove such preparations, while they kept clashing on who's the better one at predicting the territorial scope of the opinion polls that will come out next. And I'm sorry to point out the obvious, but Wikipedia is not for this nor should we be wasting time and effort on a topic which does not exist yet. Impru20talk 23:19, 23 December 2019 (UTC)
- While it may have been better not to create the article until the time was right, what's the point in moving the article back and forth between mainspace and draftspace, requiring an administrator? Now we've got it prepared, we might as well keep it here until a poll comes out, at which time we can add the poll to the article and have no concerns over complex page moves. Why create unnecessary work for ourselves? --Comment by Selfie City (talk about my contributions) 13:13, 5 January 2020 (UTC)
- No, leave it there. And it should always be there, even before polls happen. This way, little problems can be ironed out, such as column order. What's the point of hiding it only to bring it back a few days later? Doh! And in any case pollsters are late this year. Usually, 12 days from polling day, there's been an opinion poll. Boscaswell talk 22:36, 23 December 2019 (UTC)
In case needed
I've just deleted these from the article until such time as or if we get polling for these regions. Archiving here for easy re-insertion.
London
| Pollster/client(s) | Date(s) conducted |
Sample size |
Lab | Con | Lib Dem | Green | Brexit | Other | Lead |
|---|---|---|---|---|---|---|---|---|---|
| 2019 general election | 12 Dec | 48.1% | 32% | 14.9% | 3.1% | 1.4% | 0.5% | 16.1% |
North East England
| Pollster/client(s) | Date(s) conducted |
Sample size |
Lab | Con | Brexit | Lib Dem | Green | Other | Lead |
|---|---|---|---|---|---|---|---|---|---|
| 2019 general election | 12 Dec | 42.6% | 38.3% | 7.9% | 6.8% | 2.4% | 1.9% | 4.3% |
North West England
| Pollster/client(s) | Date(s) conducted |
Sample size |
Lab | Con | Lib Dem | Brexit | Green | Other | Lead |
|---|---|---|---|---|---|---|---|---|---|
| 2019 general election | 12 Dec | 46.5% | 37.5% | 7.9% | 3.9% | 2.5% | 1.8% | 9% |
Yorkshire and the Humber
| Pollster/client(s) | Date(s) conducted |
Sample size |
Con | Lab | Lib Dem | Brexit | Green | Other | Lead |
|---|---|---|---|---|---|---|---|---|---|
| 2019 general election | 12 Dec | 43.1% | 38.9% | 8.1% | 5.9% | 2.3% | 1.8% | 4.2% |
East Midlands
| Pollster/client(s) | Date(s) conducted |
Sample size |
Con | Lab | Lib Dem | Green | Brexit | Other | Lead |
|---|---|---|---|---|---|---|---|---|---|
| 2019 general election | 12 Dec | 54.8% | 31.7% | 7.8% | 2.6% | 1.5% | 1.7% | 23.1% |
- Shelving these too, if it's okay. There aren't any Scotland/Northern Ireland/Wales polls yet either. (And as NI only has the one pollster, it'll probably be some time before we get any for there). Ralbegen (talk) 15:41, 23 December 2019 (UTC)
- Ralbegen, do you have the number of votes for each of the above, to go into the Sample size fields? Boscaswell talk 04:04, 5 January 2020 (UTC)
- I didn't write them out, sorry, I just archived the below tables here on the Talk page (after Bondegezou archived the above tables) so that they weren't sitting stranded in the mainspace. Though I note that the sample size field for the general election nationally has been removed seeing as an election is different to an opinion poll, which I suspect is the better way forward. Ralbegen (talk) 10:09, 5 January 2020 (UTC)
- That's a shame, Ralbegen. I always thought that the number of votes is useful & interesting info to have there. But I'm not about to get into a disagreement with the editor who took it out. Some editors can be more belligerently argumentative than others. ;-) Boscaswell talk 01:20, 6 January 2020 (UTC)
- I didn't write them out, sorry, I just archived the below tables here on the Talk page (after Bondegezou archived the above tables) so that they weren't sitting stranded in the mainspace. Though I note that the sample size field for the general election nationally has been removed seeing as an election is different to an opinion poll, which I suspect is the better way forward. Ralbegen (talk) 10:09, 5 January 2020 (UTC)
- Ralbegen, do you have the number of votes for each of the above, to go into the Sample size fields? Boscaswell talk 04:04, 5 January 2020 (UTC)
Scotland
| Pollster/client(s) | Date(s) conducted |
Sample size |
SNP | Con | Lab | Lib Dem | Green | Brexit | Other | Lead |
|---|---|---|---|---|---|---|---|---|---|---|
| 2019 general election | 12 Dec | 45.0% | 25.1% | 18.6% | 9.5% | 1.0% | 0.5% | 0.3% | 19.9% |
Wales
| Pollster/client(s) | Date(s) conducted |
Sample size |
Lab | Con | Plaid Cymru | Lib Dem | Brexit | Green | Other | Lead |
|---|---|---|---|---|---|---|---|---|---|---|
| 2019 general election | 12 Dec | 40.9% | 36.1% | 9.9% | 6.0% | 5.4% | 1.0% | 0.4% | 4.8% |
Northern Ireland
| Pollster/client(s) | Date(s) conducted |
Sample size |
DUP | SF | Alliance | SDLP | UUP | Aontú | Other | Lead |
|---|---|---|---|---|---|---|---|---|---|---|
| 2019 general election | 12 Dec | 30.6% | 22.8% | 16.8% | 14.9% | 11.7% | 1.2% | 2.0% | 7.8% |
Update tag
An update tag has been added to the article, but I'm not sure anything needs to be updated. As far as I'm aware, there haven't been any polls since the election. Bellowhead678 (talk) 09:28, 13 January 2020 (UTC)
- Agreed. Let's remove. Bondegezou (talk) 09:40, 13 January 2020 (UTC)
Re-order columns?
We currently have: SNP, Green, BXP, Plaid. But in previous articles we've had Plaid after the SNP, being the 2 nationalist parties, for Scotland and Wales. I feel it would be far better to have the Brexit Party last, as they will inevitably drop out altogether. Boscaswell talk 09:16, 14 December 2019 (UTC)
- PC and SNP should be together because historically some pollseters group the separatist vote. May happen again. As for the Brexit party, they could stay for the 2020 table, they have been a significant party in 2019 Jonjonjohny (talk) 09:30, 14 December 2019 (UTC)
- Support pooling SNP and PC. In any event they should be next to each other.Cutler (talk) 13:18, 14 December 2019 (UTC)
- Strongly Oppose pooling SNP and PC. Almost all pollsters now poll them separately, including those who had 'SNP+PC' lines in the past. See YouGov, Survation, BMG, ComRes, Ipsos MORI, etc... And those who don't poll PC separately pool them with 'others', NOT with the SNP. So separate data IS available, would be daft to pool it, and 'may happen again' is just about the lamest excuse for a justification. Besides they are separate entities with both its own representation in Commons. Would you pool SF and SDLP in the NI polls because both are 'separatists'? Or have a 'SNP+PC' column in the Scotland and Wales polling? This looks again like a politically motivated attempt to obfuscate by misrepresentation. JezEuansson (talk) 16:37, 23 December 2019 (UTC)
- Let's wait and see. If no opinion polls show SNP and PC together, then the columns can be separated according to their 2019 results. If some opinion polls resort to their traditional method of polling them together, then their columns should be together. Let's not reach premature conclusions before we even have the actual data. Impru20talk 23:27, 23 December 2019 (UTC)
- Strongly Oppose pooling SNP and Plaid. It’s rare for pollsters to combine them anyway. Boscaswell talk 10:36, 24 December 2019 (UTC)
- Strongly Support pooling Conservatives and Brexit Party because they are both English nationalist hardline Brexiteers. Makes just as much sense, if not more, as pooling SNP and PC because they are 'separatists'. JezEuansson (talk) 10:56, 24 December 2019 (UTC)
- Support. I agree with Boscaswell that if any of these four parties is going to be removed from the table, it is the Brexit Party, considering the party's current downward trend. The other parties you've mentioned are relatively stable in polling averages. However, I am opposed to combining any of these parties in any way, since Plaid Cymru and SNP are clearly separate parties with different goals: one is for Wales and the other is for Scotland. --Comment by Selfie City (talk about my contributions) 12:51, 24 December 2019 (UTC)
- The issue comes because some pollsters use(d) to combine SNP and PC into a single figure for both of them. That's the only purpose of them being combined, casting aside the ideological nature of some comments being posted above and which do not belong to this discussion. If pollsters do not show a joint figure for both of them any longer, the need for such a combination vanishes, obviously. Impru20talk 12:56, 24 December 2019 (UTC)
- Correct. Wales and Scotland aren't even near each other. --Comment by Selfie City (talk about my contributions) 14:42, 24 December 2019 (UTC)
- The issue comes because some pollsters use(d) to combine SNP and PC into a single figure for both of them. That's the only purpose of them being combined, casting aside the ideological nature of some comments being posted above and which do not belong to this discussion. If pollsters do not show a joint figure for both of them any longer, the need for such a combination vanishes, obviously. Impru20talk 12:56, 24 December 2019 (UTC)
Comment The opposes seem to be blurring the debate between 'pooling' the nationalists & putting the columns next to each other. They are separate topics. Given the possiblity of a pollster (even a rare one) lumping them together, not putting them next to each other, so they could be joined for that poll, seems extremely foolish. 86.175.154.209 (talk) 23:02, 1 January 2020 (UTC)
Complaint Who did approve removing Plaid Cymru from the table? Of course nobody did and it should be reinstated at once. And by the way when you vandalize at least do it right as the total for the BMG poll is now 102.5%. Daft. JezEuansson (talk) 10:09, 19 January 2020 (UTC)
Graphical Summary
Tories needs to be changed to Conservatives. There's enough space. No nicknames or colloquialisms. — Calvin999 13:27, 30 January 2020 (UTC) Fixed! DerÖsterreicher1 (talk) 22:18, 30 January 2020 (UTC)
Split Pollster/client into separate columns
I propose we split Pollster/client into separate columns, which has the significant advantage that you can sort on pollster retaining date order, to see how that pollster-sample changes over time easily (or whatever the previous sort was). Also allows sorting by client (newspaper etc) if that interests the reader. Currently sorting on the column is largely by pollster but split into client subgroups so not a continuous pollster-sample-method by time (or previous sort). This was suggested for the 2019 article but would have been a lot of work, whereas now is the easy time to make this change. Rwendland (talk) 14:12, 15 December 2019 (UTC)
- This seems sensible to me. Something like this?
| Pollster | Client(s) | Date(s) conducted |
Area | Sample size |
Con | Lab | Lib Dem | SNP | Green | Brexit | Plaid Cymru | Other | Lead |
|---|---|---|---|---|---|---|---|---|---|---|---|---|---|
| 2019 general election | 12 Dec | UK | 31,829,630 | 43.6% | 32.1% | 11.6% | 3.9% | 2.7% | 2.0% | 0.5% | 3.6% | 11.5% | |
| GB | 31,207,336 | 44.7% | 32.9% | 11.8% | 4.0% | 2.8% | 2.1% | 0.5% | 1.2% | 11.7% | |||
- Tangentially, I'd also be happy to see
Client(s)
changed toClient
andDate(s) conducted
toDates conducted
. (There are polls that only have a single day's fieldwork, but they're too rare to justify the (s), aren't they?) Ralbegen (talk) 14:46, 15 December 2019 (UTC) - Mild oppose - fewer columns the better - doesn't add any extra information - not really that interesting in any event.Cutler (talk) 19:42, 15 December 2019 (UTC)
- Maybe I'm unusual, but when different poll results are a bit erratic as during last election period, I was very interested in seeing each pollster in time order to see the direction of change for each pollster. This was on the assumption their different sampling/correction methods were affecting prediction, so seeing a single method timeline might be more reliable show change direction. Rwendland (talk) 10:15, 16 December 2019 (UTC)
- Mild Support or mostly harmless. I think it will be not really be anymore challenging for readers or editors and does allow interested readers to simply see how individual pollsters and/or clients change. ~ BOD ~ TALK 10:31, 16 December 2019 (UTC)
As the above shows support, if mild, for this suggestion (3 support, 1 oppose) I plan to implement it in a few days time, per Ralbegen version above, unless there is strong objection. Rwendland (talk) 15:56, 18 January 2020 (UTC)
- Mild Support as above. Bellowhead678 (talk) 16:24, 18 January 2020 (UTC)
- Mild oppose I don't think the client makes enough of a difference to polling to be listed as a separate column, but if it allows all polls from a specific pollsters to be ordered correctly then I'm not worried. I would prefer to have the dates listed first in the table however. Clyde1998 (talk) 17:28, 3 February 2020 (UTC)
Missing Polls
This one from Survation includes voting intention (fieldwork 31 January to 3 February). 2A01:E34:EE61:5F0:6934:E2AC:3D76:A74A (talk) 07:08, 12 February 2020 (UTC)
Graph
Following SelfieCity's suggestion, I've changed the graph from Nationwide opinion polling for the 2020 Democratic Party presidential primaries so that anyone can change the graph. Here it is with the UK names and colours but the US numbers left in to give an example of what it might look like. It should be fairly self-explanatory for others to add new polls, just add the date to the end of the list of x-values and add the Conservative score to the end of the list of y1 values, the Lab score to the end of y2 list and so on. Bellowhead678 (talk) 21:49, 15 December 2019 (UTC)
- Looks great! --Comment by Selfie City (talk about my contributions) 18:01, 23 December 2019 (UTC)
- I'd be very happy having that - does mean that no-one is having to constantly update an image file and is very clear. Also could be copied for use in the sub-national polling section or for seat estimates moving forward. Clyde1998 (talk) 05:43, 27 January 2020 (UTC)
Graph is fine, but the bar chart on the right of the chart on the article doesn't sense check: it is comparing UK election numbers with GB polling numbers, and also the averages are not the averages from the numbers in the tables. I think the bar chart should compare an average of GB polls (which most are) with the GB numbers from the election, and the arithmetic needs to be checked. Also, the coding below looks like a brute to maintain. RERTwiki (talk) 11:48, 30 January 2020 (UTC)
Agree with the comment above. Election 19 values should be the GB result, not UK. Also the way the current vote shares are calculated should be explained as it is obviously neither the arithmetic average nor the weighted average of polls in the table. JezEuansson (talk) 11:53, 30 January 2020 (UTC)
Graphical summary
| Graphs are unavailable due to technical issues. There is more info on Phabricator and on MediaWiki.org. |
- WARNING There's something seriously wrong with this graph. The SNP never had 25% support and the Brexit Party didn't die in March. Boscaswell talk 22:38, 23 December 2019 (UTC)
- As I said, I left the US values in to show what it looked like. Bellowhead678 (talk) 09:13, 24 December 2019 (UTC)
- @Bellowhead678: Should we move this into a template and then we can copy this into the article about the election itself? Also. I feel like there should be some horizontal lines in the graph. it's pretty difficult to see the percentages. if there was a horizontal line every 10% it'd be a lot easier to read the graph!--OskarsC (talk) 11:08, 18 February 2020 (UTC)
- I'd support both adding horizontal lines (although they shouldn't be too dark as it distracts from the lines) and moving it into a template. However I have no idea how to do either of those! Bellowhead678 (talk) 18:28, 18 February 2020 (UTC)
- Like this. You can edit the template by just searching in the searchbox "Template:Opinion polling for the next United Kingdom general election". Adding the horizontal and vertical lines was really easy. All you had to do was look up "Template:Graph" and there is a detailed tutorial on how to use it.--OskarsC (talk) 09:10, 23 February 2020 (UTC)
Exclusion of Bloomberg from polling averages
I noticed this reversion. I don't see why Bloomberg should be excluded. Shouldn't we keep all polls done by important pollsters for the sake of accuracy and up-to-date polling information? --Comment by Selfie City (talk about my contributions) 16:34, 28 March 2020 (UTC)
- For the sake of reliable accuracy, it has in the past been agreed that only polling organisations who are registered members of the British Polling Council (BPC) are acceptable for this article. ~ BOD ~ TALK 16:43, 28 March 2020 (UTC)
- @Bodney: I can understand that. However, I think we can agree that Bloomberg is a reliable source and should therefore be included on our list of acceptable polling organizations. However, it's something upon which a consensus needs to be established one way or the other. --Comment by Selfie City (talk about my contributions) 13:37, 29 March 2020 (UTC)
- We've included non BPC polls in the past, and for the sake of completeness I feel it's better to have too many than too little. Although I approve of the current policy, I am open to a compromise of a citation for non BPC polls if it puts the issue to bed. BrexitZZZ (talk) 13:59, 29 March 2020 (UTC)
- @Bodney: I can understand that. However, I think we can agree that Bloomberg is a reliable source and should therefore be included on our list of acceptable polling organizations. However, it's something upon which a consensus needs to be established one way or the other. --Comment by Selfie City (talk about my contributions) 13:37, 29 March 2020 (UTC)
- I accept it is not as firm a rule as I thought, mostly the rule has been about stopping additions from non RS. In contrast, I am all for allowing exceptions especially when it is origin is indeed a reliable source. Apology for its removal. ~ BOD ~ TALK 14:14, 29 March 2020 (UTC)
- Are NumberCruncher not a BPC member? We have included their polls in the past. Certainly in the run up to the 2019 election.Cutler (talk) 18:26, 29 March 2020 (UTC)
Current link to Excel file for chart
This is a link to the current version of the excel file used to create the latest version of the polling chart. The intention is to update the file and link here whenever the file changes (not for each new chart). RERTwiki (talk) 10:09, 18 May 2020 (UTC)
Proposed replacement chart
Hi. With a view to trying to reach consensus on a better chart, I thought I'd open a new section here to give the discussion a little more visibility.
The chart is based on this Excel file, available in Dropbox Chart Excel File so that anyone can download it and update the chart. Instructions for update are on the first tab in the file.
The intention is to use Excel to create a PDF file which can be used as an image in Wikipedia. I've just discovered that I seem to need a new file name each time, so the instructions need to be updated to reflect that.
This is the current chart:
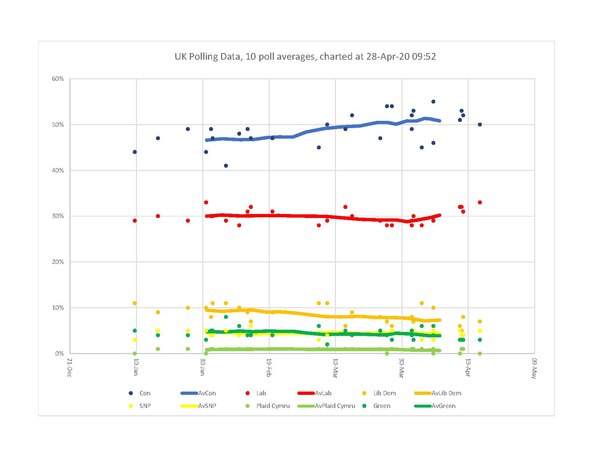
I will keep this chart up-to-date if we go with this, but clearly anyone else will be able to do so if I die or quit. Please let me know if you are happy to go ahead on this basis. RERTwiki (talk) 09:12, 28 April 2020 (UTC)
Hi. I've updated the chart to the new proposal. It's now about a week since the above with no further comment, I thought this would at least create some discussion. I've also updated the chart to use the same colour scheme as the previous chart, an made a minor update to the instructions. The excel file has thus changed, and the new file is available via this link RERTwiki (talk) 09:22, 5 May 2020 (UTC)
- Thanks for doing that, having a Dropbox file is a good suggestion. I think the average should show the average of the previous ten polls, so the date should be at the end of those ten polls, rather than being in the middle of them. Otherwise we would have averages affected by polls in the future, which doesn't make sense. It also looks a bit weird currently having the trendline only for the middle points. Finally, you can upload a new version of an image by going to its page on Wikimedia Commons and going down until you see the "Upload a new version of this file" button (at the bottom of the "File history" section). Bellowhead678 (talk) 17:55, 5 May 2020 (UTC)
- Some other formatting comments: I think it's obvious what the trendline is, so we can remove the AvCon, AvSNP etc. from the legend. We should also make the labels bigger to make them easier to read and get rid of the title (which is already covered in the description). We should also move the start and end dates so there is less white space. Bellowhead678 (talk) 17:58, 5 May 2020 (UTC)
- Hi. Just came back to update for the weekend polls, and saw your comments. Thanks very much for the tip on updating files, I'll look into that for next week. There should be no 'editing the past' with the current positioning of the average. The last 10 polls actually represent the data centred on a date in the middle of the period they cover. That date will move forward as new polls are added, never update the past. I know it is conventional to plot the moving average at the endpoint, but it is wrong. It leads to the trendline not fitting the apparent curve of the individual polls - it would lag.
- No problem making the labels bigger and reducing the white space on the time axis. I will trim the title, but would like to keep at least the date. I'm not sure about thinning the legend - those OCD as me might get twitchy. Thanks again, and next chart update will respond to these comments. RERTwiki (talk) 17:26, 11 May 2020 (UTC)
- Hi. Updated the chart and consequently file, updated link is below in new section.
- Took your advice ref file update. Fiddled with the title but didn't feel comfortable with no title or much less in it. Axis fonts are larger, average legend entries gone, less white space on the left. RHS white space is automatic, and needs to stay or else people will need to adjust the formatting for every update. Cheers,RERTwiki (talk) 10:09, 18 May 2020 (UTC)
- To me the graph appears to have low quality (I'm sure there's a better name, but I've forgotten it). Should it perhaps be saved as a .svg file so that it looks clearer? --Comment by Selfie City (talk about my contributions) 13:32, 18 May 2020 (UTC)
I've together a graph that's more like Melencron's LOESS version, if there's any interest in that. I prefer its appearance: unlike Excel charts, we can have lines covering the entire polled period. The x-axis for a time series is clearer to follow with breaks at the start of months, rather than at days Excel chooses. The LOESS curves are smooth and seem sensible to me, though it's not difficult to change to another curve if they produce counterintuitive results at some point in the future.
.png)
Would there be any support for using this graph format (or something like it) on the page? Ralbegen (talk) 17:55, 18 May 2020 (UTC)
- Could it be edited as easily as the current graph? --Comment by Selfie City (talk about my contributions) 18:40, 20 May 2020 (UTC)
- Absolutely: I can put the R code and .csv as subpages on here or my userpage, so there's no need to go off-wiki. You can run the code online or download R for free, and users don't need to understand the code to run it, they just update the numbers and dates in the .csv and follow simple instructions. Ralbegen (talk) 18:55, 20 May 2020 (UTC)
- Great! Then this seems like an improvement due to the quality of the image. --Comment by Selfie City (talk about my contributions) 21:04, 20 May 2020 (UTC)
- I agree that this image is an improvement - would just suggest increasing the font size of the axis labels (so that mobile users don't have to zoom in/squint to read them) and changing the background from grey to white. Having a shared page with code that can be used by any editor is an excellent suggestion. Bellowhead678 (talk) 22:40, 23 May 2020 (UTC)
- Great! Then this seems like an improvement due to the quality of the image. --Comment by Selfie City (talk about my contributions) 21:04, 20 May 2020 (UTC)
- Absolutely: I can put the R code and .csv as subpages on here or my userpage, so there's no need to go off-wiki. You can run the code online or download R for free, and users don't need to understand the code to run it, they just update the numbers and dates in the .csv and follow simple instructions. Ralbegen (talk) 18:55, 20 May 2020 (UTC)
- Would it also be possible to use this chart for other elections and polls?--BSMIsEditing (talk) 13:10, 23 May 2020 (UTC)
- Thanks for the feedback! @Bellowhead678: I definitely agree that the text is too small relative to the rest of the chart. At your prompt I've tried changing the background colour to white, but that seems to make the breaks more obtrusive. I personally prefer the grey background with white breaks but I'm certainly open to further discussion on that. @BSMIsEditing: Yes, this kind of chart can be generally applied. There are already graphs that use the same kind of smoothing on pages like 2021 Senedd election. When I finalise my code and share guidance on updating it I can try to including some material on how to apply it more generally to put together similar charts for other elections, if that's something that'd be helpful?
- On the basis of this discussion, I feel confident that there's some consensus to include this type of graph on the page. I'll implement an updated version of it, and then post my code with some explanatory notes on a subpage of my userpage at some point later this week. (There are still some changes I'd like to make to the code to make it easier for others to update). Happy to hear any feedback or dissenting views! Ralbegen (talk) 21:56, 24 May 2020 (UTC)
- Would it also be possible to use this chart for other elections and polls?--BSMIsEditing (talk) 13:10, 23 May 2020 (UTC)
- The formatting is a matter of taste, but I think the new chart looks good, and the addition of the election result is welcome.
- Two points though - we know the LOESS smoothing has been misleading in the past in similar circumstances, and is therefore likely to be again in future. Consequently I would urge the use of a centred moving average for the average line now, rather than scramble to replace the LOESS curve when it goes pear-shaped. Among other things, the LOESS line has the 'edit the past' property that new data points are likely to move today's averages around, which is distasteful. A centred moving average makes the lag in the averages clear. I also believe that moving average weighted by sample size is a better average.
- Could we have a link to the explanatory notes put in here? RERTwiki (talk) 08:51, 25 May 2020 (UTC)
- Hi @RERTwiki:, thanks for the feedback. I'm really glad you like the format of the chart.
- LOESS lines are used on a number other graphs of opinion results on articles on Wikipedia, and if you recall, when LOESS curves were discussed before, Melelncron clarified that the change in the curve was because of a parameter change rather than the addition of a new poll. The addition of a new poll has a minimal impact on the past curve, and as a majority of editors (including me) in that discussion pointed out, it's more useful to know where polling was based on all the information we know now rather than based only on the information we knew at each particular point. The issue of LOESS curves listing parties in a different order than reflected by polls at large is a possibility, but I think it's overstated. When LOESS was implemented last time it was around the time of the 2019 European Parliament election, when UK general election polls were behaving in exactly the way that would cause that issue (with the relevant discussion here. In any case, I believe it's something that would have been resolved once later polls were included.
- By comparison, simple moving averages create very noisy curves that (in my view) obfuscate rather than illuminate the actual trends in opinion polling. I am of the view that LOESS curves remain the most suitable option. (There's a version of LOESS called compositional LOESS that's designed for opinion polls in particular presented here but that paper's beyond me. If anyone can implement that in R then that method would be my preference.)
- Finally, yes, I will definitely share a link to my notes here once I've finalised them. There are a few more things I'd like to sort out in the code before I do that though, in order to make it as straightforward as possible for other users to update it. Ralbegen (talk) 11:34, 25 May 2020 (UTC)
- Could we have a link to the explanatory notes put in here? RERTwiki (talk) 08:51, 25 May 2020 (UTC)
@Ralbegen: Is there any updates on the source code used in the graph?
.svg)
- Thanks for that, might make sense to replace the section below with the link to the previous chart with your info.
- Yes, the 2019 polling was the occasion where LOESS broke down which I was referring to. These data are politically sensitive, and it is not sufficient to say that future polling would (might have) corrected the situation. People will (did) immediately become annoyed that things which they cared a lot about were being mis-represented. I agree this was an extreme circumstance, but I really don't think it is worth the risk to include a LOESS line up to the current date which is almost certain to be corrected, albeit usually only slightly.
- One reason the moving averages have given noisy curves in the past is the way they have been constructed. Plotting averages against publication date creates situations where there are often multiple values for a given day. This creates 'jags'. If instead you plot against the weighted average sample date-time, there are very rarely multiple values for a given time, and the data is much smoother. Thus I think the sample-weighted moving average of polls plotted against the sample weighted moving average of sample dates produces smooth (enough) curves, correctly represents the timing of the average, gives a value which is fixed for all time, and is very simple for the reader to understand. I think it's better for those reasons. I still have misgivings concerning the possible double-entry of data into a CSV file and the table in the article, which is an obvious source of potential errors, but I guess your instructions will shed more light on that.
- All that said if you are intending to keep the chart up to date, it's certainly a big improvement on where we were a few weeks ago, and I'd be pleased to see you do that.RERTwiki (talk) 11:15, 26 May 2020 (UTC)
Redfield & Wilton Strategies subnational polling
I have noticed that on the R&WS website that there is a section for different regions of the UK, which may potentially be a source for subnational polling. But Wales will most likely be excluded as there seems to be an error as it displays the SNP there. — Preceding unsigned comment added by BSMIsEditing (talk • contribs) 18:42, 30 April 2020 (UTC)
- BSMIsEditing - The sample size for the regions in national polling is generally too small to be of any use (often below 100 for the smaller regions), and often isn't weighted by age, gender, social class etc, as the national sample is. PinkPanda272 (talk/contribs) 07:00, 8 June 2020 (UTC)