This article includes a list of references, related reading, or external links, but its sources remain unclear because it lacks inline citations. (March 2013) |
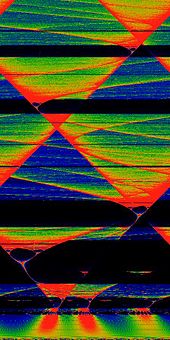
In mathematics, particularly in dynamical systems, a bifurcation diagram shows the values visited or approached asymptotically (fixed points, periodic orbits, or chaotic attractors) of a system as a function of a bifurcation parameter in the system.[citation needed] It is usual to represent stable values with a solid line and unstable values with a dotted line, although often the unstable points are omitted. Bifurcation diagrams enable the visualization of bifurcation theory. In the context of discrete-time dynamical systems, the diagram is also called orbit diagram.


Logistic map
editAn example is the bifurcation diagram of the logistic map:
The bifurcation parameter r is shown on the horizontal axis of the plot and the vertical axis shows the set of values of the logistic function visited asymptotically from almost all initial conditions.
The bifurcation diagram shows the forking of the periods of stable orbits from 1 to 2 to 4 to 8 etc. Each of these bifurcation points is a period-doubling bifurcation. The ratio of the lengths of successive intervals between values of r for which bifurcation occurs converges to the first Feigenbaum constant.
The diagram also shows period doublings from 3 to 6 to 12 etc., from 5 to 10 to 20 etc., and so forth.
Symmetry breaking in bifurcation sets
editIn a dynamical system such as which is structurally stable when , if a bifurcation diagram is plotted, treating as the bifurcation parameter, but for different values of , the case is the symmetric pitchfork bifurcation. When , we say we have a pitchfork with broken symmetry. This is illustrated in the animation on the right.
Applications
editConsider a system of differential equations that describes some physical quantity, that for concreteness could represent one of three examples: 1. the position and velocity of an undamped and frictionless pendulum, 2. a neuron's membrane potential over time, and 3. the average concentration of a virus in a patient's bloodstream. The differential equations for these examples include *parameters* that may affect the output of the equations. Changing the pendulum's mass and length will affect its oscillation frequency, changing the magnitude of injected current into a neuron may transition the membrane potential from resting to spiking, and the long-term viral load in the bloodstream may decrease with carefully timed treatments.
In general, researchers may seek to quantify how the long-term (asymptotic) behavior of a system of differential equations changes if a parameter is changed. In the dynamical systems branch of mathematics, a bifurcation diagram quantifies these changes by showing how fixed points, periodic orbits, or chaotic attractors of a system change as a function of bifurcation parameter. Bifurcation diagrams are used to visualize these changes.
See also
editFurther reading
edit- Glendinning, Paul (1994). Stability, Instability and Chaos. Cambridge University Press. ISBN 0-521-41553-5.
- May, Robert M. (1976). "Simple mathematical models with very complicated dynamics". Nature. 261 (5560): 459–467. Bibcode:1976Natur.261..459M. doi:10.1038/261459a0. hdl:10338.dmlcz/104555. PMID 934280. S2CID 2243371.
- Strogatz, Steven (2000). Non-linear Dynamics and Chaos: With applications to Physics, Biology, Chemistry and Engineering. Perseus Books. ISBN 0-7382-0453-6.
External links
edit- The Logistic Map and Chaos by Elmer G. Wiens, egwald.ca
- Wikiversity: Discrete-time dynamical system orbit diagram