Northumberland County Council elections
(Redirected from Northumberland local elections)
This article needs additional citations for verification. (June 2018) |
Northumberland County Council elections are held every four years. Northumberland County Council is the local authority for the unitary authority of Northumberland in England. Since the last boundary changes in 2013, 67 councillors have been elected from 66 wards.[1]
Council elections
edit- 1973 Northumberland County Council election
- 1977 Northumberland County Council election
- 1981 Northumberland County Council election
- 1985 Northumberland County Council election
- 1989 Northumberland County Council election
- 1993 Northumberland County Council election
- 1997 Northumberland County Council election
- 2001 Northumberland County Council election
- 2005 Northumberland County Council election
- 2008 Northumberland County Council election
- 2013 Northumberland County Council election
- 2017 Northumberland County Council election
- 2021 Northumberland County Council election
Council composition
edit| Year | Conservative | Labour | Liberal Democrats | Liberal | Green | Independent | Control |
|---|---|---|---|---|---|---|---|
| 1973 | 10 | 28 | - | 3 | - | 21 | No overall control |
| 1977 | 20 | 21 | - | 0 | - | 21[a] | No overall control |
| 1981 | 14 | 34 | - | 15 | - | 3 | Labour |
| 1985 | 12 | 30 | - | 20 | - | 4[b] | No overall control |
| 1989 | 17 | 38 | 8 | - | - | 3 | Labour |
| 1993 | 13 | 39 | 11 | - | 0 | 5 | Labour |
| 1997 | 13 | 43 | 8 | - | 0 | 2 | Labour |
| 2001 | 17 | 38 | 9 | - | 0 | 3 | Labour |
| 2005 | 14 | 35 | 14 | - | 0 | 4 | Labour |
| 2008 | 17 | 17 | 26 | - | 0 | 7 | No overall control |
| 2013 | 21 | 32 | 11 | - | 0 | 3 | No overall control |
| 2017 | 33 | 24 | 3 | - | 0 | 7 | No overall control |
| 2021 | 34 | 21 | 3 | - | 2 | 7 | Conservative |
County result maps
edit-
 1981 results map
 -
 1985 results map
 -
 1989 results map
 -
 1993 results map
 -
 1997 results map
 -
 2001 results map
 -
 2005 results map
 -
 2008 results map
 -
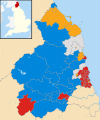
 2013 results map
 -
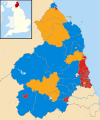
 2017 results map
 -
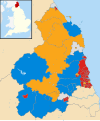
 2021 results map


By-election results
edit1997-2001
edit| Party | Candidate | Votes | % | ±% | |
|---|---|---|---|---|---|
| Conservative | 546 | 35.8 | +0.5 | ||
| Liberal Democrats | 420 | 27.5 | −9.6 | ||
| Labour | 307 | 20.1 | −7.5 | ||
| Independent | 253 | 16.8 | +16.8 | ||
| Majority | 126 | 8.3 | |||
| Turnout | 1,526 | ||||
| Conservative gain from Liberal Democrats | Swing | ||||
| Party | Candidate | Votes | % | ±% | |
|---|---|---|---|---|---|
| Liberal Democrats | 720 | 58.7 | +58.7 | ||
| Labour | 483 | 39.4 | −39.8 | ||
| Conservative | 23 | 1.9 | −18.9 | ||
| Majority | 237 | 19.3 | |||
| Turnout | 1,226 | ||||
| Liberal Democrats gain from Labour | Swing | ||||
| Party | Candidate | Votes | % | ±% | |
|---|---|---|---|---|---|
| Labour | 574 | 58.0 | −21.3 | ||
| Liberal Democrats | 391 | 39.5 | +18.8 | ||
| Conservative | 24 | 2.4 | +2.4 | ||
| Majority | 183 | 18.5 | |||
| Turnout | 989 | 30.0 | |||
| Labour hold | Swing | ||||
2005-2008
edit| Party | Candidate | Votes | % | ±% | |
|---|---|---|---|---|---|
| Liberal Democrats | Leslie Cassie | 473 | 40.7 | +0.3 | |
| Conservative | David Bawn | 304 | 26.2 | +3.8 | |
| Green | Nicholas Best | 154 | 13.3 | −3.0 | |
| Labour | Ian Fleming | 144 | 12.4 | −8.5 | |
| Independent | John Beynon | 87 | 7.5 | +7.5 | |
| Majority | 169 | 14.5 | −3.5 | ||
| Turnout | 1,162 | 33.9 | −34.0 | ||
| Liberal Democrats hold | Swing | ||||
| Party | Candidate | Votes | % | ±% | |
|---|---|---|---|---|---|
| Labour | 841 | 67.2 | +3.0 | ||
| Liberal Democrats | 411 | 32.8 | +6.3 | ||
| Majority | 430 | 34.4 | |||
| Turnout | 1,252 | ||||
| Labour hold | Swing | ||||
2008-2013
edit| Party | Candidate | Votes | % | ±% | |
|---|---|---|---|---|---|
| Conservative | Eileen Armstrong | 843 | 62.6 | +2.0 | |
| Liberal Democrats | Andrew Duffield | 403 | 29.9 | +1.6 | |
| Labour | Andrew Avery | 100 | 7.4 | +2.9 | |
| Majority | 440 | 32.7 | |||
| Turnout | 1,346 | ||||
| Conservative hold | Swing | ||||
2013-2017
edit| Party | Candidate | Votes | % | ±% | |
|---|---|---|---|---|---|
| Liberal Democrats | Kate Cairns | 742 | 49.6 | +49.6 | |
| Conservative | John Hope | 352 | 23.5 | +0.7 | |
| Independent | Wendy Pattison | 208 | 13.9 | +13.9 | |
| UKIP | Michael Weatheritt | 146 | 9.8 | −3.1 | |
| Labour | Nicola Morrison | 48 | 3.2 | +3.2 | |
| Majority | 390 | 26.1 | |||
| Turnout | 1,496 | ||||
| Liberal Democrats gain from Independent | Swing | ||||
| Party | Candidate | Votes | % | ±% | |
|---|---|---|---|---|---|
| Labour | Mark Purvis | 508 | 69.5 | −21.2 | |
| UKIP | Peter Curtis | 102 | 14.0 | +14.0 | |
| Liberal Democrats | Andy McGregor | 82 | 11.2 | +11.2 | |
| Conservative | Chris Galley | 39 | 5.3 | −4.0 | |
| Majority | 406 | 55.5 | |||
| Turnout | 731 | ||||
| Labour hold | Swing | ||||
| Party | Candidate | Votes | % | ±% | |
|---|---|---|---|---|---|
| Independent | Derek Kennedy | 501 | 36.6 | +36.6 | |
| Conservative | Tom Gillanders | 454 | 33.2 | −15.1 | |
| Labour | Nuala Rose | 200 | 14.6 | −0.3 | |
| Independent | Anne Pickering | 125 | 9.1 | +9.1 | |
| Green | Lee Williscroft-Ferris | 89 | 6.5 | +6.5 | |
| Majority | 47 | 3.4 | |||
| Turnout | 1,369 | ||||
| Independent gain from Conservative | Swing | ||||
2017-2021
edit| Party | Candidate | Votes | % | ±% | |
|---|---|---|---|---|---|
| Labour | Leslie Bowman | 916 | 57.6 | +7.4 | |
| Conservative | Maureen Levy | 510 | 32.1 | −7.2 | |
| Liberal Democrats | Anita Romer | 164 | 10.3 | +10.3 | |
| Majority | 406 | 25.5 | |||
| Turnout | 1,590 | ||||
| Labour hold | Swing | ||||
2021-2025
edit| Party | Candidate | Votes | % | ±% | |
|---|---|---|---|---|---|
| Liberal Democrats | Suzanne Fairless-Aitken | 584 | 47.3 | +11.8 | |
| Conservative | Stephen Ball | 370 | 30.0 | −13.8 | |
| Labour | Jonathan Wheeler | 154 | 12.5 | −8.1 | |
| Independent | Lee Williscroft-Ferris | 127 | 10.3 | +10.3 | |
| Majority | 214 | 17.3 | |||
| Turnout | 1,235 | ||||
| Liberal Democrats gain from Conservative | Swing | ||||
| Party | Candidate | Votes | % | ±% | |
|---|---|---|---|---|---|
| Conservative | Eve Chicken | 702 | 55.6 | +1.1 | |
| Labour | Christine Savage | 511 | 40.5 | −5.0 | |
| Green | Clive Robson | 29 | 2.3 | +2.3 | |
| Liberal Democrats | Alisdair Gibbs-Barton | 21 | 1.7 | +1.7 | |
| Majority | 191 | 15.1 | |||
| Turnout | 1,263 | ||||
| Conservative hold | Swing | ||||
References
edit- ^ "The Northumberland (Electoral Changes) Order 2011", legislation.gov.uk, The National Archives, SI 2011/2, retrieved 15 August 2022
- ^ "Local Elections Archive Project — Choppington Division". www.andrewteale.me.uk. Retrieved 25 January 2024.
- ^ "Local Elections Archive Project — Ponteland East Ward". www.andrewteale.me.uk. Retrieved 25 January 2024.
- ^ "Local Elections Archive Project — Longhoughton Ward". www.andrewteale.me.uk. Retrieved 25 January 2024.
- ^ "Local Elections Archive Project — College Ward". www.andrewteale.me.uk. Retrieved 25 January 2024.
- ^ "Local Elections Archive Project — Hexham West Ward". www.andrewteale.me.uk. Retrieved 25 January 2024.
- ^ "Local Elections Archive Project — Holywell Ward". www.andrewteale.me.uk. Retrieved 25 January 2024.
- ^ "Local Elections Archive Project — Hexham East Ward". www.andrewteale.me.uk. Retrieved 25 January 2024.
- ^ "Local Elections Archive Project — Seghill with Seaton Delaval Ward". www.andrewteale.me.uk. Retrieved 25 January 2024.