Victoria is the southernmost mainland state of Australia. With an area of 227,444 km2 (87,817 sq mi), it is Australia's sixth largest state/territory, comparable in size to the island of Great Britain or the U.S. state of Utah. It is bound to the northwest by South Australia, directly north by New South Wales, and also shares a maritime border with Tasmania across the Bass Strait to the south. Most of Victoria's northern border lies along the Murray River. The eastern half of the state is dominated by the Australian Alps and the surrounding highlands (plateaus and hills) of the Great Dividing Range, which also to a lesser extent extend far into the west of the state and ease off after The Grampians. By comparison the north and northwest of the state is extremely flat with little prominence.
 | |
| Continent | Australia |
|---|---|
| Region | Southeast Australia |
| Coordinates | 37°31′S 149°58′E / 37.51°S 149.97°E — 33°58′S 140°58′E / 33.97°S 140.96°E |
| Area | Ranked 6th among states and territories |
| • Total | 227,444[2] km2 (87,817 sq mi) |
| Borders | Land borders: New South Wales, South Australia. Maritime Borders: Tasmania |
| Highest point | Mount Bogong 1,986 m (6,516 ft) |
| Lowest point | Bass Strait sea level |
| Longest river | Goulburn River 654 km (406 mi) |
| Largest lake | Gippsland Lakes 600 km² (373 sq mi) |
Approximately 80% of Victoria's population lives around the coasts of the Port Phillip Bay and (to a lesser extent) Western Port Bay in the south-central region, chiefly in the state's two largest cities, Melbourne (state capital) and Geelong.
Climate edit

| Month | Melbourne °C (°F) |
Mildura °C (°F) | ||
|---|---|---|---|---|
| January | 25.8 (78) | 32.8 (91) | ||
| February | 25.8 (78) | 32.7 (91) | ||
| March | 23.8 (75) | 29.3 (85) | ||
| April | 20.2 (68) | 24.1 (75) | ||
| May | 16.6 (62) | 19.6 (67) | ||
| June | 14.0 (57) | 16.0 (61) | ||
| July | 13.4 (56) | 15.4 (60) | ||
| August | 14.9 (59) | 17.7 (64) | ||
| September | 17.2 (63) | 21.1 (70) | ||
| October | 19.6 (67) | 25.0 (77) | ||
| November | 21.8 (71) | 29.0 (84) | ||
| December | 24.1 (75) | 31.7 (89) | ||
| Source: Bureau of Meteorology | ||||
Victoria has a varied climate despite its small size. It ranges from semi-arid temperate with hot summers in the north-west, to temperate and cool along the coast. Victoria's main land feature, the Great Dividing Range, produces a cooler, mountain climate in the centre of the state. Winters along the coast of the state, particularly around Melbourne, are relatively mild (see chart at right).
The coastal plain south of the Great Dividing Range has Victoria's mildest climate. Air from the Southern Ocean helps reduce the heat of summer and the cold of winter. Melbourne and other large cities are located in this temperate region.
The Mallee and upper Wimmera are Victoria's warmest regions with hot winds blowing from nearby semi-deserts. Average temperatures exceed 32 °C (90 °F) during summer and 15 °C (59 °F) in winter. Except at cool mountain elevations, the inland monthly temperatures are 2–7 °C (4–13 °F) warmer than around Melbourne (see chart). Victoria's highest maximum temperature of 48.8 °C (119.8 °F) was recorded in Hopetoun on 7 February 2009, during the 2009 southeastern Australia heat wave.[3]
The Victorian Alps in the northeast are the coldest part of Victoria. The Alps are part of the Great Dividing Range mountain system extending east–west through the centre of Victoria. Average temperatures are less than 9 °C (48 °F) in winter and below 0 °C (32 °F) in the highest parts of the ranges. The state's lowest minimum temperature of −11.7 °C (10.9 °F) was recorded at Omeo on 15 June 1965, and again at Falls Creek on 3 July 1970.[3]
Rainfall edit
Rainfall in Victoria increases from south to the northeast, with higher averages in areas of high altitude. Mean annual rainfall exceeds 1,800 millimetres (71 inches) in some parts of the northeast but is less than 280 mm (11 in) in the Mallee.
Rain is heaviest in the Otway Ranges and Gippsland in southern Victoria and in the mountainous northeast. Snow generally falls only in the mountains and hills in the centre of the state. Rain falls most frequently in winter, but summer precipitation is heavier. Rainfall is most reliable in Gippsland and the Western District, making them both leading farming areas. Victoria's highest recorded daily rainfall was 377.8 mm (14.87 in) at Tidal River in Wilsons Promontory National Park on 23 March 2011.[3]
- Average temperatures and precipitation for Victoria
-
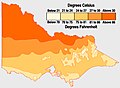 Average January maximum temperatures:
Victoria's north is almost always hotter than coastal and mountainous areas. -
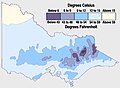 Average July maximum temperatures:
Victoria's hills and ranges are coolest during winter. Snow also falls there. -
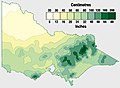 Average yearly precipitation:
Victoria's rainfall is concentrated in the mountainous north-east and coast.


Weatherboxes edit
| Climate data for Victoria (Extremes) | |||||||||||||
|---|---|---|---|---|---|---|---|---|---|---|---|---|---|
| Month | Jan | Feb | Mar | Apr | May | Jun | Jul | Aug | Sep | Oct | Nov | Dec | Year |
| Record high °C (°F) | 47.2 (117.0) |
48.8 (119.8) |
44.4 (111.9) |
39.3 (102.7) |
32.2 (90.0) |
25.7 (78.3) |
27.1 (80.8) |
29.9 (85.8) |
37.7 (99.9) |
40.2 (104.4) |
45.8 (114.4) |
46.6 (115.9) |
48.8 (119.8) |
| Record low °C (°F) | −3.9 (25.0) |
−3.9 (25.0) |
−4.3 (24.3) |
−8.2 (17.2) |
−8.3 (17.1) |
−11.7 (10.9) |
−11.7 (10.9) |
−10.5 (13.1) |
−9.4 (15.1) |
−8.4 (16.9) |
−6.8 (19.8) |
−5.2 (22.6) |
−11.7 (10.9) |
| Source: Bureau of Meteorology[4] | |||||||||||||
| Climate data for Melbourne (Köppen Cfb) | |||||||||||||
|---|---|---|---|---|---|---|---|---|---|---|---|---|---|
| Month | Jan | Feb | Mar | Apr | May | Jun | Jul | Aug | Sep | Oct | Nov | Dec | Year |
| Record high °C (°F) | 46.0 (114.8) |
46.8 (116.2) |
40.8 (105.4) |
34.5 (94.1) |
27.0 (80.6) |
21.8 (71.2) |
21.3 (70.3) |
24.6 (76.3) |
30.2 (86.4) |
36.0 (96.8) |
41.6 (106.9) |
44.6 (112.3) |
46.8 (116.2) |
| Mean daily maximum °C (°F) | 27.0 (80.6) |
26.7 (80.1) |
24.4 (75.9) |
20.6 (69.1) |
16.7 (62.1) |
14.0 (57.2) |
13.4 (56.1) |
14.7 (58.5) |
17.1 (62.8) |
20.0 (68.0) |
22.6 (72.7) |
24.8 (76.6) |
20.2 (68.3) |
| Daily mean °C (°F) | 20.6 (69.1) |
20.6 (69.1) |
18.6 (65.5) |
15.4 (59.7) |
12.5 (54.5) |
10.2 (50.4) |
9.6 (49.3) |
10.4 (50.7) |
12.1 (53.8) |
14.3 (57.7) |
16.6 (61.9) |
18.5 (65.3) |
14.9 (58.8) |
| Mean daily minimum °C (°F) | 14.2 (57.6) |
14.4 (57.9) |
12.8 (55.0) |
10.1 (50.2) |
8.3 (46.9) |
6.4 (43.5) |
5.8 (42.4) |
6.0 (42.8) |
7.2 (45.0) |
8.7 (47.7) |
10.6 (51.1) |
12.3 (54.1) |
9.7 (49.5) |
| Record low °C (°F) | 6.0 (42.8) |
4.8 (40.6) |
3.7 (38.7) |
1.2 (34.2) |
0.6 (33.1) |
−0.9 (30.4) |
−2.5 (27.5) |
−2.5 (27.5) |
−1.1 (30.0) |
1.0 (33.8) |
0.9 (33.6) |
3.5 (38.3) |
−2.5 (27.5) |
| Average precipitation mm (inches) | 39.3 (1.55) |
41.4 (1.63) |
37.5 (1.48) |
42.1 (1.66) |
34.3 (1.35) |
41.5 (1.63) |
32.8 (1.29) |
39.3 (1.55) |
46.1 (1.81) |
48.5 (1.91) |
60.1 (2.37) |
52.5 (2.07) |
515.5 (20.30) |
| Average precipitation days (≥ 0.2 mm) | 8.3 | 7.5 | 8.4 | 9.9 | 12.0 | 13.0 | 14.0 | 14.8 | 13.9 | 12.5 | 10.8 | 9.9 | 135.0 |
| Average afternoon relative humidity (%) | 44 | 45 | 46 | 50 | 59 | 65 | 63 | 57 | 53 | 49 | 47 | 45 | 52 |
| Mean monthly sunshine hours | 272.8 | 231.7 | 226.3 | 183.0 | 142.6 | 120.0 | 136.4 | 167.4 | 186.0 | 226.3 | 225.0 | 263.5 | 2,381 |
| Percent possible sunshine | 61 | 61 | 59 | 56 | 46 | 43 | 45 | 51 | 52 | 56 | 53 | 58 | 53 |
| Source: Australian Bureau of Meteorology[5] | |||||||||||||
| Climate data for Geelong (Köppen Cfb) | |||||||||||||
|---|---|---|---|---|---|---|---|---|---|---|---|---|---|
| Month | Jan | Feb | Mar | Apr | May | Jun | Jul | Aug | Sep | Oct | Nov | Dec | Year |
| Record high °C (°F) | 46.3 (115.3) |
47.9 (118.2) |
42.0 (107.6) |
36.1 (97.0) |
28.0 (82.4) |
23.6 (74.5) |
22.5 (72.5) |
25.9 (78.6) |
31.3 (88.3) |
37.8 (100.0) |
41.8 (107.2) |
45.8 (114.4) |
47.9 (118.2) |
| Mean daily maximum °C (°F) | 26.6 (79.9) |
26.2 (79.2) |
24.4 (75.9) |
20.5 (68.9) |
17.3 (63.1) |
14.7 (58.5) |
14.2 (57.6) |
15.4 (59.7) |
17.8 (64.0) |
20.3 (68.5) |
22.6 (72.7) |
24.5 (76.1) |
20.4 (68.7) |
| Mean daily minimum °C (°F) | 14.2 (57.6) |
14.5 (58.1) |
12.6 (54.7) |
9.7 (49.5) |
7.7 (45.9) |
5.7 (42.3) |
5.2 (41.4) |
5.5 (41.9) |
6.7 (44.1) |
8.1 (46.6) |
10.6 (51.1) |
11.9 (53.4) |
9.4 (48.9) |
| Record low °C (°F) | 4.5 (40.1) |
6.8 (44.2) |
2.9 (37.2) |
0.6 (33.1) |
−1.3 (29.7) |
−2.9 (26.8) |
−4.0 (24.8) |
−4.4 (24.1) |
−1.7 (28.9) |
0.1 (32.2) |
2.6 (36.7) |
4.8 (40.6) |
−4.4 (24.1) |
| Average rainfall mm (inches) | 31.1 (1.22) |
35.0 (1.38) |
24.8 (0.98) |
39.8 (1.57) |
32.4 (1.28) |
40.5 (1.59) |
36.1 (1.42) |
38.3 (1.51) |
40.2 (1.58) |
40.9 (1.61) |
50.7 (2.00) |
28.5 (1.12) |
439.2 (17.29) |
| Average rainy days (≥ 0.2 mm) | 6.0 | 5.7 | 6.7 | 9.7 | 11.9 | 13.8 | 15.4 | 15.2 | 13.6 | 12.0 | 9.9 | 8.5 | 128.4 |
| Average afternoon relative humidity (%) | 50 | 49 | 49 | 56 | 64 | 68 | 66 | 62 | 58 | 53 | 54 | 53 | 57 |
| Source 1: Bureau of Meteorology, Avalon Airport (1991–2020)[6] | |||||||||||||
| Source 2: Bureau of Meteorology, Avalon Airport (all years)[7] | |||||||||||||
| Climate data for Mildura (Köppen BSk) | |||||||||||||
|---|---|---|---|---|---|---|---|---|---|---|---|---|---|
| Month | Jan | Feb | Mar | Apr | May | Jun | Jul | Aug | Sep | Oct | Nov | Dec | Year |
| Record high °C (°F) | 46.9 (116.4) |
46.7 (116.1) |
42.1 (107.8) |
37.8 (100.0) |
29.6 (85.3) |
25.4 (77.7) |
26.8 (80.2) |
29.9 (85.8) |
37.4 (99.3) |
40.2 (104.4) |
45.5 (113.9) |
46.8 (116.2) |
46.9 (116.4) |
| Mean daily maximum °C (°F) | 32.3 (90.1) |
31.7 (89.1) |
28.4 (83.1) |
23.6 (74.5) |
19.1 (66.4) |
16.0 (60.8) |
15.4 (59.7) |
17.3 (63.1) |
20.5 (68.9) |
24.1 (75.4) |
27.6 (81.7) |
30.3 (86.5) |
23.9 (74.9) |
| Mean daily minimum °C (°F) | 16.7 (62.1) |
16.5 (61.7) |
13.9 (57.0) |
10.1 (50.2) |
7.5 (45.5) |
5.2 (41.4) |
4.3 (39.7) |
5.3 (41.5) |
7.4 (45.3) |
9.8 (49.6) |
12.6 (54.7) |
14.9 (58.8) |
10.4 (50.6) |
| Record low °C (°F) | 7.6 (45.7) |
5.2 (41.4) |
3.8 (38.8) |
0.6 (33.1) |
−2.1 (28.2) |
−3.7 (25.3) |
−4.0 (24.8) |
−3.1 (26.4) |
−1.1 (30.0) |
1.1 (34.0) |
3.3 (37.9) |
5.3 (41.5) |
−4.0 (24.8) |
| Average precipitation mm (inches) | 22.6 (0.89) |
22.4 (0.88) |
20.0 (0.79) |
19.3 (0.76) |
25.2 (0.99) |
22.4 (0.88) |
25.5 (1.00) |
25.5 (1.00) |
27.5 (1.08) |
28.9 (1.14) |
25.7 (1.01) |
25.3 (1.00) |
289.6 (11.40) |
| Average rainy days | 3.6 | 3.0 | 3.5 | 4.3 | 6.7 | 7.9 | 9.3 | 9.0 | 7.3 | 6.7 | 5.6 | 4.4 | 71.3 |
| Average afternoon relative humidity (%) | 27 | 30 | 33 | 40 | 50 | 56 | 54 | 47 | 40 | 34 | 30 | 27 | 39 |
| Mean monthly sunshine hours | 341.0 | 288.4 | 297.6 | 255.0 | 204.6 | 168.0 | 182.9 | 222.0 | 254.2 | 291.4 | 297.0 | 331.7 | 3,133.8 |
| Source: [8] | |||||||||||||
| Climate data for Falls Creek (Köppen Dfc/Dfb) | |||||||||||||
|---|---|---|---|---|---|---|---|---|---|---|---|---|---|
| Month | Jan | Feb | Mar | Apr | May | Jun | Jul | Aug | Sep | Oct | Nov | Dec | Year |
| Record high °C (°F) | 29.7 (85.5) |
28.6 (83.5) |
25.3 (77.5) |
19.1 (66.4) |
16.1 (61.0) |
13.2 (55.8) |
9.8 (49.6) |
11.9 (53.4) |
14.5 (58.1) |
21.7 (71.1) |
25.3 (77.5) |
26.6 (79.9) |
29.7 (85.5) |
| Mean daily maximum °C (°F) | 17.9 (64.2) |
17.2 (63.0) |
14.3 (57.7) |
9.9 (49.8) |
6.0 (42.8) |
2.9 (37.2) |
1.1 (34.0) |
1.9 (35.4) |
4.9 (40.8) |
9.6 (49.3) |
12.5 (54.5) |
15.4 (59.7) |
9.5 (49.0) |
| Mean daily minimum °C (°F) | 8.9 (48.0) |
8.6 (47.5) |
6.3 (43.3) |
3.2 (37.8) |
0.6 (33.1) |
−1.6 (29.1) |
−2.9 (26.8) |
−2.7 (27.1) |
−0.9 (30.4) |
1.6 (34.9) |
4.3 (39.7) |
6.6 (43.9) |
2.7 (36.8) |
| Record low °C (°F) | −3.9 (25.0) |
−6.5 (20.3) |
−3.6 (25.5) |
−6.9 (19.6) |
−7.7 (18.1) |
−8.6 (16.5) |
−8.5 (16.7) |
−9.6 (14.7) |
−8.6 (16.5) |
−7.0 (19.4) |
−6.0 (21.2) |
−4.5 (23.9) |
−9.6 (14.7) |
| Average precipitation mm (inches) | 110.9 (4.37) |
92.7 (3.65) |
97.4 (3.83) |
87.2 (3.43) |
98.0 (3.86) |
138.3 (5.44) |
93.1 (3.67) |
97.6 (3.84) |
117.9 (4.64) |
116.5 (4.59) |
121.7 (4.79) |
107.3 (4.22) |
1,278.6 (50.33) |
| Average precipitation days (≥ 0.2 mm) | 10.3 | 9.9 | 9.9 | 9.4 | 10.3 | 13.1 | 14.3 | 14.0 | 13.4 | 11.8 | 11.7 | 10.0 | 138.1 |
| Source: Bureau of Meteorology[9] | |||||||||||||
Regional divisions edit
The geography of Victoria has several different divisions depending on the aspect of the geography in question. Geomorphological divisions are listed in the following sections. From a human geographical perspective, the state is divided up into the following regions:
Central edit
East and South-East edit
North-East edit
North-West edit
West edit
South-West edit
Eastern Uplands (Victorian Alps) edit
Topography and hydrology edit
Centred on the main divide in eastern Victoria, the Eastern Uplands separate the streams and rivers draining north to the Murray-Darling Basin from those flowing southwards directly to the sea. It is the largest and most diverse geomorphic region in the State.
The main streams draining northwards are the Goulburn, Campaspe, Mitta Mitta, Kiewa, Loddon, Avoca, Wimmera, Ovens and King Rivers. The most important streams flowing southwards to the sea are the Latrobe, Thomson, Macalister, Mitchell, Tambo, Nicholson and Snowy Rivers and their tributaries. All these rivers, with the exception of the Snowy River, reach the sea through the Gippsland Lakes of south-eastern Victoria. Further east, the Bemm, Cann and Genoa Rivers flow directly into Bass Strait to drain the eastern division of the Eastern Uplands. The Yarra River, flowing into Port Phillip Bay, drains the southwest area of the Uplands. The south-west of the state is dominated by the Hopkins and Glenelg rivers. The longest river in Victoria is the Goulburn, which rises below the peak of Corn Hill (1,331 m) and flows into the Murray river near Echuca. It is over 650 kilometers long.
Major peaks on the Great Divide in the Eastern Uplands include Mount Cobberas (1,833 m) near the border with New South Wales, Mount Hotham (1,862 m) and Mount Howitt (1,746 m). Victoria's highest mountain, Mount Bogong (1,986 m), is just north of the main range on a ridge that separates the upper reaches of the Mitta Mitta River from the Kiewa River. Other prominent peaks are Mount Feathertop (1,922 m), also to the north of the Divide, and Mount Buller (1,804 m) to the north west of Mount Howitt. Mount Wellington (1,632 m) lies at the southern end of the Snowy Range. The highest point south of the main divide is Mount Reynard which lies at an elevation of 1,737 meters.
Dendritic patterns of narrow ridges and valleys are typical of the region and characterise much of the deeply dissected landscape on either side of the Great Divide. Occasional isolated summits such as Mount Buller and Feathertop stand above the remnant plateaus or broad ridges.
Extensive landscapes of low relief occur at higher altitudes in the form of plateaus such as the Bogong High Plains, the plateaus of Mount Buffalo (about 1,400 m) and the Baw Baw Plateau, which are collectively commonly referred to as “high plains”. Extensive plateaus at successively lower elevations also frequent the further they are from the main divide. These include the Pinnibar plateau in the north-east, Nunniong plains to the south (about 1,200 m), and the Koetong - Shelly, Wabonga and Strathbogie plateaus further north (about 600–1,100 m).
The northerly draining valleys widen and the stream gradients gradually decrease as they near the Riverine Plain to the north and west of the region. The lower reaches of these streams have flood plains of fine sediments flanked by several sets of terraces. Alluvial or colluvial formations emerge from minor valleys of small ephemeral streams that drain the interfluves of major valleys. The ridges, as they approach the lowland plains, give way to low hills which mark the later stages of erosion of the upland ridges.
The floodplain and terraces of the Murray River at Wodonga indicate the eastern edge of the Northern Riverine Plain and the northern edge of the Eastern Uplands, at which point the floodplain is only about 150 m above sea level, consequently causing the flow of the major river systems in the region to have carved deep, narrow valleys in their upper reaches over time where the gradients are much steeper than along the floodplains.
South of the Great Divide the river systems increase in gradient and valley depth, and as they approach the Eastern Plain, having narrower alluviated valleys than those in the north. Large lowland areas enclosed by steep ridges such as the Murmungee basin south of Beechworth and the Dargo area south of the Divide, occur in parts of the Eastern Uplands. These are found where more readily weathered and eroded rocks occur surrounded by resistant rocks. The southern boundary of the Eastern Uplands is the southern extremity of an uneven bench-like platform known as the Nillumbik Terrain, which can be traced bordering the Eastern Plain from near Orbost to the eastern suburbs of Melbourne. The Eastern Uplands extend to the coast from Cape Conran to Rams Head, where the Nillumbik Terrain is absent, and is fringed with coastal sand dunes in parts.
Botany edit
Tall, thick forests of Alpine Ash occur on the upper mountain slopes, while the world's tallest hardwood tree, Mountain Ash, is found at slightly lower altitudes in the west of the region, with a typical variety of mixed-species eucalypts in conjunction with Ti-Tree shrubs composing the remainder of the forested portion of the Eastern Uplands.
The high plains are dominated by grasslands, herbfields, and heath communities which are widespread in areas where cold air drainage limits woody plant growth, with sphagnum bogs and fens in permanently wet areas. Snow Gum woodlands occupy the rocky knolls and ridges above approximately 1400–1500 m.[10]
Western Uplands (Grampians) edit
Dissected uplands edit
This section is empty. You can help by adding to it. (January 2011) |
Strike ridges & valleys (Grampians range) edit
This section is empty. You can help by adding to it. (January 2011) |
Low elevation plateau (Tablelands) edit
This section is empty. You can help by adding to it. (January 2011) |
Southern Uplands (Strzelecki & Otways) edit
250-600m (Otway, Strzelecki & Hoddle Ranges) edit
This section is empty. You can help by adding to it. (January 2011) |
100-250m edit
This section is empty. You can help by adding to it. (January 2011) |
Below 100m edit
This section is empty. You can help by adding to it. (January 2011) |
Northern riverine plains (Murray Valley & Riverina) edit

Modern floodplains edit
This section is empty. You can help by adding to it. (January 2011) |
Older alluvial plains edit
This section is empty. You can help by adding to it. (January 2011) |
Alluvial fans & aprons edit
This section is empty. You can help by adding to it. (January 2011) |
Hills & low hills edit
This section is empty. You can help by adding to it. (January 2011) |
North-Western Dunefields & Plains (Wimmera & The Mallee) edit
Calcareous dunefields edit
This section is empty. You can help by adding to it. (January 2011) |
Siliceous dunefields (Sunset, Big & Little Deserts) edit
This section is empty. You can help by adding to it. (January 2011) |
Depressions edit
This section is empty. You can help by adding to it. (January 2011) |
Clay plains with subdued ridges edit
This section is empty. You can help by adding to it. (January 2011) |
Ridges with sand & flats edit
This section is empty. You can help by adding to it. (January 2011) |
Hills & low hills edit
This section is empty. You can help by adding to it. (January 2011) |
Western Plains (Glenelg-Hopkins) edit
Volcanic plains edit
This section is empty. You can help by adding to it. (January 2011) |
Sedimentary plains edit
This section is empty. You can help by adding to it. (January 2011) |
Hills & low hills edit
This section is empty. You can help by adding to it. (January 2011) |
Eastern Plains (Gippsland) edit
Central sunklands edit
This section is empty. You can help by adding to it. (January 2011) |
South-eastern riverine plains edit
This section is empty. You can help by adding to it. (January 2011) |
High level terraces & fans edit
This section is empty. You can help by adding to it. (January 2011) |
Coastal edit
Active cliffs (Port Campbell) edit
This section is empty. You can help by adding to it. (January 2011) |
Steep slopes with basal cliffs (Cape Otway) edit
This section is empty. You can help by adding to it. (January 2011) |

Stranded cliffs (Gippsland Lakes) edit
This section is empty. You can help by adding to it. (January 2011) |
Coastal barriers (Ninety Mile Beach) edit
This section is empty. You can help by adding to it. (January 2011) |
Transgressive dunes edit
This section is empty. You can help by adding to it. (January 2011) |
Low coasts (wetlands & tidal reaches) edit
This section is empty. You can help by adding to it. (January 2011) |
Central bays (Port Phillip & Western Port) edit
This section is empty. You can help by adding to it. (January 2011) |
Engineered coast (Port Melbourne) edit
This section is empty. You can help by adding to it. (January 2011) |
See also edit
References edit
- ^ Jacaranda Atlas 6th Edition. Pages 80-87
- ^ https://www.ga.gov.au/scientific-topics/national-location-information/dimensions/area-of-australia-states-and-territories
- ^ a b c "Rainfall and Temperature Records: National" (PDF). Bureau of Meteorology. Archived (PDF) from the original on 27 March 2015. Retrieved 8 June 2018.
- ^ "Official records for Australia in January". Daily Extremes. Bureau of Meteorology. 31 July 2013. Archived from the original on 10 January 2019. Retrieved 8 June 2018.
- ^ "Melbourne Airport". BOM. Archived from the original on 10 April 2022. Retrieved 9 March 2022.
- ^ "Geelong (Avalon Airport) 1991–2020 averages". Bureau of Meteorology. Retrieved 20 March 2022.
- ^ "Geelong (Avalon Airport) all years". Bureau of Meteorology. Retrieved 20 March 2022.
- ^ "Monthly climate statistics". Bureau of Meteorology. Retrieved 12 December 2016.
- ^ "Climate Statistics for Falls Creek". Climate statistics for Australian locations. Bureau of Meteorology. Retrieved 13 November 2016.
- ^ DPI, Eastern Uplands
- ^ DPI, Western Uplands
- ^ DPI, Southern Uplands
- ^ DPI, Northern Riverine Plains
- ^ DPI, Dunefields & Plains
- ^ DPI, Western Plains
- ^ DPI, Eastern Plains