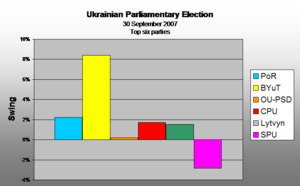
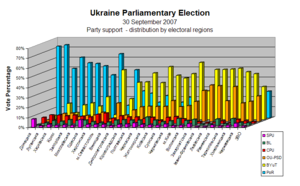
The data for this comparative chart is based on the official results published by the Ukrainian Electoral Committee. This chart should be read in conjunction with its sister charts including the swing Analysis.
This chart, unlike the second place winner map, is statistically correct in that its shows all six major parties ad their associated level of support. The first place and second place maps do not show the percentage of support for each party which varies significantly from electoral district to district.
Source of information and results: 2007
    http://www.cvk.gov.ua/pls/vnd2007/W6P320?PT001F01=600&pPlace=1
    http://www.cvk.gov.ua/pls/vnd2007/W6P320?PT001F01=600&pPlace=2
    http://www.cvk.gov.ua/pls/vnd2007/W6P320?PT001F01=600&pPlace=3
    http://www.cvk.gov.ua/pls/vnd2007/W6P320?PT001F01=600&pPlace=4
    http://www.cvk.gov.ua/pls/vnd2007/W6P320?PT001F01=600&pPlace=5
    http://www.cvk.gov.ua/pls/vnd2007/W6P320?PT001F01=600&pPlace=6
2006
    http://www.cvk.gov.ua/pls/vnd2006/W6P320?PT001F01=600&pPlace=1
    http://www.cvk.gov.ua/pls/vnd2006/W6P320?PT001F01=600&pPlace=2
    http://www.cvk.gov.ua/pls/vnd2006/W6P320?PT001F01=600&pPlace=3
    http://www.cvk.gov.ua/pls/vnd2006/W6P320?PT001F01=600&pPlace=4
    http://www.cvk.gov.ua/pls/vnd2006/W6P320?PT001F01=600&pPlace=5
    http://www.cvk.gov.ua/pls/vnd2006/W6P320?PT001F01=600&pPlace=7
The top six has been chosen as they are the only parties that managed to secure represetation in the Ukrainian Parliament either io 2006 or 2007

|

|
 |

|