
Size of this PNG preview of this SVG file: 576 × 432 pixels. Other resolutions: 320 × 240 pixels | 640 × 480 pixels | 1,024 × 768 pixels | 1,280 × 960 pixels | 2,560 × 1,920 pixels.
Original file (SVG file, nominally 576 × 432 pixels, file size: 92 KB)
| This is a file from the Wikimedia Commons. Information from its description page there is shown below. Commons is a freely licensed media file repository. You can help. |
Summary
| Description |
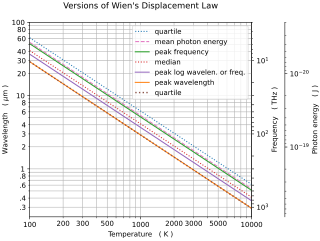
English: There are a variety of ways of associating a characteristic wavelength or frequency with the Planck black-body emission spectrum. Each of these metrics scales similarly with temperature, a principle referred to as Wien's displacement law. For different versions of the law, the proportionality constant differs—so, for a given temperature, there is no unique characteristic wavelength or frequency.
The chart plots the peak of the Planck luminosity curve when it is plotted on a per wavelength basis ("peak wavelength"), on a per frequency basis ("peak frequency"), or on a per log(wavelength) or log(frequency) basis ("peak log wavelen. or freq."). Also plotted is the mean photon energy as a function of temperature, and the wavelengths at which 25% ("quartile"), 50% ("median"), or 75% ("quartile") of the black-body emissions have a lower wavelength. The "peak wavelength" curve nearly coincides with a quartile curve. Sources: Formulas for the various peak wavelengths and mean photon energy were taken from the Wikipedia Wien's displacement law page. The median and quartiles were computed by numerically integrating Planck's law; however, for any who wish to avoid this, information on percentiles is given in the Planck's law article. |
| Date | |
| Source | Own work |
| Author | Rhwentworth |
Licensing
I, the copyright holder of this work, hereby publish it under the following license:
This file is licensed under the Creative Commons Attribution-Share Alike 4.0 International license.
- You are free:
- to share – to copy, distribute and transmit the work
- to remix – to adapt the work
- Under the following conditions:
- attribution – You must give appropriate credit, provide a link to the license, and indicate if changes were made. You may do so in any reasonable manner, but not in any way that suggests the licensor endorses you or your use.
- share alike – If you remix, transform, or build upon the material, you must distribute your contributions under the same or compatible license as the original.
File history
Click on a date/time to view the file as it appeared at that time.
| Date/Time | Thumbnail | Dimensions | User | Comment | |
|---|---|---|---|---|---|
| current | 02:03, 29 May 2023 | | 576 × 432 (92 KB) | Rhwentworth | Uploaded own work with UploadWizard |
File usage
The following pages on the English Wikipedia use this file (pages on other projects are not listed):