
Original file (SVG file, nominally 942 × 472 pixels, file size: 71 KB)
![]() ✓
The source code of this SVG is valid.
✓
The source code of this SVG is valid.
Summary edit
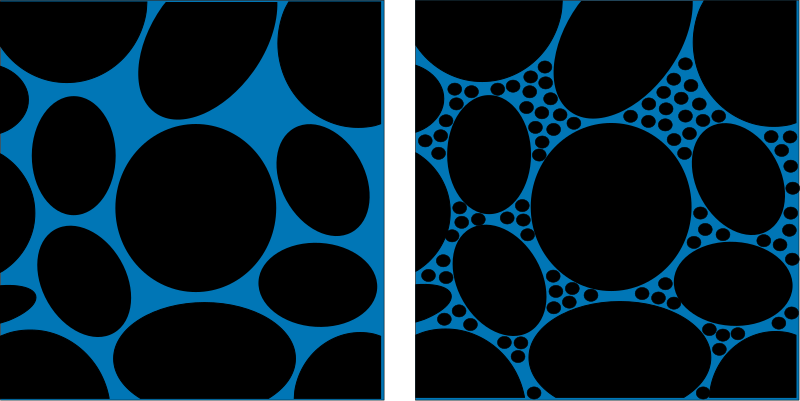
An illustration of the effects of sorting on the overall porosity of a porous media. The black shapes represent solids, the blue represents pore spaces. "Porosity and Permeability." World of Earth Science. Ed. K. Lee Lerner and Brenda Wilmoth Lerner. Gale Cengage, 2003. eNotes.com. 2006. 3 May, 2009 <http://www.enotes.com/earth-science/ porosity-permeability>
Licensing edit
| I, the copyright holder of this work, hereby release it into the public domain. This applies worldwide. If this is not legally possible: |
 | This file is a candidate to be copied to Wikimedia Commons.
Any user may perform this transfer; refer to Wikipedia:Moving files to Commons for details. If this file has problems with attribution, copyright, or is otherwise ineligible for Commons, then remove this tag and DO NOT transfer it; repeat violators may be blocked from editing. Other Instructions
| ||
| |||
File history
Click on a date/time to view the file as it appeared at that time.
| Date/Time | Thumbnail | Dimensions | User | Comment | |
|---|---|---|---|---|---|
| current | 18:55, 2 January 2007 | | 942 × 472 (71 KB) | KrisK (talk | contribs) | |
| 18:51, 2 January 2007 |  | 990 × 765 (68 KB) | KrisK (talk | contribs) | ||
| 18:50, 2 January 2007 |  | 990 × 765 (88 KB) | KrisK (talk | contribs) | ||
| 18:48, 2 January 2007 |  | 990 × 765 (88 KB) | KrisK (talk | contribs) | An illustration of the effects of sorting on the overall porosity of a porous media. The black shapes represent solids, the blue represents pore spaces. |
You cannot overwrite this file.