No higher resolution available.
US_Wastewater_Treatment_Levels_Before_&_After_CWA.png (425 × 404 pixels, file size: 18 KB, MIME type: image/png)
| This is a file from the Wikimedia Commons. Information from its description page there is shown below. Commons is a freely licensed media file repository. You can help. |
Summary
| Description |
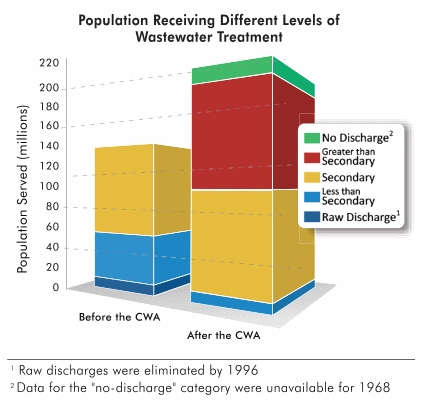
English: Caption: "Population Receiving Different Levels of Wastewater Treatment." Graph showing levels of municipal sewage treatment in the United States, before and after passage of the 1972 Clean Water Act (CWA). Data based on the 2000 EPA Clean Watershed Needs Survey. |
| Date | |
| Source | U.S. Environmental Protection Agency (EPA), "Primer for Municipal Wastewater Treatment Systems." EPA 832-R-04-001. p. 6. |
| Author | U.S. Environmental Protection Agency, Washington, D.C. |
Licensing
This image (or other media) is a work of an Environmental Protection Agency employee, taken or made as part of that person's official duties. As works of the U.S. federal government, all EPA images are in the public domain.
|
||
File history
Click on a date/time to view the file as it appeared at that time.
| Date/Time | Thumbnail | Dimensions | User | Comment | |
|---|---|---|---|---|---|
| current | 05:01, 2 May 2020 | | 425 × 404 (18 KB) | Moreau1 | {{Information |Description={{en|1=Caption: "Population Receiving Different Levels of Wastewater Treatment." Graph showing levels of municipal sewage treatment in the United States, before and after passage of the 1972 Clean Water Act (CWA). Data based on the 2000 EPA Clean Watershed Needs Survey.}} |Source=U.S. Environmental Protection Agency (EPA), [https://www.epa.gov/npdes/npdes-resources "Primer for Municipal Wastewater Treatment Systems."] EPA 832-R-04-001. p. 6. |Date=September 2004 |Au... |
File usage
The following pages on the English Wikipedia use this file (pages on other projects are not listed):