Original file (842 × 647 pixels, file size: 32 KB, MIME type: image/png)
| This is a file from the Wikimedia Commons. Information from its description page there is shown below. Commons is a freely licensed media file repository. You can help. |
Summary
| Description |
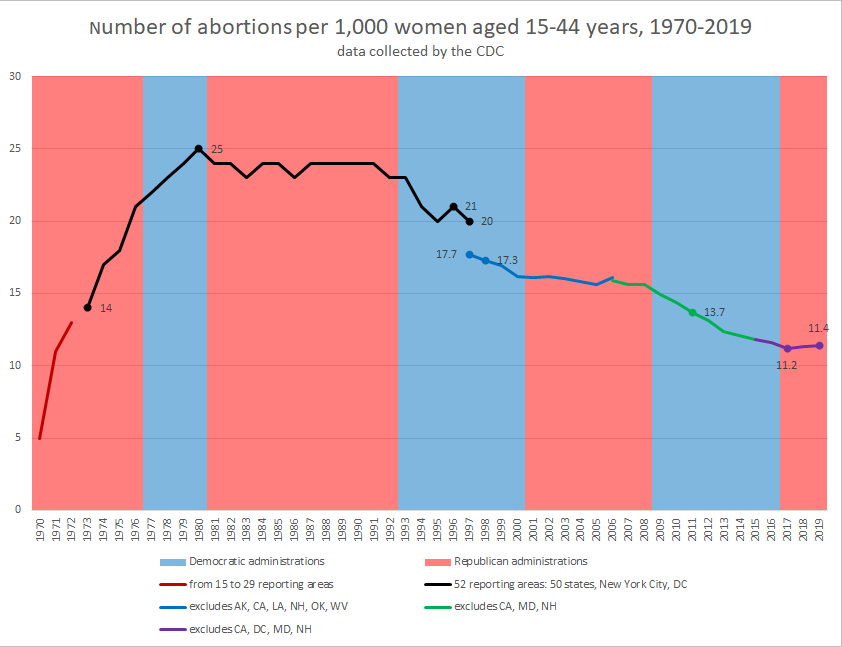
English: This graph shows data on U.S. abortion rates from 1970 to 2019.
To estimate the percentage change in the abortion rate from one year to the next most accurately, we must compare data from the same group of states in both years. Unfortunately, different states report their data to the CDC in different years. The black, blue, green, and purple pieces of the graph allow us to make accurate apples-to-apples comparisons. Each differently colored piece shows data from a different group of states. For example, the blue piece shows data from 46 reporting areas that reported continuously from 1997 through 2006. The data, collected by the CDC, is taken from the following documents: Gamble, Sonya B.; Strauss, Lilo T.; Parker, Wilda Y.; Cook, Douglas A.; Zane, Suzanne B.; Hamdan, Saeed (November 28, 2008). "Abortion Surveillance -- United States, 2005". Morbidity and Mortality Weekly Report. 57 (SS-13): 16. Pazol, Karen; Gamble, Sonya B.; Parker, Wilda Y.; Cook, Douglas A.; Zane, Suzanne B.; Hamdan, Saeed (November 27, 2009). "Abortion Surveillance -- United States, 2006". Morbidity and Mortality Weekly Report. 58 (SS08): 13. Jatlaoui, Tara C.; Boutot, Maegan E.; Mandel, Michele G.; Whiteman, Maura K.; Ti, Angeline; Petersen, Emily; Pazol, Karen (November 23, 2018). "Abortion Surveillance -- United States, 2015". Morbidity and Mortality Weekly Report. 67 (13): 20. Kortsmit, Katherine; Mandel, Michele G.; Reeves, Jennifer A.; Clark, Elizabeth; Pagano, H. Pamela; Nguyen, Antionette; Petersen, Emily E.; Whiteman, Maura K. (November 26, 2021). "Abortion Surveillance -- United States, 2019". Morbidity and Mortality Weekly Report. 70 (9): 14. |
| Date | |
| Source | Own work |
| Author | Thiesen |
Licensing
- You are free:
- to share – to copy, distribute and transmit the work
- to remix – to adapt the work
- Under the following conditions:
- attribution – You must give appropriate credit, provide a link to the license, and indicate if changes were made. You may do so in any reasonable manner, but not in any way that suggests the licensor endorses you or your use.
- share alike – If you remix, transform, or build upon the material, you must distribute your contributions under the same or compatible license as the original.
File history
Click on a date/time to view the file as it appeared at that time.
| Date/Time | Thumbnail | Dimensions | User | Comment | |
|---|---|---|---|---|---|
| current | 06:25, 19 July 2022 | | 842 × 647 (32 KB) | Thiesen | Uploaded own work with UploadWizard |