
Size of this PNG preview of this SVG file: 800 × 533 pixels. Other resolutions: 320 × 213 pixels | 640 × 427 pixels | 1,024 × 683 pixels | 1,280 × 853 pixels | 2,560 × 1,707 pixels | 810 × 540 pixels.
Original file (SVG file, nominally 810 × 540 pixels, file size: 43 KB)
| This is a file from the Wikimedia Commons. Information from its description page there is shown below. Commons is a freely licensed media file repository. You can help. |
Summary
| Description |
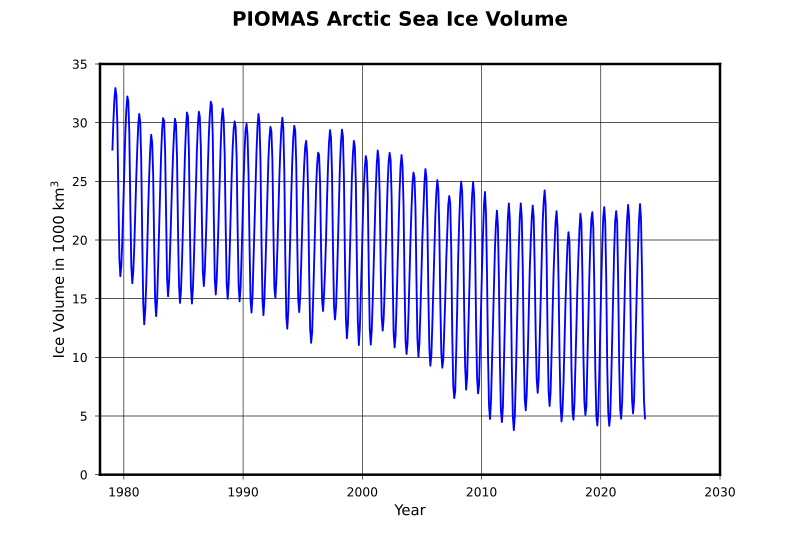
English: Plot of estimated development of arctic sea ice volume between 1979 and now.
Blue curve are data as determined by the numerical model PIOMAS. An error margin of +- 1.35 10³ km³ is given for october single values (minima) as orientation.
Deutsch: Zeitverlauf der Schätzung des Volumens des arktischen Meereseises zwischen 1979 und 2010.
Die blaue Kurve wurde durch das numerische Modell PIOMAS berechnet. Als Fehler für Einzelwerte wird für Oktoberwerte (Minima) +- 1.35 10³ km³ als Orientierung angegeben. |
| Date | |
| Source |
{{Volume time series and uncertainties: Schweiger, A., R. Lindsay, J. Zhang, M. Steele, H. Stern, Uncertainty in modeled arctic sea ice volume, J. Geophys. Res., doi:10.1029/2011JC007084, 2011, Plot: own work, done with Python, Numpy, Matplotlib}}, based on published data of Polar Science Center, University of Washington, http://psc.apl.washington.edu/research/projects/arctic-sea-ice-volume-anomaly/data/ |
| Author | Dominiklenne |
Licensing
| I, the copyright holder of this work, release this work into the public domain. This applies worldwide. In some countries this may not be legally possible; if so: I grant anyone the right to use this work for any purpose, without any conditions, unless such conditions are required by law. |
File history
Click on a date/time to view the file as it appeared at that time.
| Date/Time | Thumbnail | Dimensions | User | Comment | |
|---|---|---|---|---|---|
| current | 18:29, 23 October 2023 | | 810 × 540 (43 KB) | Dominiklenne | update to october 2023 |
| 21:16, 10 February 2023 |  | 810 × 540 (43 KB) | Dominiklenne | update to january 2023 | |
| 20:47, 4 March 2022 |  | 810 × 540 (42 KB) | Dominiklenne | updated to february 2022 | |
| 23:35, 3 November 2020 |  | 733 × 516 (85 KB) | Dominiklenne | data updated until sept 2020. time axis runs now until 2030. | |
| 16:30, 28 October 2019 |  | 733 × 516 (83 KB) | Dominiklenne | data updated until september 2019, years scale extended to 2025 | |
| 19:10, 28 October 2018 |  | 688 × 516 (112 KB) | Dominiklenne | update including sept 2018 | |
| 21:07, 8 July 2017 |  | 688 × 516 (111 KB) | Dominiklenne | updated until june 2017 monthly value | |
| 20:16, 27 November 2016 |  | 688 × 516 (110 KB) | Dominiklenne | updated to oct 2016 | |
| 22:25, 22 July 2016 |  | 688 × 516 (110 KB) | Dominiklenne | data updated to june 2016 | |
| 10:19, 6 August 2015 |  | 688 × 516 (109 KB) | Dominiklenne | data update |
File usage
The following pages on the English Wikipedia use this file (pages on other projects are not listed):
Global file usage
The following other wikis use this file:
- Usage on ar.wikipedia.org
- Usage on bn.wikipedia.org
- Usage on ca.wikipedia.org
- Usage on cs.wikipedia.org
- Usage on de.wikipedia.org
- Usage on el.wikipedia.org
- Usage on es.wikipedia.org
- Usage on et.wikipedia.org
- Usage on fa.wikipedia.org
- Usage on fr.wikipedia.org
- Usage on id.wikipedia.org
- Usage on it.wikipedia.org
- Usage on ja.wikipedia.org
- Usage on ko.wikipedia.org
- Usage on kw.wikipedia.org
- Usage on la.wikipedia.org
- Usage on mk.wikipedia.org
- Usage on ru.wikipedia.org
- Usage on simple.wikipedia.org
- Usage on sq.wikipedia.org
- Usage on uk.wikipedia.org
- Usage on zh.wikipedia.org