
Size of this PNG preview of this SVG file: 475 × 266 pixels. Other resolutions: 320 × 179 pixels | 640 × 358 pixels | 1,024 × 573 pixels | 1,280 × 717 pixels | 2,560 × 1,434 pixels.
Original file (SVG file, nominally 475 × 266 pixels, file size: 257 KB)
| This is a file from the Wikimedia Commons. Information from its description page there is shown below. Commons is a freely licensed media file repository. You can help. |
Summary
| Description |
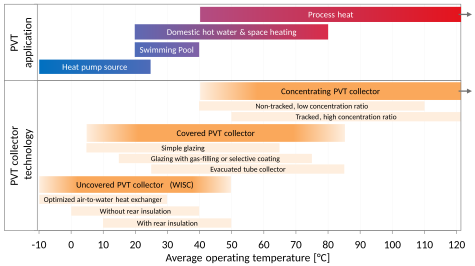
English: Typical fields of applications and suitable PVT technologies are mapped in this graph.
The temperature ranges are a result of a survey amongst 26 international experts in the field of PVT collectors experts from research and industry within IEA SHC Task 60. The graph, survey and data analysis are my own work, which will also be published in a Task report in 2020. Reference to report will be updated. |
| Date | |
| Source | Own work |
| Author | Manuel Lämmle |
Licensing
I, the copyright holder of this work, hereby publish it under the following license:
This file is licensed under the Creative Commons Attribution-Share Alike 4.0 International license.
- You are free:
- to share – to copy, distribute and transmit the work
- to remix – to adapt the work
- Under the following conditions:
- attribution – You must give appropriate credit, provide a link to the license, and indicate if changes were made. You may do so in any reasonable manner, but not in any way that suggests the licensor endorses you or your use.
- share alike – If you remix, transform, or build upon the material, you must distribute your contributions under the same or compatible license as the original.
File history
Click on a date/time to view the file as it appeared at that time.
| Date/Time | Thumbnail | Dimensions | User | Comment | |
|---|---|---|---|---|---|
| current | 09:46, 28 February 2020 | | 475 × 266 (257 KB) | Manuel Lämmle | User created page with UploadWizard |
File usage
The following pages on the English Wikipedia use this file (pages on other projects are not listed):