
Original file (SVG file, nominally 1,152 × 576 pixels, file size: 135 KB)
| This is a file from the Wikimedia Commons. Information from its description page there is shown below. Commons is a freely licensed media file repository. You can help. |
Summary
| Description |
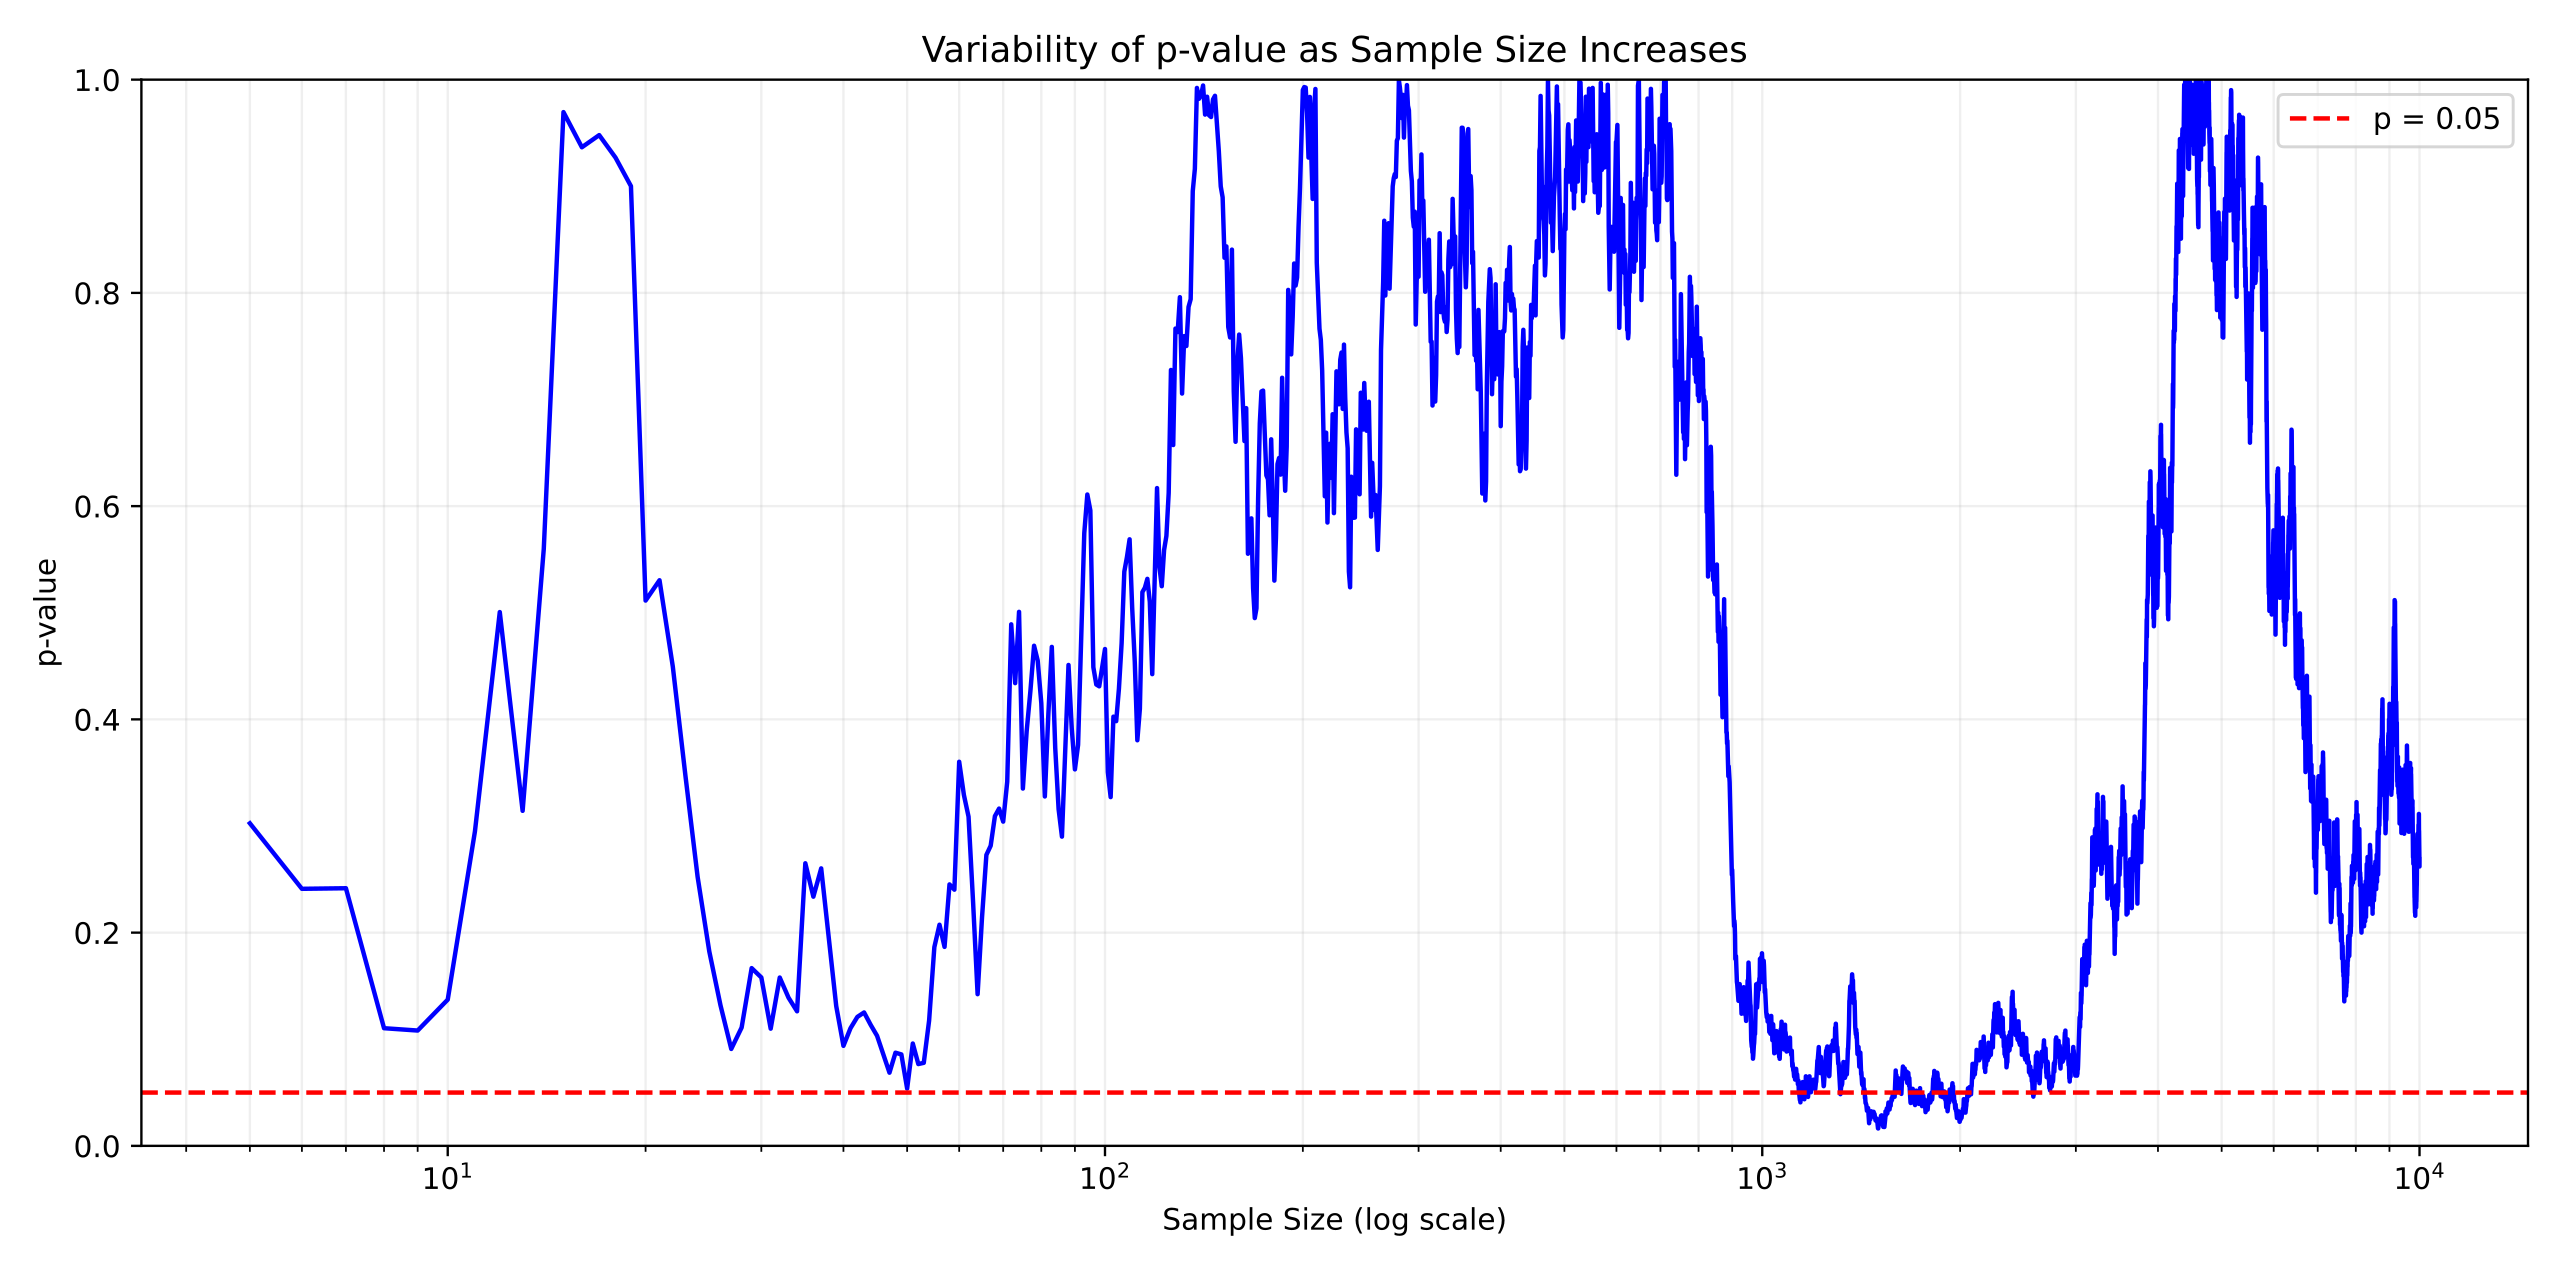
English: The figure shows the change in p-values computed from a t-test as the sample size increases, and how early stopping can allow for p-hacking.
Data is drawn from two identical normal distributions, . For each sample size , ranging from 5 to , a t-test is performed on the first <math>n<math> samples from each distribution, and the resulting p-value is plotted. The red dashed line indicates the commonly used significance level of 0.05. If the data collection or analysis were to stop at a point where the p-value happened to fall below the significance level, a spurious statistically significant difference could be reported. Illustration based on Wagenmakers, Eric-Jan. "A practical solution to the pervasive problems of p values." Psychonomic bulletin & review 14.5 (2007): 779-804. ```python import numpy as np import matplotlib.pyplot as plt from scipy import stats
np.random.seed(42)
def perform_t_test(sample1, sample2): _, p_value = stats.ttest_ind(sample1, sample2) return p_value
max_samples = 10**4 start_samples = 5 p_values = [] sample_sizes = range(start_samples, max_samples + 1)
population1 = stats.norm(loc=0, scale=10) population2 = stats.norm(loc=0, scale=10) samples1 = population1.rvs(max_samples) samples2 = population2.rvs(max_samples) for n in sample_sizes: p_value = perform_t_test(samples1[:n], samples2[:n]) p_values.append(p_value)
plt.figure(figsize=(12, 6)) plt.semilogx(sample_sizes, p_values, 'b-') plt.axhline(y=0.05, color='r', linestyle='--', label='p = 0.05') plt.xlabel('Sample Size (log scale)') plt.ylabel('p-value') plt.title('Variability of p-value as Sample Size Increases') plt.grid(True, which="both", ls="-", alpha=0.2) plt.legend() plt.ylim(0, 1) plt.tight_layout() plt.savefig('p-hacking.svg') plt.show() ``` |
| Date | |
| Source | Own work |
| Author | Cosmia Nebula |


Licensing
- You are free:
- to share – to copy, distribute and transmit the work
- to remix – to adapt the work
- Under the following conditions:
- attribution – You must give appropriate credit, provide a link to the license, and indicate if changes were made. You may do so in any reasonable manner, but not in any way that suggests the licensor endorses you or your use.
- share alike – If you remix, transform, or build upon the material, you must distribute your contributions under the same or compatible license as the original.
File history
Click on a date/time to view the file as it appeared at that time.
| Date/Time | Thumbnail | Dimensions | User | Comment | |
|---|---|---|---|---|---|
| current | 01:21, 26 July 2024 | | 1,152 × 576 (135 KB) | Cosmia Nebula | Uploaded while editing "Data dredging" on en.wikipedia.org |