
Size of this preview: 700 × 600 pixels. Other resolutions: 280 × 240 pixels | 560 × 480 pixels | 896 × 768 pixels | 1,195 × 1,024 pixels | 1,400 × 1,200 pixels.
Original file (1,400 × 1,200 pixels, file size: 465 KB, MIME type: image/jpeg)
| This is a file from the Wikimedia Commons. Information from its description page there is shown below. Commons is a freely licensed media file repository. You can help. |
Summary
| Description |
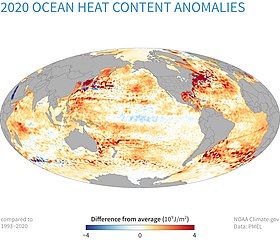
English: Map shows ocean heat anomalies in the upper 700 meters for year 2020 relative to average heat content during years 1993 thru 2020 of the same ocean regions. Regions shown in red (blue) gained (lost) thermal energy in 2020. Most regions showed positive anomalies and the total ocean heat content reached a record-high value in 2020. Image from: Reporting on the State of the Climate in 2020 published September 1, 2020 by Jessica Blunden (NOAA Climate.gov) |
| Date | |
| Source | https://www.climate.gov/media/13226 |
| Author | NOAA Climate.gov |
Licensing
This image is in the public domain because it contains materials that originally came from the U.S. National Oceanic and Atmospheric Administration, taken or made as part of an employee's official duties.
|
File history
Click on a date/time to view the file as it appeared at that time.
| Date/Time | Thumbnail | Dimensions | User | Comment | |
|---|---|---|---|---|---|
| current | 04:42, 7 January 2022 | | 1,400 × 1,200 (465 KB) | Bikesrcool | Uploaded a work by NOAA Climate.gov from https://www.climate.gov/media/13226 with UploadWizard |
File usage
The following pages on the English Wikipedia use this file (pages on other projects are not listed):
Global file usage
The following other wikis use this file:
- Usage on ig.wikipedia.org
- Usage on mk.wikipedia.org
- Usage on zh.wikipedia.org