Size of this preview: 771 × 600 pixels. Other resolutions: 309 × 240 pixels | 617 × 480 pixels | 1,000 × 778 pixels.
Original file (1,000 × 778 pixels, file size: 124 KB, MIME type: image/png)
| This is a file from the Wikimedia Commons. Information from its description page there is shown below. Commons is a freely licensed media file repository. You can help. |

|
File:NOAA Land Ocean.svg is a vector version of this file. It should be used in place of this PNG file when not inferior.
File:NOAA Land Ocean temperature anomaly.png → File:NOAA Land Ocean.svg
For more information, see Help:SVG. |
 |
Summary
| Description |
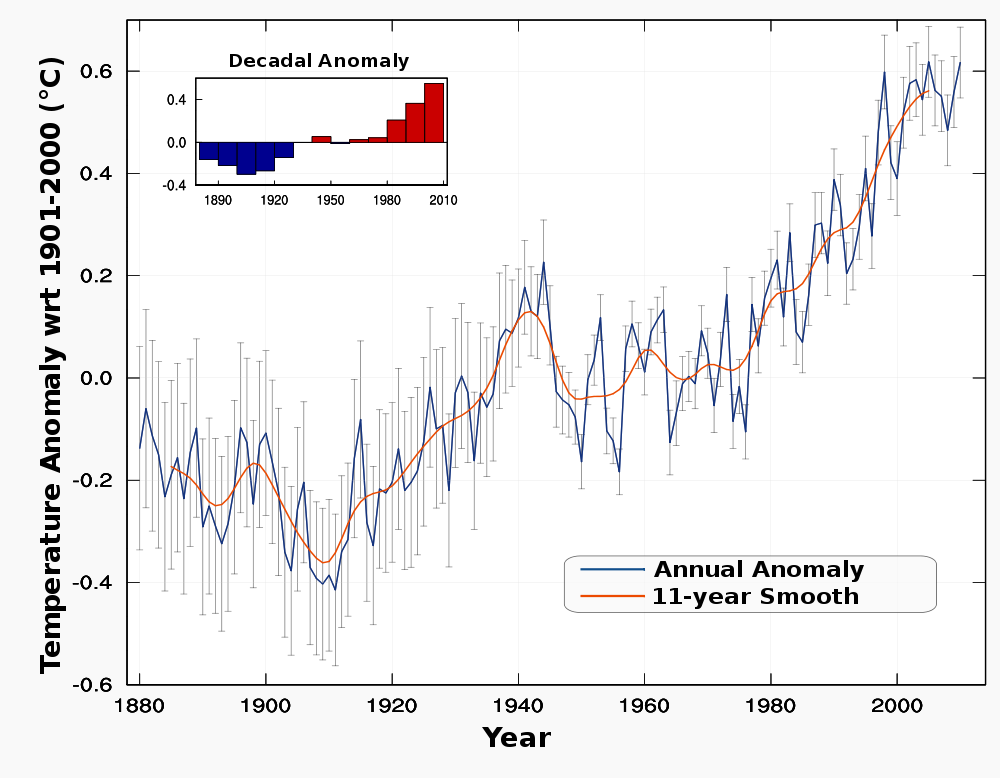
English: NOAA global land and ocean annual temperature anomaly 1880-2010 and 11-year Hanning smoothed data. Data source:http://www.ncdc.noaa.gov/oa/climate/research/anomalies/index.html
+- 2 standard error bars:ftp://eclipse.ncdc.noaa.gov/pub/ersstv3b/pdo/ |
| Source | Own work |
| Author | Giorgiogp2 |
Source
Software used:
Ferret
NCL
Inkscape
Ferret script ( Read data, compute 10 year average, smoothed data and save to netcdf format)
define axis/t=0:130:1/T0=15-jun-1880/unit=years tax
define grid/t=tax grid
file/var="ee,tland"/grid=grid annual.land.90S.90N.df_1901-2000mean.dat
file/var="ee,tocean"/grid=grid annual.ocean.90S.90N.df_1901-2000mean.dat
file/var="ee,tlandocean"/grid=grid annual.land_ocean.90S.90N.df_1901-2000mean.dat

file/var="ee,ttt,eland"/grid=grid aravg.ann.land.90S.90N.asc
file/var="ee,ttt,eocean"/grid=grid aravg.ann.ocean.90S.90N.asc
file/var="ee,ttt,elandocean"/grid=grid aravg.ann.land_ocean.90S.90N.asc

let eland2=((eland[d=4])^(1/2))*2
let eocean2=((eocean[d=5])^(1/2))*2
let elandocean2=((elandocean[d=6])^(1/2))*2

let elands=eland2[L=@shn:11]
let eoceans=eocean2[L=@shn:11]
let elandoceans=elandocean2[L=@shn:11]

let tlands=tland[d=1,L=@shn:11]
let toceans=tocean[d=2,L=@shn:11]
let tlandoceans=tlandocean[d=3,L=@shn:11]

let landd=tland[d=1,L=@sbx:10]
let oceand=tocean[d=2,L=@sbx:10]
let landoceand=tlandocean[d=3,L=@sbx:10]

let landdec=landd[L=6:131:10]
let oceandec=oceand[L=6:131:10]
let landoceandec=landoceand[L=6:131:10]
save/clobber/file=noaa.nc tland[d=1],tocean[d=2],tlandocean[d=3],tlands,toceans,tlandoceans,eland2,eocean2,elandocean2,elands,eoceans,elandoceans,landdec,oceandec,landoceandec
NCL script (graphics):
load "$NCARG_ROOT/lib/ncarg/nclscripts/csm/gsn_code.ncl"
load "$NCARG_ROOT/lib/ncarg/nclscripts/csm/gsn_csm.ncl"

h=addfile("noaa.nc","r")

time=h->TAX(:)
time2=(time)+1880
time3=h->AX001(:)
time4=(time3)+1880


noaa=h->TLANDOCEAN(:)
noaas=h->TLANDOCEANS(:)
noaadec=h->LANDOCEANDEC(:)

noaaland=h->TLAND(:)
noaaocean=h->TOCEAN(:)
noaalands=h->TLANDS(:)
noaaoceans=h->TOCEANS(:)
noaalanddec=h->LANDDEC(:)
noaaoceandec=h->OCEANDEC(:)

noaaeland=h->ELAND2(:)
noaaeocean=h->EOCEAN2(:)
noaaelandocean=h->ELANDOCEAN2(:)
noaaelands=h->ELANDS(:)
noaaeoceans=h->EOCEANS(:)
noaaelandoceans=h->ELANDOCEANS(:)

errsup=noaa+noaaelandocean
errinf=noaa-noaaelandocean

errsups=noaa+noaaelandoceans
errinfs=noaa-noaaelandoceans


wks = gsn_open_wks("pdf","noaalandocean")
gsn_define_colormap(wks,"barcp8_ext5")

res   = True
res@gsnScale = True
res@gsnFrame = False

res@vpHeightF= 0.48
res@vpWidthF = 0.55
res@trYMinF  = -0.6
res@trYMaxF  =  0.7
res@trXMinF  = 1878
res@trXMaxF  =  2014

res@tmYLMajorOutwardLengthF = 0.0
res@tmYRMajorOutwardLengthF = 0.0
res@tmXBMajorOutwardLengthF = 0.0
res@tmXTMajorOutwardLengthF = 0.0
res@tmYLMinorOutwardLengthF = 0.0
res@tmYRMinorOutwardLengthF = 0.0
res@tmXBMinorOutwardLengthF = 0.0
res@tmXTMinorOutwardLengthF = 0.0

res@tmXBLabelFont=21
res@tmXBLabelFontAspectF=1.2
res@tmXBLabelFontHeightF=0.010
res@tmXBLabelFontThicknessF=1.2
res@tmXBLabelFontColor=1
res@tmXBMajorLengthF=0.008
res@tmXBMajorThicknessF=1
res@tmXBMajorLineColor=1
res@tmXBMinorLengthF=0.005
res@tmXBMinorPerMajor=0
res@tmXBMinorThicknessF=0.7
res@tmXBMinorLineColor=1
res@tmXBMaxTicks=15
res@tmXBMode="Manual"
res@tmXBTickStartF=1880
res@tmXBTickSpacingF=20

res@tmXTMajorLengthF=0.008
res@tmXTMajorThicknessF=1
res@tmXTMajorLineColor=1
res@tmXTMinorLengthF=0.000
res@tmXTMinorPerMajor=0
res@tmXTMinorThicknessF=0.7
res@tmXTMinorLineColor=1
res@tmXTMaxTicks=15
res@tmXTMode="Manual"
res@tmXTTickStartF=1880
res@tmXTTickSpacingF=20

res@tmYLMaxTicks=12
res@tmYLLabelFont=21
res@tmYLLabelFontAspectF=1.2
res@tmYLLabelFontHeightF=0.010
res@tmYLLabelFontThicknessF=1.2
res@tmYLLabelFontColor=1
res@tmYLTickStartF=-0.6
res@tmYLTickSpacingF=0.2
res@tmYLMajorLengthF=0.008
res@tmYLMajorThicknessF=1
res@tmYLMinorLengthF=0.0
res@tmYLMinorPerMajor=2
res@tmYLMinorThicknessF=0.7
res@tmYLMajorLineColor=1
res@tmYLMinorLineColor=1

res@tmYRTickSpacingF=10
res@tmYRMinorLengthF=0.0
res@tmYRMajorLengthF=0.008
res@tmYRMajorThicknessF=1

res@tmYMajorGrid=True
res@tmYMajorGridLineColor=2
res@tmYMajorGridLineDashPattern= 0
res@tmYMajorGridThicknessF=0.05
res@tmXMajorGrid=True
res@tmXMajorGridLineColor=2
res@tmXMajorGridLineDashPattern= 0
res@tmXMajorGridThicknessF=0.05
res@gsnMaximize=True

res@tmBorderThicknessF=1.5
res@tmBorderLineColor=1
res@tiYAxisString = ""
res@tiYAxisFontHeightF=0.014
res@tiYAxisFontAspectF=1.2
res@tiYAxisFontThicknessF=1.1
res@tiYAxisFont=22
res@tiXAxisString = ""
res@tiXAxisFontHeightF=0.014
res@tiXAxisFontAspectF=1.2
res@tiXAxisFontThicknessF=1.1
res@tiXAxisFont=22
res@tiMainFont=22
res@tiMainString  = ""
res@tiMainFontHeightF=0.014
res@tiMainFontAspectF=1.3
res@tiMainFontThicknessF=1.3
res@xyMonoLineColor=True
res@xyLineColor=156
res@xyMonoLineThickness=False

res@tmYLAutoPrecision=False
res@tmYLPrecision=1

res@xyLineThicknessF=1.8
res@xyDashPattern = 0
res@gsnDraw=False
plot2 = gsn_csm_xy (wks,time2,noaa,res)

polyres= True
error_bar = new(dimsizes(noaa),graphic)
do t=0,dimsizes(noaa)-1
error_bar(t) = gsn_add_polyline(wks,plot2,(/t+1880,t+1880/),(/errsup(t),errinf(t)/),polyres)
end do
error_bar2 = new(dimsizes(noaa),graphic)
do t=0,dimsizes(noaa)-1
error_bar2(t) = gsn_add_polyline(wks,plot2,(/t+1879.5,t+1880.5/),(/errsup(t),errsup(t)/),polyres)
end do
error_bar3 = new(dimsizes(noaa),graphic)
do t=0,dimsizes(noaa)-1
error_bar3(t) = gsn_add_polyline(wks,plot2,(/t+1879.5,t+1880.5/),(/errinf(t),errinf(t)/),polyres)
end do
draw(plot2)

plot3 = gsn_csm_xy (wks,time2,noaa,res)
draw(plot3)

res@xyLineColor=55
res@xyLineThicknessF=2.1
res@xyDashPattern = 0
plot=gsn_csm_xy (wks,time2,noaas,res)
draw(plot)

frame(wks)

sres=True
sres@gsnFrame= False
sres@tmYLAutoPrecision=True
sres@tmXBOn=True
sres@tmXTOn=False
sres@tmYLOn=True
sres@tmYROn=False
sres@tmYRLabelsOn=False
sres@tmYLLabelsOn=True
sres@tmBorderThicknessF=1.5
sres@tmYMajorGrid=False
sres@tmXBMajorThicknessF=1
sres@tmYLMajorThicknessF=1
sres@tmYRMajorThicknessF=1
sres@tmXTMajorThicknessF=1
sres@tmYMajorGridLineColor=2
sres@tmYMajorGridLineDashPattern= 0
sres@tmXMajorGridThicknessF=1
res@tmYMajorGridThicknessF=0.03

sres@tmYLMajorOutwardLengthF = 0.0
sres@tmYRMajorOutwardLengthF = 0.0
sres@tmXBMajorOutwardLengthF = 0.0
sres@tmXTMajorOutwardLengthF = 0.0
sres@tmYLTickStartF=-0.4
sres@tmYLTickSpacingF=0.2
sres@tmYLLabelFontHeightF = 0.01
sres@trXMinF           = 1878
sres@trXMaxF           = 2012
sres@trYMinF           = -0.4
sres@trYMaxF           =  0.6
sres@tiMainString  = ""
sres@tmYLMaxTicks=4
sres@tiYAxisString = ""
sres@tmYRLabelFontHeightF=0.02
sres@tmXBMajorLengthF=0.004
sres@tmYRMajorLengthF=0.008
sres@tmXTMinorLengthF=0
sres@tmYRMinorLengthF=0
sres@tmYLMinorLengthF=0
sres@tmYLAutoPrecision=False
sres@tmYLPrecision=1
sres@gsnYRefLine           = 0.
sres@gsnXYBarChart         = True
sres@gsnAboveYRefLineColor =59
sres@gsnBelowYRefLineColor =12

sres@vpXF              = 0.25
sres@vpYF              = 0.75
sres@vpWidthF          = 0.25
sres@vpHeightF         = 0.1
plot=gsn_csm_xy(wks,time4,noaadec,sres)
draw(plot)

frame(wks)
Text added in Inkscape.
Licensing
I, the copyright holder of this work, hereby publish it under the following licenses:
This file is licensed under the Creative Commons Attribution-Share Alike 3.0 Unported license.
- You are free:
- to share – to copy, distribute and transmit the work
- to remix – to adapt the work
- Under the following conditions:
- attribution – You must give appropriate credit, provide a link to the license, and indicate if changes were made. You may do so in any reasonable manner, but not in any way that suggests the licensor endorses you or your use.
- share alike – If you remix, transform, or build upon the material, you must distribute your contributions under the same or compatible license as the original.

|
Permission is granted to copy, distribute and/or modify this document under the terms of the GNU Free Documentation License, Version 1.2 or any later version published by the Free Software Foundation; with no Invariant Sections, no Front-Cover Texts, and no Back-Cover Texts. A copy of the license is included in the section entitled GNU Free Documentation License. |
You may select the license of your choice.
File history
Click on a date/time to view the file as it appeared at that time.
| Date/Time | Thumbnail | Dimensions | User | Comment | |
|---|---|---|---|---|---|
| current | 13:32, 15 March 2011 | | 1,000 × 778 (124 KB) | Giorgiogp2 | x axis |
| 13:56, 14 February 2011 |  | 1,000 × 800 (129 KB) | Giorgiogp2 | add error bars | |
| 15:01, 14 January 2011 |  | 1,398 × 1,213 (289 KB) | Giorgiogp2 | update to 2010 | |
| 19:05, 14 February 2010 |  | 1,350 × 1,169 (316 KB) | Giorgiogp2 | {{Information |Description={{en|1=NOAA global land and ocean temperature anomaly 1880-2009. Data source:http://www.ncdc.noaa.gov/oa/climate/research/anomalies/index.html}} |Source={{own}} |Author=Giorgiogp2 |Date= |Permission= |other_v |
File usage
The following pages on the English Wikipedia use this file (pages on other projects are not listed):