Original file (2,579 × 1,635 pixels, file size: 95 KB, MIME type: image/png)
Summary edit
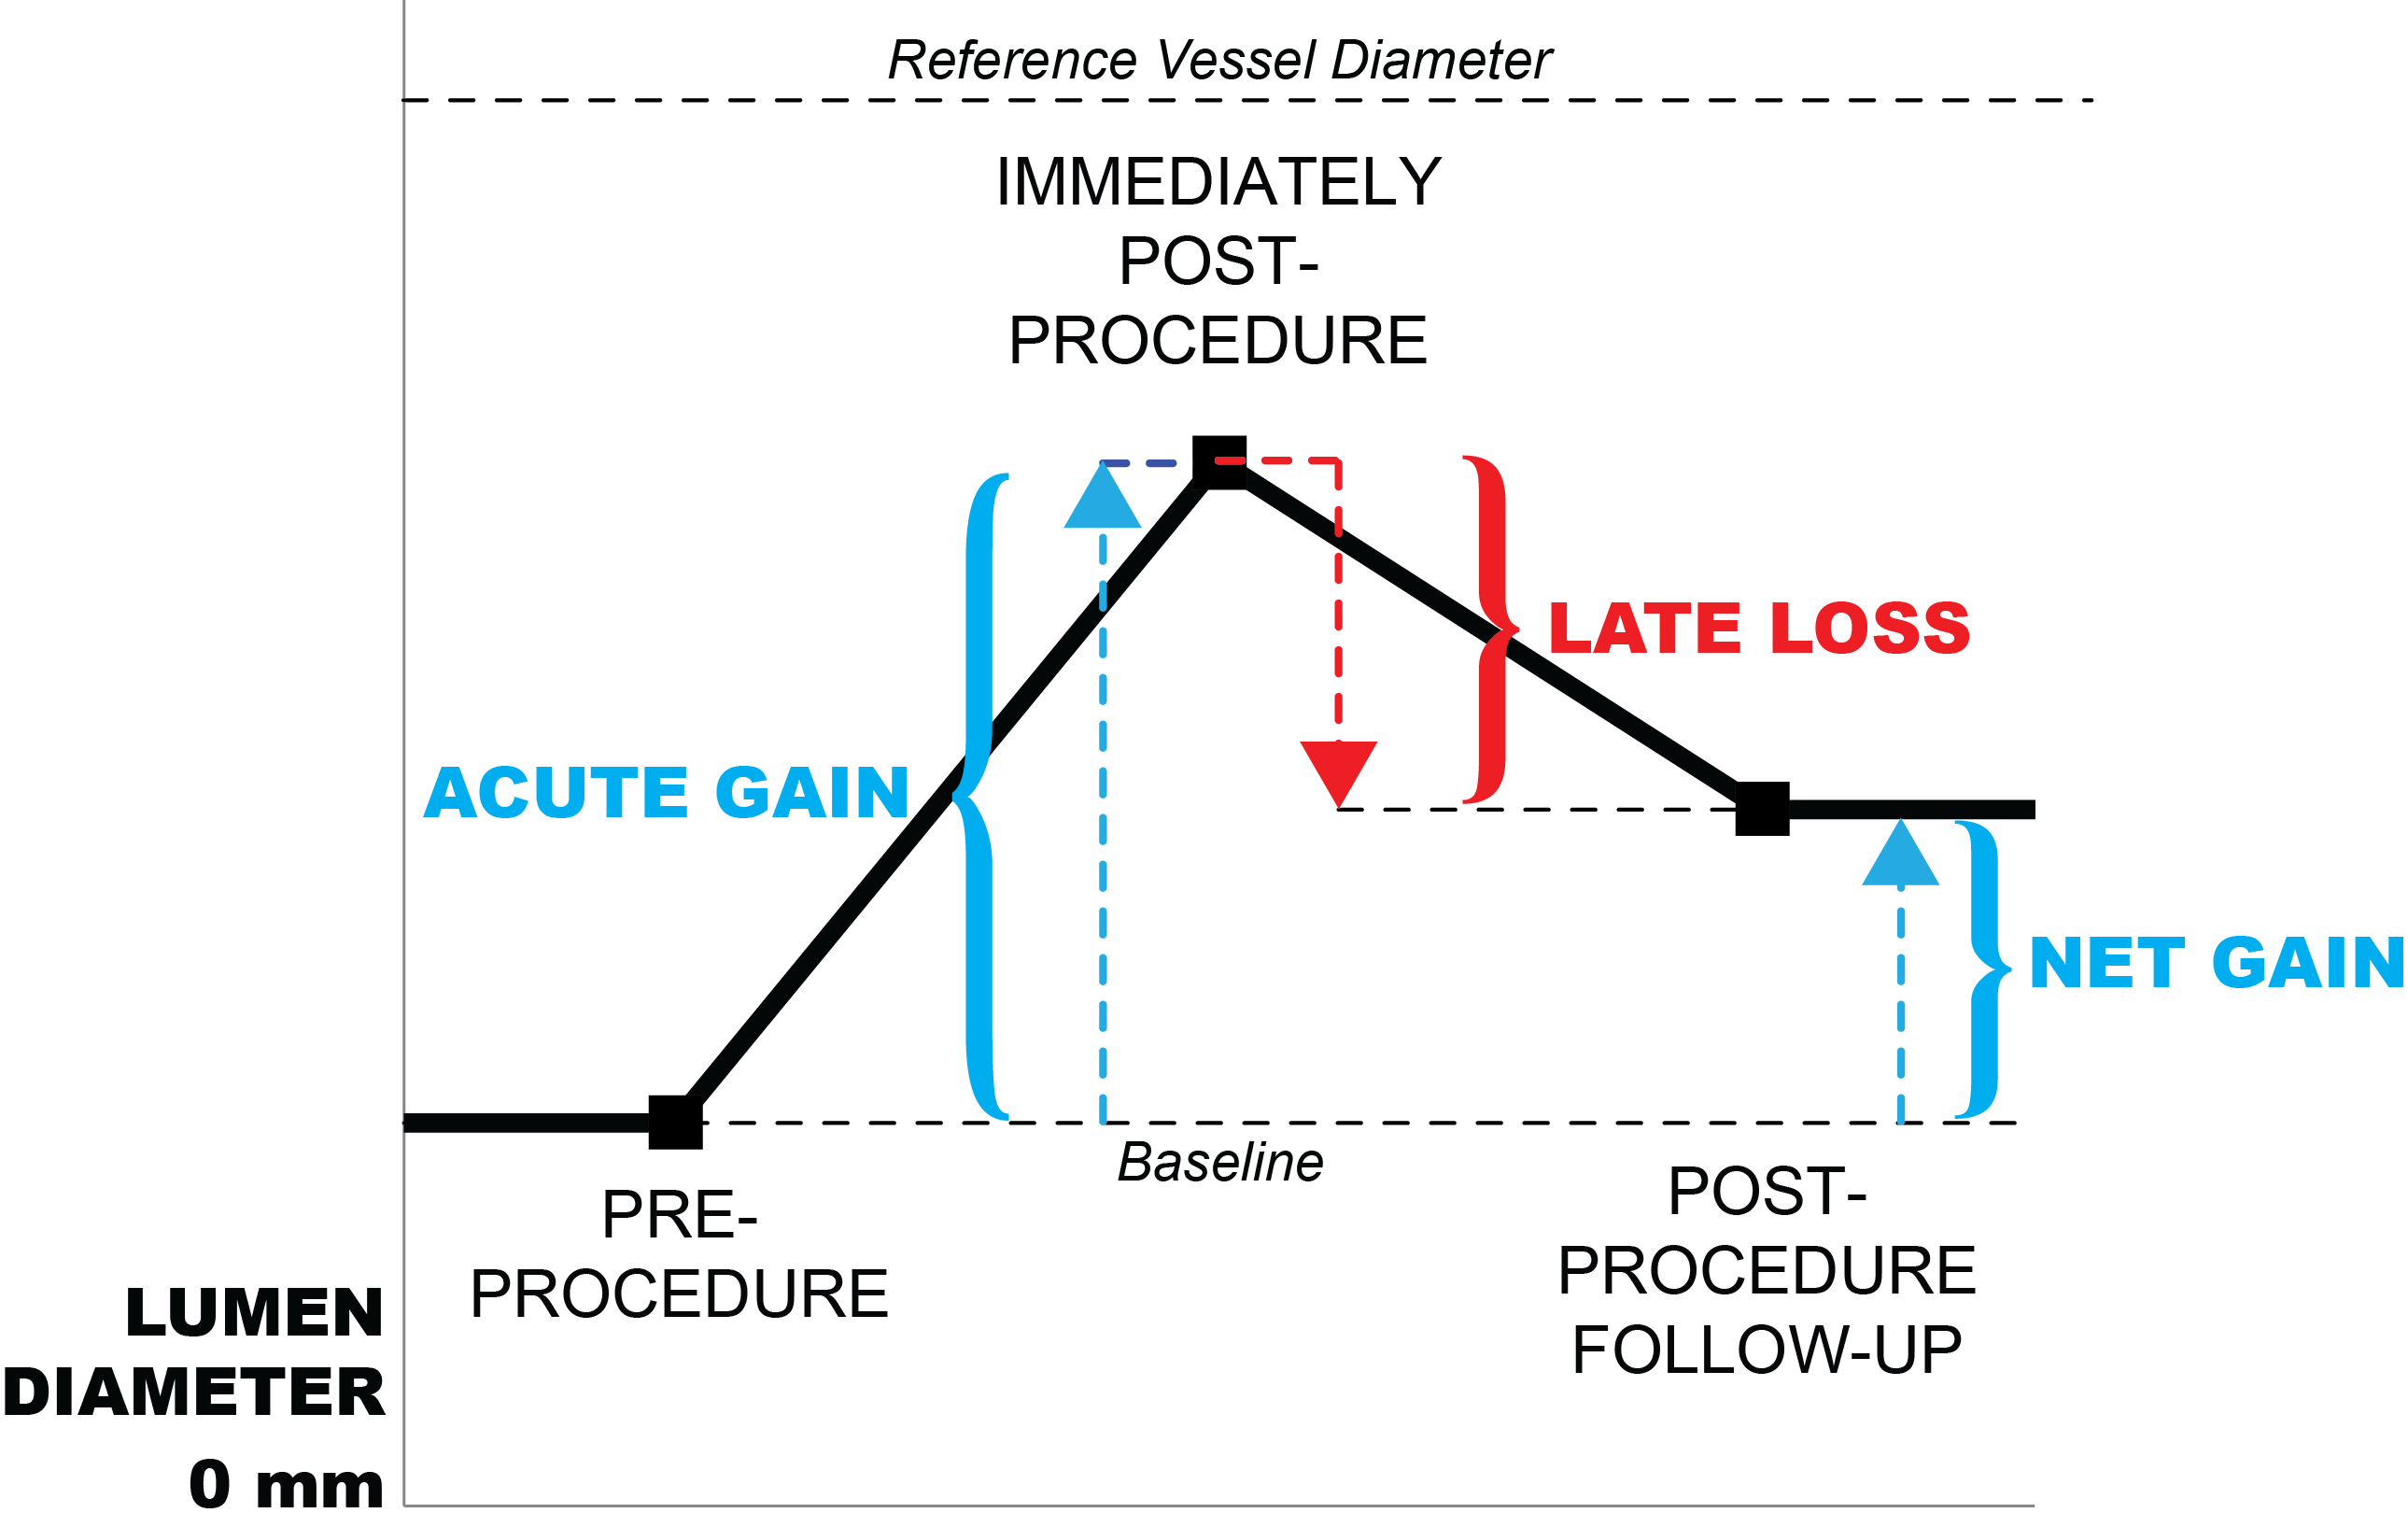
Conceptual schematic describing the outcomes of any given vascular procedure intended to increase vessel lumen by vascular interventions, eg, stent grafting, balloon angioplasty, or another intervention. Acute gain, late loss (restenosis), and net gain are represented graphically in a simple line plot. The Y axis represents vessel minimal lumen diameter in millimeters, or it could possibly even represent vessel percent diameter stenosis. The X axis represents the arrow of time from left to right, with 3 time points: pre-procedure, immediatel post-procedure, and procedure follow-up (usually 3-6 months).
I created this for free use in the public domain. Author and source: Matt Groesbeck, MPH Piewalker (talk) 02:07, 13 June 2012 (UTC)
Licensing edit
| This file is made available under the Creative Commons CC0 1.0 Universal Public Domain Dedication.
The person who associated a work with this deed has dedicated the work to the public domain by waiving all of his or her rights to the work worldwide under copyright law, including all related and neighboring rights, to the extent allowed by law. You can copy, modify, distribute and perform the work, even for commercial purposes, all without asking permission. |
 | This file is a candidate to be copied to Wikimedia Commons.
Any user may perform this transfer; refer to Wikipedia:Moving files to Commons for details. If this file has problems with attribution, copyright, or is otherwise ineligible for Commons, then remove this tag and DO NOT transfer it; repeat violators may be blocked from editing. Other Instructions
| ||
| |||
File history
Click on a date/time to view the file as it appeared at that time.
| Date/Time | Thumbnail | Dimensions | User | Comment | |
|---|---|---|---|---|---|
| current | 02:07, 13 June 2012 | | 2,579 × 1,635 (95 KB) | Piewalker (talk | contribs) | Conceptual schematic to describe the outcomes of any given vascular procedure intended to increase vessel lumen by vascular interventions, eg, stent grafting, balloon angioplasty, or another intervention. Acute gain, late loss (restenosis), and net gai... |
You cannot overwrite this file.