
Size of this PNG preview of this SVG file: 800 × 510 pixels. Other resolutions: 320 × 204 pixels | 640 × 408 pixels | 1,024 × 653 pixels | 1,280 × 816 pixels | 2,560 × 1,632 pixels | 1,725 × 1,100 pixels.
Original file (SVG file, nominally 1,725 × 1,100 pixels, file size: 1.73 MB)
| This is a file from the Wikimedia Commons. Information from its description page there is shown below. Commons is a freely licensed media file repository. You can help. |
| Description |
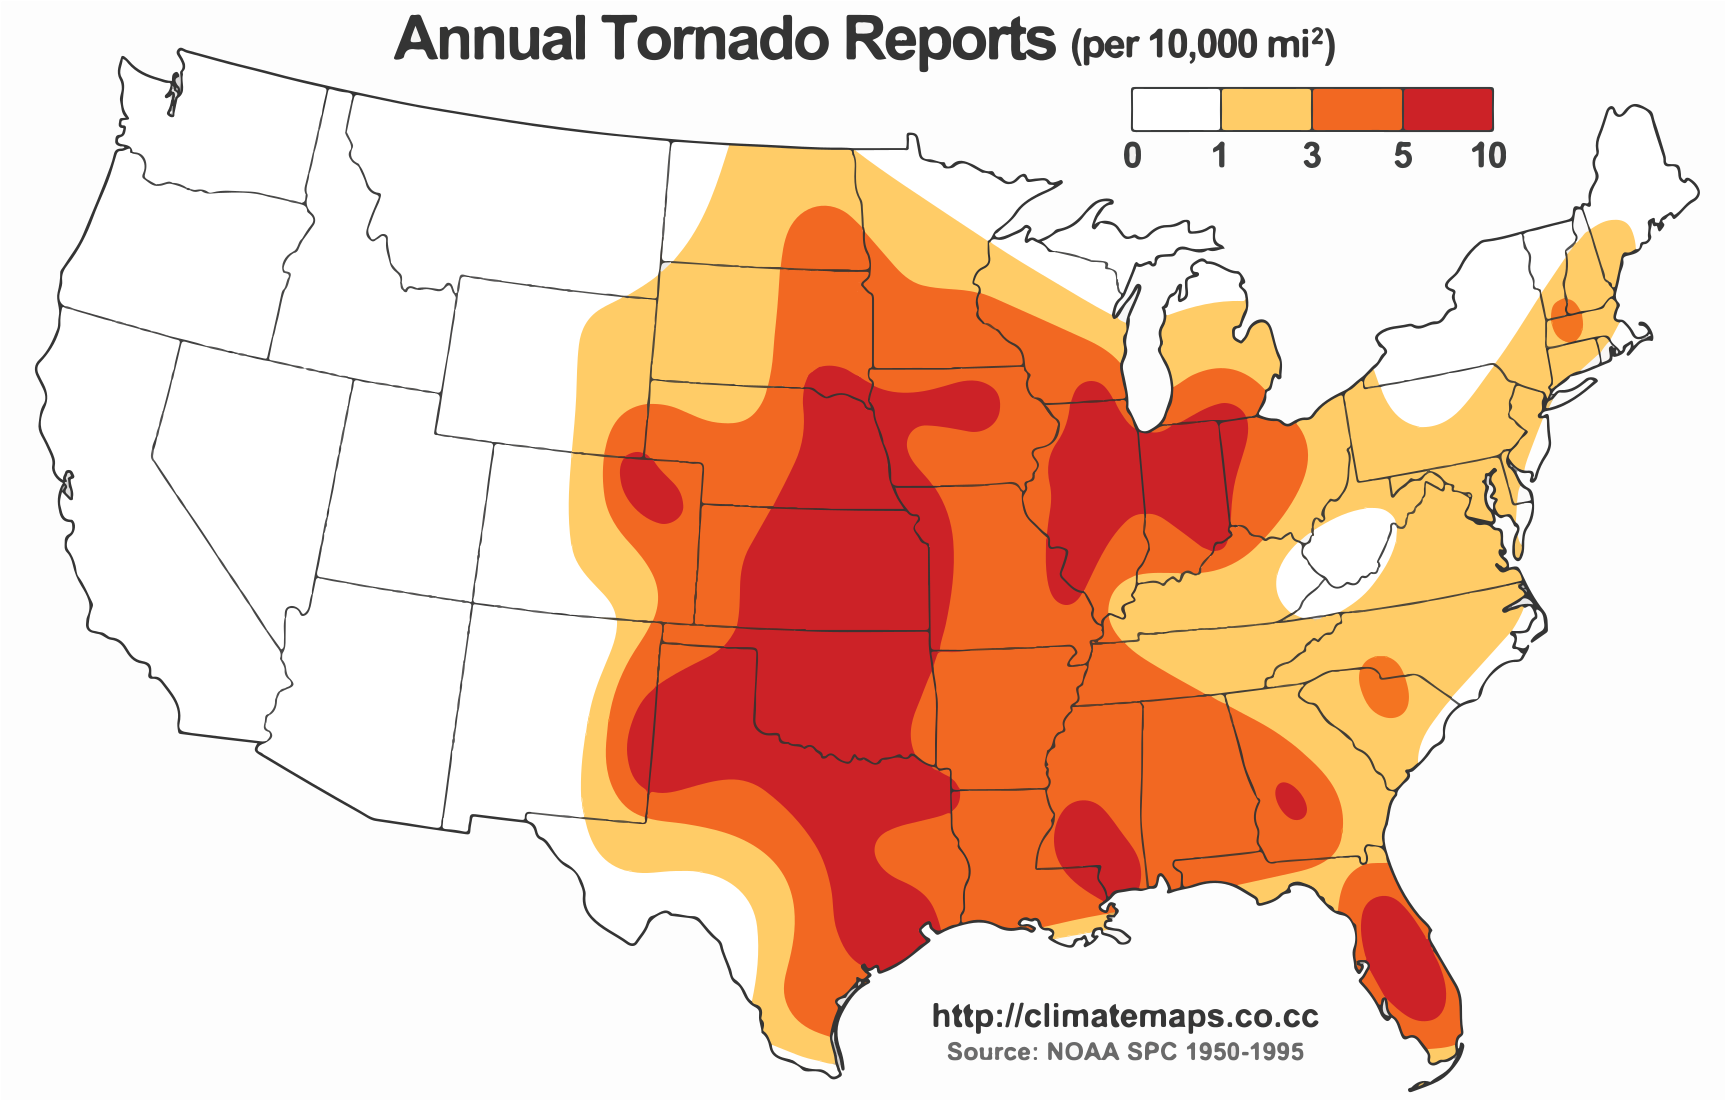
English: This map shows the average annual tornado reports in the United States. The units are displayed as the average number of tornado reports in an area of 10,000 square miles. The scale is based on the following colors.
White: 0-1, Yellow: 1-3, Orange: 3-5, Red: 5-10 All data are based on the Severe Prediction Center 1950-1995 dataset. Map created by Alex Matus - http://climatemaps.co.cc |
| Source | https://en.wikipedia.org/wiki/File:Average_Annual_Tornado_Reports.jpg |
| Author | Mamatus |
| Permission (Reusing this file) |
https://en.wikipedia.org/wiki/File:Average_Annual_Tornado_Reports.jpg |

|
Permission is granted to copy, distribute and/or modify this document under the terms of the GNU Free Documentation License, Version 1.2 or any later version published by the Free Software Foundation; with no Invariant Sections, no Front-Cover Texts, and no Back-Cover Texts. A copy of the license is included in the section entitled GNU Free Documentation License. |
If this file is eligible for relicensing, it may also be used under the Creative Commons Attribution-ShareAlike 3.0 license. The relicensing status of this image has not yet been reviewed. You can help.
|
File history
Click on a date/time to view the file as it appeared at that time.
| Date/Time | Thumbnail | Dimensions | User | Comment | |
|---|---|---|---|---|---|
| current | 14:12, 1 April 2014 | | 1,725 × 1,100 (1.73 MB) | Bojo1498 | {{subst:Upload marker added by en.wp UW}} {{Information |Description = {{en|This map shows the average annual tornado reports in the United States. The units are displayed as the average number of tornado reports in an area of 10,000 square miles. The... |
File usage
The following pages on the English Wikipedia use this file (pages on other projects are not listed):
Global file usage
The following other wikis use this file:
- Usage on es.wikipedia.org
- Usage on uk.wikipedia.org