
Size of this preview: 799 × 101 pixels. Other resolutions: 320 × 40 pixels | 640 × 81 pixels | 5,781 × 731 pixels.
Original file (5,781 × 731 pixels, file size: 1.65 MB, MIME type: image/jpeg)
| This is a file from the Wikimedia Commons. Information from its description page there is shown below. Commons is a freely licensed media file repository. You can help. |
Summary
| Description |
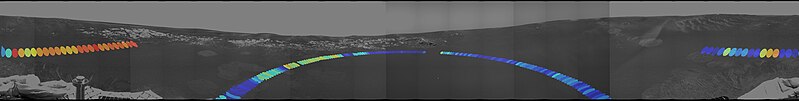
English: This hematite abundance index map helps geologists choose hematite-rich locations to visit around Opportunity's landing site. Blue dots equal areas low in hematite and red dots equal areas high in hematite.
The hematite abundance index map was created using data from the miniature thermal emission instrument. The first layer is a mosaic of panoramic camera images taken prior to egress, when Opportunity was still on the lander. The colored dots represent data collected by the miniature thermal emission spectrometer on sol 11, after Opportunity had rolled off of the lander and the rover was located at the center of the blue semi-circle. The spectrometer is located on the panoramic camera mast. On sol 11, it took a low-angle 180-degree panorama of the area in front of the rover, indicated by the blue shaded dots. The instrument then raised the angle of its field of view a few degrees higher to sweep around behind the rover, indicated by the red and yellow dots offset at the far sides of the image. |
| Date | January 2004 (approximate) |
| Source | http://marsrovers.nasa.gov/gallery/press/opportunity/20040214a.html |
| Author | NASA/JPL/Cornell |
| Permission (Reusing this file) |
PD-USGOV-NASA. |
Licensing
| This file is in the public domain in the United States because it was solely created by NASA. NASA copyright policy states that "NASA material is not protected by copyright unless noted". (See Template:PD-USGov, NASA copyright policy page or JPL Image Use Policy.) | ||
 |
Warnings:
|
Original upload log
The original description page was here. All following user names refer to en.wikipedia.
- 2005-03-22 00:29 Bryan Derksen 5781×731× (1726911 bytes) Putting the full-sized version here, use Wiki markup to make thumbnails as needed
- 2004-02-15 14:07 Sennheiser 646×81× (7039 bytes) This hematite abundance index map helps geologists choose hematite-rich locations to visit around Opportunity's landing site. Blue dots equal areas low in hematite and red dots equal areas high in hematite.
File history
Click on a date/time to view the file as it appeared at that time.
| Date/Time | Thumbnail | Dimensions | User | Comment | |
|---|---|---|---|---|---|
| current | 18:19, 17 December 2011 | 5,781 × 731 (1.65 MB) | File Upload Bot (Magnus Manske) | {{BotMoveToCommons|en.wikipedia|year={{subst:CURRENTYEAR}}|month={{subst:CURRENTMONTHNAME}}|day={{subst:CURRENTDAY}}}} {{Information |Description={{en|This hematite abundance index map helps geologists choose hematite-rich locations to visit around Oppor | |
| 18:19, 17 December 2011 | 5,781 × 731 (1.65 MB) | File Upload Bot (Magnus Manske) | {{BotMoveToCommons|en.wikipedia|year={{subst:CURRENTYEAR}}|month={{subst:CURRENTMONTHNAME}}|day={{subst:CURRENTDAY}}}} {{Information |Description={{en|This hematite abundance index map helps geologists choose hematite-rich locations to visit around Oppor |
File usage
The following pages on the English Wikipedia use this file (pages on other projects are not listed):
Global file usage
The following other wikis use this file:
- Usage on test.wikipedia.org