File:Ghg pie chart Turkey.svg

Original file(SVG file, nominally 576 × 432 pixels, file size: 37 KB)

Summary

Description
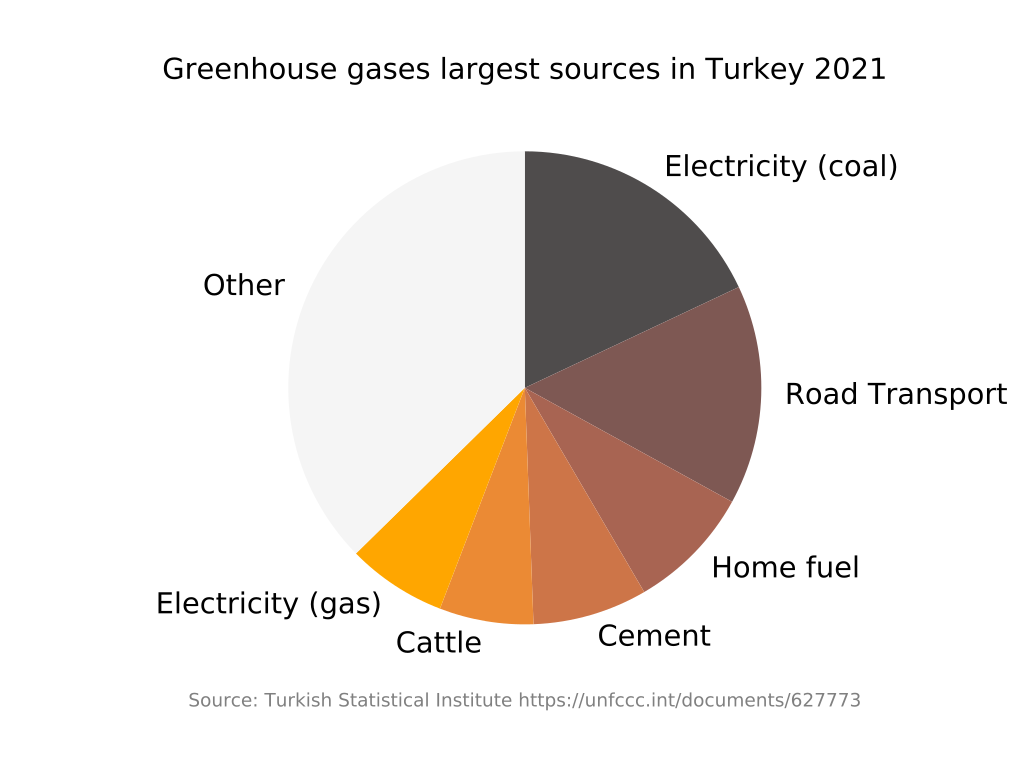
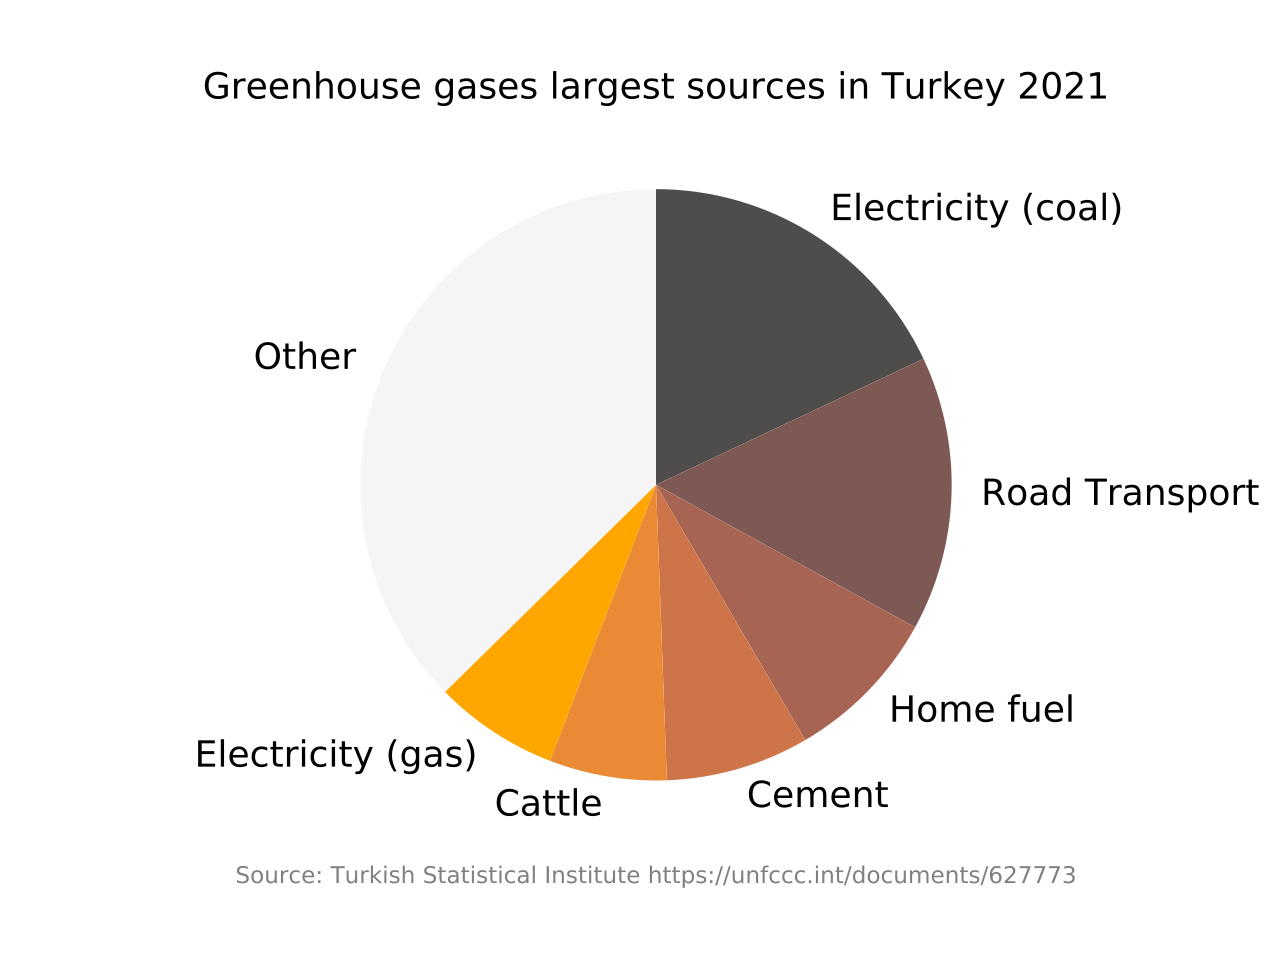
English: Greenhouse gas emissions by Turkey by source with English captions. For details of which spreadsheet cells the data is from see code comments. Turkish version at File:sera_gazlar_dairesel_grafik_Türkiye.svg
Source Own work
Author Chidgk1
SVG development
InfoField
 
The SVG code is valid.
 
This plot was created with Matplotlib.
Source code
InfoField

Python code

Source code
import logging 
# logging.basicConfig(level=logging.INFO) # can be commented out when not debugging

import matplotlib.pyplot as plt
import sys

lang = "en"
#lang = "tr"

#If text changed in future default size may chop off part of text so may need to set size
#fig = plt.figure(figsize=(width, height))
#fig = plt.figure(figsize=(6, 4))
fig = plt.figure()

# Set font size as default was a bit small to read
fontsize = 13

#Get current axes object
ax = fig.gca()

# Global warming potentials (GWP 100) to compare other gases with CO2 -
# from https://www.ipcc.ch/report/ar6/wg1/downloads/report/IPCC_AR6_WGI_Chapter_07_Supplementary_Material.pdf
# 7.SM.6 Tables of greenhouse gas lifetimes, radiative efficiencies and metrics

GWP_CH4 = 27.9
GWP_N2O = 273

data_source = 'https://unfccc.int/documents/627773'
#2021 data from  Turkey. 2023 Common Reporting Format (CRF) Table
#New data yearly so please update above url on 15 April 2024 from https://unfccc.int/process-and-meetings/transparency-and-reporting/reporting-and-review-under-the-convention/greenhouse-gas-inventories-annex-i-parties/national-inventory-submissions-2024
year = "2021"

# TABLE 1.A(a)  SECTORAL BACKGROUND DATA FOR ENERGY sheet 1
# Electricity Generation Solid Fuels
# kt CO2
# Current spreadsheet cell G33 (G26 includes Combined Heat and Power)
Electricity_coal = 101558.02

# Electricity Generation Gaseous Fuels
# G34 (G27 includes Combined Heat and Power)
Electricity_gas = 38456.40

# sheet 3  Road transportation
# G19 (cars have row G27 below but there is no data in it - check next year data when it comes)
Road_transport = 84698.63

# sheet 4  Commercial/institutional energy G16
Work_buildings = 13895.30

# sheet 4  Residential G30
Home_fuel = 48408.50

# TABLE 2(I).A-H sheet 1  SECTORAL BACKGROUND DATA FOR  INDUSTRIAL PROCESSES AND PRODUCT USE
# G10 (cement production)
Cement = 44226.79

# TABLE 3.A SECTORAL BACKGROUND DATA FOR AGRICULTURE F9 Enteric fermentation 1.   Cattle
Cattle_enteric_fermentation = 1091.60 * GWP_CH4 # Convert methane to CO2eq

# TABLE 3.B(a) SECTORAL BACKGROUND DATA FOR AGRICULTURE
# J9 for CH4
# TABLE 3.B(b) SECTORAL BACKGROUND DATA FOR AGRICULTURE
# T10 for N2O
# Manure management 1.    Cattle
Cattle_manure = (144.97 * GWP_CH4) + (6.47 * GWP_N2O) 

Cattle = Cattle_enteric_fermentation + Cattle_manure

# Total without LULUCF from National Inventory Report or elsewhere
total_Mt = 564.4
total = total_Mt * 1000

logging.info('%s Electricity_coal', Electricity_coal)
logging.info('%s Road_transport', Road_transport)
logging.info('%s Home_fuel', Home_fuel)
logging.info('%s Cement', Cement)
logging.info('%s Cattle', Cattle)

Other = total - (Electricity_coal + Road_transport + Cattle + Home_fuel + Cement + Electricity_gas)

#Put in order of size to make easier to compare
percents = [Electricity_coal,    Road_transport, Home_fuel, Cement, Cattle, Electricity_gas, Other]

# From https://learnui.design/tools/data-color-picker.html#palette
colors = ['#4f4c4c', '#7e5853', '#a86452', '#cd7548', '#eb8a34', '#ffa600', 'whitesmoke']
# Or you can use color names like:
#colors = ['peru'               ,'grey'      ,'pink'       ,'lightgrey','orange','khaki'          ,'whitesmoke']


if lang == "en":
 plt.title ("Greenhouse gases largest sources in Turkey " + year, fontsize = fontsize)
 autopct='%1.0f%%' # % sign after number in English
 labels = ['Electricity (coal)','Road Transport','Home fuel','Cement','Cattle','Electricity (gas)','Other']
 data_source = 'Source: Turkish Statistical Institute ' + data_source
elif lang == "tr":
 plt.title (year + " Türkiye'de sera gazı emisyon kaynakları",  fontsize = fontsize)
 autopct='%%%1.0f' # % sign before number in Turkish
 labels = ['Kömürden Elektriği', 'Karayolu Ulaşim',  'Evler',    'Çimento','Sığırlar','Doğalgazdan Elektriği', 'Diğer']
 data_source = 'Kaynak: Türkiye İstatistik Kurumu ' + data_source
else:
 print("Unknown language " + lang)
 sys.exit()
plt.xlabel(data_source, fontsize = 'small', color = 'grey')

ax.pie(percents, labels=labels, textprops={'fontsize': fontsize}, colors=colors, counterclock=False, startangle=90)
# Or if you want percents use below but that also puts % on the "other" slice
#ax.pie(percents, labels=labels, textprops={'fontsize': 10}, colors=colors, autopct=autopct, counterclock=False, startangle=90)

if lang == "en":
 plt.savefig('ghg_pie_chart_Turkey.svg')
elif lang == "tr":
 plt.savefig('sera_gazlar_dairesel_grafik_Türkiye.svg')
else:
 print("Unknown language " + lang)
 sys.exit()  

plt.show()

Licensing

I, the copyright holder of this work, hereby publish it under the following license:
w:en:Creative Commons
attribution share alike
This file is licensed under the Creative Commons Attribution-Share Alike 4.0 International license.
You are free:
  • to share – to copy, distribute and transmit the work
  • to remix – to adapt the work
Under the following conditions:
  • attribution – You must give appropriate credit, provide a link to the license, and indicate if changes were made. You may do so in any reasonable manner, but not in any way that suggests the licensor endorses you or your use.
  • share alike – If you remix, transform, or build upon the material, you must distribute your contributions under the same or compatible license as the original.

Captions

Greenhouse gas emissions by Turkey by source

Items portrayed in this file

depicts

image/svg+xml

File history

Click on a date/time to view the file as it appeared at that time.

Date/TimeThumbnailDimensionsUserComment
current08:18, 15 April 2023Thumbnail for version as of 08:18, 15 April 2023576 × 432 (37 KB)Chidgk1updated to 2021
09:45, 15 April 2022Thumbnail for version as of 09:45, 15 April 2022576 × 432 (39 KB)Chidgk1updated to 2020 and various other changes
06:48, 14 November 2019Thumbnail for version as of 06:48, 14 November 2019576 × 432 (38 KB)Chidgk1Increased font size slightly
06:42, 14 November 2019Thumbnail for version as of 06:42, 14 November 2019576 × 432 (38 KB)Chidgk1increased font size slightly to make more readable
13:12, 19 October 2019Thumbnail for version as of 13:12, 19 October 2019576 × 432 (38 KB)Chidgk1Labels on outside so we can read more easily <code><nowiki> import matplotlib.pyplot as plt # Pie chart labels = 'Electricity (coal)','Road Transport','Agriculture','Cement' ,'Homes','Electricity (gas)','Work buildings','Iron and steel','Waste' ,'Other' sizes = [19, 15, 14, 10, 8, 7, 4, 4, 3, 16] colors = ['peru' ,'grey' ,'pink' ,'lightgrey','orange','lightyellow' ,'khaki' ,'lightblue' ,'lightgreen','whitesmoke'] fig1, ax1 = plt.subplots()...
07:03, 17 April 2019Thumbnail for version as of 07:03, 17 April 2019600 × 467 (78 KB)Chidgk1added waste
17:33, 16 April 2019Thumbnail for version as of 17:33, 16 April 2019600 × 467 (72 KB)Chidgk1Added iron and steel
13:32, 16 April 2019Thumbnail for version as of 13:32, 16 April 2019600 × 467 (63 KB)Chidgk1Updated for 2017 stats just released. Now produced with Google Charts as easier.
06:00, 4 April 2019Thumbnail for version as of 06:00, 4 April 20191,080 × 1,080 (39 KB)Chidgk1Increased font size to 25
06:12, 21 March 2019Thumbnail for version as of 06:12, 21 March 20191,080 × 1,080 (39 KB)Chidgk1User created page with UploadWizard
The following pages on the English Wikipedia use this file (pages on other projects are not listed):

Global file usage

The following other wikis use this file:

Metadata