
Original file (900 × 595 pixels, file size: 82 KB, MIME type: image/png)
| This is a file from the Wikimedia Commons. Information from its description page there is shown below. Commons is a freely licensed media file repository. You can help. |
Summary
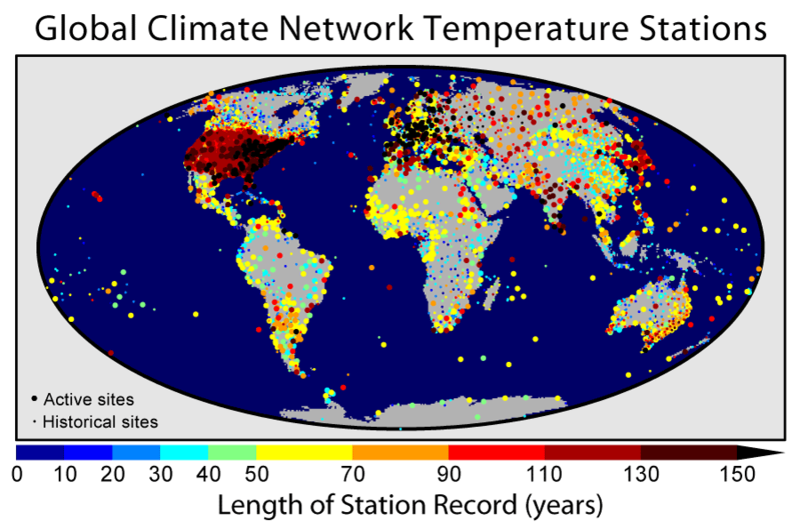
The Global Historical Climatology Network (GHCN) is one of the primary reference compilations of temperature data used for climatology, and is the foundation of the GISTEMP Temperature Record. This map shows the 7,280 fixed temperature stations in the GHCN catalog color coded by the length of the available record. Sites that are actively updated in the database (2,277) are marked as "active" and shown in large symbols, other sites are marked as "historical" and shown in small symbols. In some cases, the "historical" sites are still collecting data but due to reporting and data processing delays (of more than a decade in some cases) they do not contribute to current temperature estimates.
As is evident from this plot, the most densely instrumented portion of the globe is in the United States, while Antarctica is the most sparsely instrumented land area. Parts of the Pacific and other oceans are more isolated from fixed temperature stations, but this is supplemented by volunteer observing ships that record temperature information during their normal travels. This image shows 3,832 records longer than 50 years, 1,656 records longer than 100 years, and 226 records longer than 150 years. The longest record in the collection began in Berlin in 1701 and is still collected in the present day.
References
- Vose, R. S., Richard L. Schmoyer, Peter M. Steurer, Thomas C. Peterson, Richard Heim, Thomas R. Karl, and J. Eischeid (1992). The Global Historical Climatology Network: long-term monthly temperature, precipitation, sea level pressure, and station pressure data. Oak Ridge, Tennessee: Carbon Dioxide Information Analysis Center, Oak Ridge National Laboratory.
- Peterson, Thomas C. and Russell S. Vose (1997). "An overview of the Global Historical Climatology Network temperature data base". Bulletin of the American Meteorological Society 78: 2837-2849.
- Jones, P.D. and A. Moberg (2003). "Hemispheric and large-scale surface air temperature variations: An extensive revision and an update to 2001". Journal of Climate 16: 206-223.
Licensing
This figure was created by Robert A. Rohde from published data and is incorporated into the Global Warming Art project.

|
Permission is granted to copy, distribute and/or modify this document under the terms of the GNU Free Documentation License, Version 1.2 or any later version published by the Free Software Foundation; with no Invariant Sections, no Front-Cover Texts, and no Back-Cover Texts. A copy of the license is included in the section entitled GNU Free Documentation License. |
| This file is licensed under the Creative Commons Attribution-Share Alike 3.0 Unported license. | ||
| ||
| This licensing tag was added to this file as part of the GFDL licensing update. |
File history
Click on a date/time to view the file as it appeared at that time.
| Date/Time | Thumbnail | Dimensions | User | Comment | |
|---|---|---|---|---|---|
| current | 10:16, 10 May 2007 | | 900 × 595 (82 KB) | Nils Simon | {{Information |Description= |Source= |Date= |Author= |Permission= |other_versions= }} |
File usage
Global file usage
The following other wikis use this file:
- Usage on ar.wikipedia.org
- Usage on ca.wikipedia.org
- Usage on de.wikipedia.org
- Usage on ha.wikipedia.org
- Usage on ig.wikipedia.org
- Usage on ms.wikipedia.org
- Usage on vi.wikipedia.org