
Size of this PNG preview of this SVG file: 720 × 450 pixels. Other resolutions: 320 × 200 pixels | 640 × 400 pixels | 1,024 × 640 pixels | 1,280 × 800 pixels | 2,560 × 1,600 pixels.
Original file (SVG file, nominally 720 × 450 pixels, file size: 111 KB)
| This is a file from the Wikimedia Commons. Information from its description page there is shown below. Commons is a freely licensed media file repository. You can help. |
Summary
| Description |
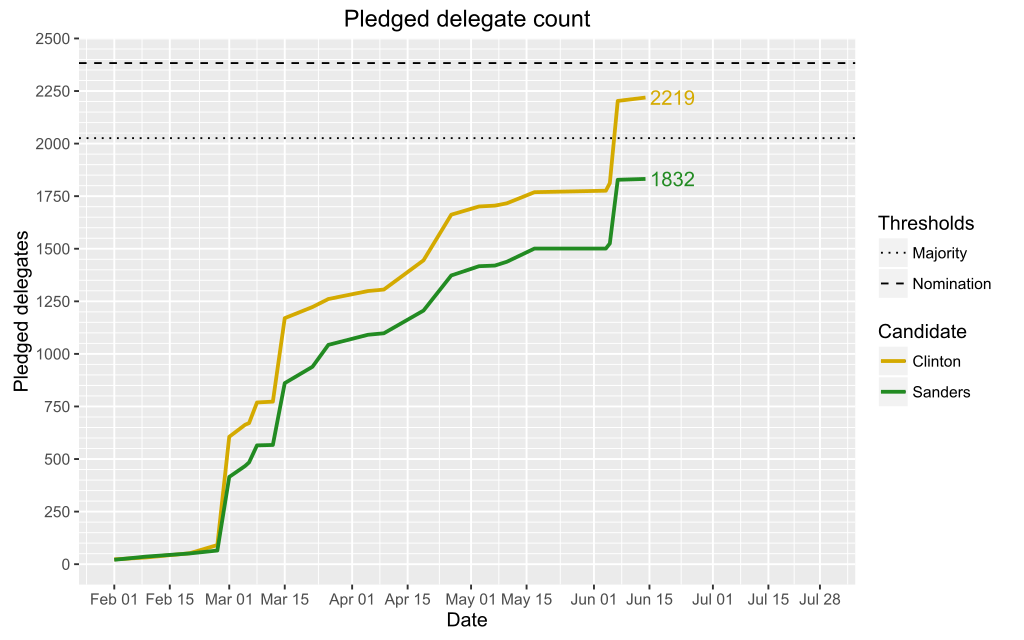
English: Delegate count for the 2016 Democratic Party presidential primaries. Graph may not reflect the latest developments. Graph generated with an R script. |
| Date | |
| Source | Own work |
| Author | Abjiklam |
Licensing
I, the copyright holder of this work, hereby publish it under the following license:
This file is licensed under the Creative Commons Attribution-Share Alike 4.0 International license.
- You are free:
- to share – to copy, distribute and transmit the work
- to remix – to adapt the work
- Under the following conditions:
- attribution – You must give appropriate credit, provide a link to the license, and indicate if changes were made. You may do so in any reasonable manner, but not in any way that suggests the licensor endorses you or your use.
- share alike – If you remix, transform, or build upon the material, you must distribute your contributions under the same or compatible license as the original.
Code
The graph is generated by the following R script:
library(RCurl)
library(reshape)
library(htmltab)
library(ggplot2)
library(scales)

#get the table from the url
theurl <- getURL("https://en.wikipedia.org/wiki/Template:2016USDem", ssl.verifyPeer=FALSE)
table <- htmltab(theurl)

#keep only the useful columns and name them
df <- table[, c(1, 2, 9, 12)]
names(df) <- c("Date", "State", "Clinton", "Sanders")

#transform strings into dates and numbers
df$Date = as.Date(substr(df[, 1], 9, 18))
for (i in 3:4) {
  df[, i] = as.numeric(df[, i])
}
df = na.omit(df)

#set up two data frames:
#df2 has the delegates won per candidate and per date
#df3 has the cumulatative delegate count per candidate and per date
df2 <- data.frame(Date=unique(df$Date))
df3 <- df2
for (i in 3:dim(df)[2]) {
  df2[[names(df)[i]]] = rep(NA, length(df2$Date))
  df3[[names(df)[i]]] = rep(NA, length(df2$Date))
  for (j in 1:length(df2$Date)) {
    df2[[names(df)[i]]][j] = sum(subset(df, Date==df2$Date[j])[[names(df)[i]]], na.rm=TRUE)
    df3[[names(df)[i]]][j] = sum(df2[[names(df)[i]]][1:j], na.rm=TRUE)
  }
}

#reshape data so that candidate becomes a variable
mdata <- melt(df2, id=c("Date"))
mdata2 <- melt(df3, id=c("Date"))
names(mdata) <- c("Date", "Candidate", "Delegates")
mdata[["Cumulative"]] <- mdata2[, 3]

#remove rows with N/A
results <- na.omit(mdata)

#dataframe for last result to be displayed as number
lastresult = subset(results, Date==results$Date[nrow(results)])

#nomination threshold
nomination <- data.frame(yintercept=c(2383, 2026),
                         name=c("Nomination", "Majority"))

#Clinton is gold, Sanders is green
colors <- c("#D4AA00", "#228b22")

#generate plot
d <- ggplot(results, aes(x=Date, y=Cumulative, group=Candidate, colour=Candidate)) +
  geom_hline(aes(yintercept=yintercept, linetype=name), data=nomination, show.legend=TRUE) +
  geom_path(size=1) +
  scale_color_manual(values=colors) +
  scale_y_continuous(breaks=seq(0, 2500, 250), minor_breaks=seq(0, 2500, 50)) +
  scale_x_date(limits=c(as.Date("2016/2/1"), as.Date("2016/7/28")),
               breaks=sort(c(seq(as.Date("2016/2/1"), as.Date("2016/7/28"), "month"),
                             seq(as.Date("2016/2/15"), as.Date("2016/7/28"), "month"),
                             as.Date("2016/7/28"))),
               labels=date_format("%b %d")) +
  scale_linetype_manual(values=c("dotted", "dashed")) +
  labs(x="Date", y="Pledged delegates", title="Pledged delegate count", linetype="Thresholds") +
  geom_text(data=lastresult, show.legend=F,
            aes(x=Date, y=Cumulative, label=Cumulative), size=4, hjust=-0.1) +
  theme(plot.background = element_rect(fill="transparent",colour = NA)) +
  theme(legend.background = element_rect(fill="transparent",colour = NA))

#display plot
svg(filename="count.svg",
    width=8,
    height=5,
    pointsize=12,
    bg="transparent")
d
dev.off()
File history
Click on a date/time to view the file as it appeared at that time.
| Date/Time | Thumbnail | Dimensions | User | Comment | |
|---|---|---|---|---|---|
| current | 21:57, 15 June 2016 | | 720 × 450 (111 KB) | Χ | uupdate |
| 21:57, 8 June 2016 |  | 720 × 450 (110 KB) | Χ | update | |
| 14:40, 22 May 2016 |  | 720 × 450 (123 KB) | Χ | update | |
| 15:35, 19 May 2016 |  | 720 × 450 (122 KB) | Χ | error in code | |
| 15:34, 19 May 2016 |  | 720 × 450 (127 KB) | Χ | update | |
| 16:46, 11 May 2016 |  | 720 × 450 (122 KB) | Double Schiara | Update 11 May | |
| 19:29, 28 April 2016 |  | 720 × 450 (122 KB) | Χ | update | |
| 13:59, 27 April 2016 |  | 720 × 450 (122 KB) | Χ | update | |
| 22:17, 21 April 2016 |  | 630 × 450 (103 KB) | Χ | NY | |
| 13:55, 11 April 2016 |  | 630 × 450 (101 KB) | Χ | minor changes |
File usage
The following pages on the English Wikipedia use this file (pages on other projects are not listed):
Global file usage
The following other wikis use this file:
- Usage on sv.wikipedia.org