Size of this preview: 800 × 434 pixels. Other resolutions: 320 × 174 pixels | 640 × 347 pixels | 1,196 × 649 pixels.
Original file (1,196 × 649 pixels, file size: 29 KB, MIME type: image/png)
| This is a file from the Wikimedia Commons. Information from its description page there is shown below. Commons is a freely licensed media file repository. You can help. |
Summary
| Description |
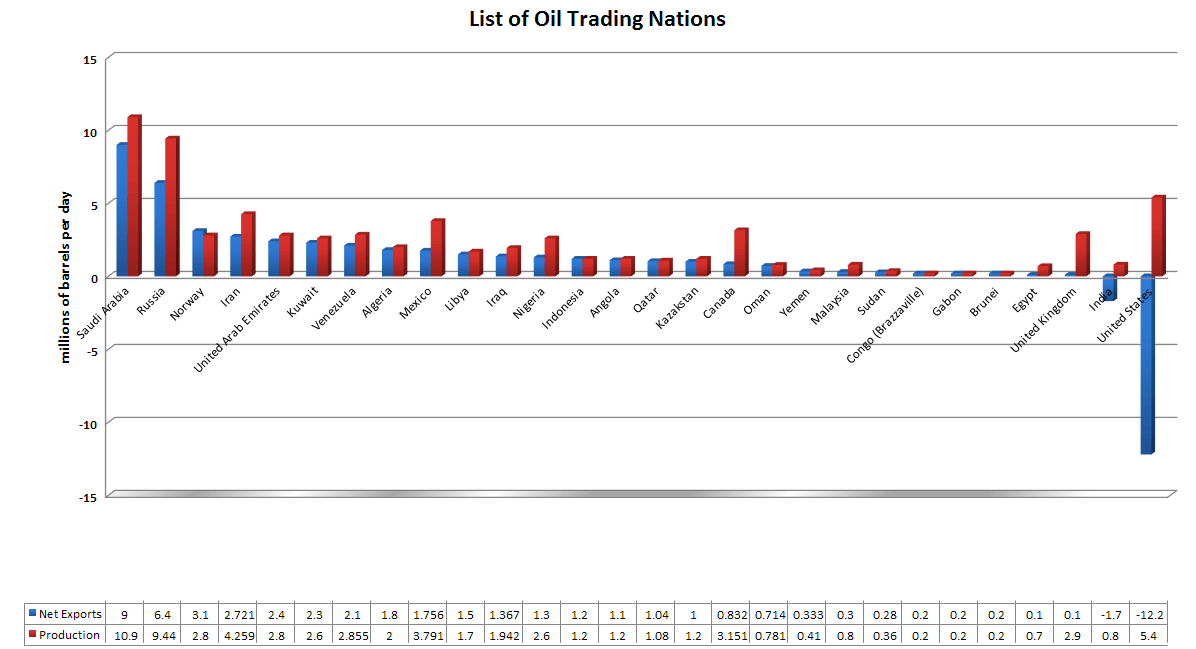
Chart from data taken from http://en.wikipedia.org/wiki/List_of_Oil_Trading_Nations Note: There has been a mistake in the Norwegian data taken into this diagram, as it shows Norway exporting more oil than it produced. China is conspicuously missing, and all the information is badly outdated (2006). Update needed! |
| Date | 21 November 2014 (original upload date) |
| Source | No machine-readable source provided. Own work assumed (based on copyright claims). |
| Author | No machine-readable author provided. GifTagger assumed (based on copyright claims). |
Licensing
| I, the copyright holder of this work, release this work into the public domain. This applies worldwide. In some countries this may not be legally possible; if so: I grant anyone the right to use this work for any purpose, without any conditions, unless such conditions are required by law. |
Original upload log
| Date/Time | Dimensions | User | Comment |
|---|---|---|---|
| 14 August 2006, 21:30:37 | 1196 × 649 (35147 bytes) | Muhaidib (talk · contribs) | Chart from data taken from http://en.wikipedia.org/wiki/List_of_Oil_Trading_Nations |
File history
Click on a date/time to view the file as it appeared at that time.
| Date/Time | Thumbnail | Dimensions | User | Comment | |
|---|---|---|---|---|---|
| current | 11:18, 21 November 2014 | | 1,196 × 649 (29 KB) | GifTagger | Bot: Converting file to superior PNG file. (Source: Chart-of-Oil-Trading-Nation.gif). This GIF was problematic due to non-greyscale color table. |
File usage
No pages on the English Wikipedia use this file (pages on other projects are not listed).
Global file usage
The following other wikis use this file:
- Usage on bg.wikipedia.org
- Usage on da.wikipedia.org
- Usage on fa.wikipedia.org
- Usage on hy.wikipedia.org
- Usage on ja.wikipedia.org
- Usage on mzn.wikipedia.org
- Usage on pnb.wikipedia.org
- Usage on ro.wikipedia.org
- Usage on te.wikipedia.org
- Usage on uk.wikipedia.org
- Usage on ur.wikipedia.org
- Usage on vi.wikipedia.org