File:Carbon dioxide pressure-temperature phase diagram-fr.svg

Original file(SVG file, nominally 742 × 700 pixels, file size: 25 KB)

Summary

Description
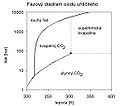
Français : Relation pression-température du dioxyde de carbone
English: Phase diagram of CO2 (carbon dioxide). X axis is temperature in kelvin; Y axis is pressure in bar.
Esperanto: Premo-temperatura fazodiagramo de karbona duoksido
Italiano: Diagramma di stato dell'anidride carbonica
Português: Diagrama de fase pressão-temperatura do dióxido de carbono
Date
Source File:Carbon dioxide pressure-temperature phase diagram.svg
Author Ben Finney, Mark Jacobs
Other versions

[edit]


.svg:

.jpg:

.png:


File:Carbon_dioxide_pressure-temperature_phase_diagram-en.svg

Licensing

Creative Commons CC-Zero This file is made available under the Creative Commons CC0 1.0 Universal Public Domain Dedication.
The person who associated a work with this deed has dedicated the work to the public domain by waiving all of their rights to the work worldwide under copyright law, including all related and neighboring rights, to the extent allowed by law. You can copy, modify, distribute and perform the work, even for commercial purposes, all without asking permission.

Captions

Add a one-line explanation of what this file represents

Items portrayed in this file

depicts

4 January 2012

image/svg+xml

e8ec41a23ae221cc411ddd0cef0b69f966382185

25,647 byte

700 pixel

742 pixel

File history

Click on a date/time to view the file as it appeared at that time.

Date/TimeThumbnailDimensionsUserComment
current21:36, 5 November 2018Thumbnail for version as of 21:36, 5 November 2018742 × 700 (25 KB)SémhurMise à jour pour montrer qu'il n'y a pas de frontière entre phase liquide/gazeuse et état supercritique. Cf. fr:Discussion:Fluide supercritique#Diagramme erroné
19:24, 4 January 2012Thumbnail for version as of 19:24, 4 January 2012742 × 700 (28 KB)Fylip22
The following pages on the English Wikipedia use this file (pages on other projects are not listed):

Global file usage

Metadata