
Size of this preview: 800 × 450 pixels. Other resolutions: 320 × 180 pixels | 640 × 360 pixels | 1,024 × 576 pixels.
Original file (1,024 × 576 pixels, file size: 70 KB, MIME type: image/jpeg)
| This is a file from the Wikimedia Commons. Information from its description page there is shown below. Commons is a freely licensed media file repository. You can help. |
Summary
| Description |
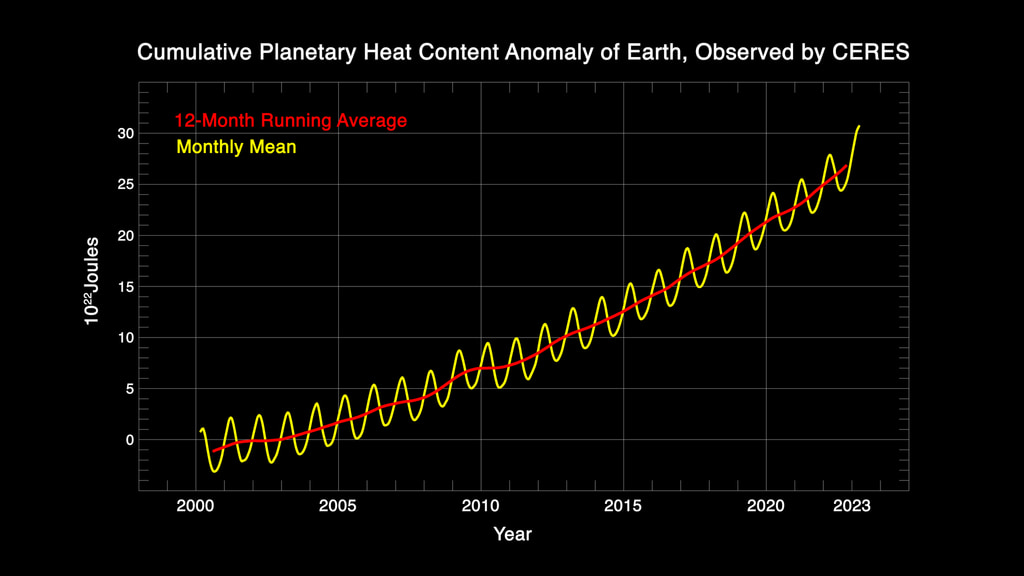
English: Graph shows the cumulative monthly mean and 12-month running averages of Earth's net uptake of heat since year 2000. These are calculated based on more frequent changes in the planet's global radiative energy imbalance as measured by NASA's orbiting CERES project instruments. See Fassulo and Trenberth for discussion of the oscillations at monthly resolution. .Image credit: NASA's Scientific Visualization Studio; Trent L. Schindler (Visualizer); Denise Lineberry (Writer); Norman Loeb (Scientist); Jonathan Gleason (Producer) More information:
|
| Date | |
| Source | https://svs.gsfc.nasa.gov/vis/a000000/a005100/a005173/planetary_heat_anomaly.1800_print.jpg |
| Author | NASA's Scientific Visualization Studio |
Licensing
| This file is in the public domain in the United States because it was solely created by NASA. NASA copyright policy states that "NASA material is not protected by copyright unless noted". (See Template:PD-USGov, NASA copyright policy page or JPL Image Use Policy.) | ||
 |
Warnings:
|
File history
Click on a date/time to view the file as it appeared at that time.
| Date/Time | Thumbnail | Dimensions | User | Comment | |
|---|---|---|---|---|---|
| current | 15:21, 2 November 2023 | | 1,024 × 576 (70 KB) | Bikesrcool | Uploaded a work by NASA's Scientific Visualization Studio from https://svs.gsfc.nasa.gov/vis/a000000/a005100/a005173/planetary_heat_anomaly.1800_print.jpg with UploadWizard |
File usage
The following pages on the English Wikipedia use this file (pages on other projects are not listed):