Size of this preview: 800 × 568 pixels. Other resolutions: 320 × 227 pixels | 640 × 454 pixels | 1,024 × 727 pixels | 1,240 × 880 pixels.
Original file (1,240 × 880 pixels, file size: 86 KB, MIME type: image/png)
File history
Click on a date/time to view the file as it appeared at that time.
| Date/Time | Thumbnail | Dimensions | User | Comment | |
|---|---|---|---|---|---|
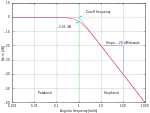
| current | 17:45, 23 July 2005 |  | 1,240 × 880 (86 KB) | Omegatron | split the cutoff frequency markers |
| 16:31, 23 July 2005 |  | 1,250 × 880 (92 KB) | Omegatron | Better butterworth filter response curve | |
| 19:54, 26 June 2005 |  | 250 × 220 (2 KB) | Omegatron | A graph or diagram made by User:Omegatron. (Uploaded with Wikimedia Commons.) Source: Created by User:Omegatron {{GFDL}}{{cc-by-sa-2.0}} Category:Diagrams\ |
File usage
No pages on the English Wikipedia use this file (pages on other projects are not listed).
Global file usage
The following other wikis use this file:
- Usage on be-tarask.wikipedia.org
- Usage on de.wikipedia.org
- Usage on eo.wikipedia.org
- Usage on et.wikipedia.org
- Usage on fr.wikipedia.org
- Usage on hi.wikipedia.org
- Usage on it.wikipedia.org
- Usage on ja.wikipedia.org
- Usage on pl.wikipedia.org
- Usage on pt.wikipedia.org
- Usage on zh.wikipedia.org


