Size of this preview: 636 × 599 pixels. Other resolutions: 255 × 240 pixels | 509 × 480 pixels | 815 × 768 pixels | 1,040 × 980 pixels.
Original file (1,040 × 980 pixels, file size: 29 KB, MIME type: image/png)
| This is a file from the Wikimedia Commons. Information from its description page there is shown below. Commons is a freely licensed media file repository. You can help. |

|
File:Annual world greenhouse gas emissions, in 2005, by sector.svg is a vector version of this file. It should be used in place of this PNG file when not inferior.
File:Annual world greenhouse gas emissions, in 2005, by sector.png → File:Annual world greenhouse gas emissions, in 2005, by sector.svg
For more information, see Help:SVG. |
 |
Summary
| Description |
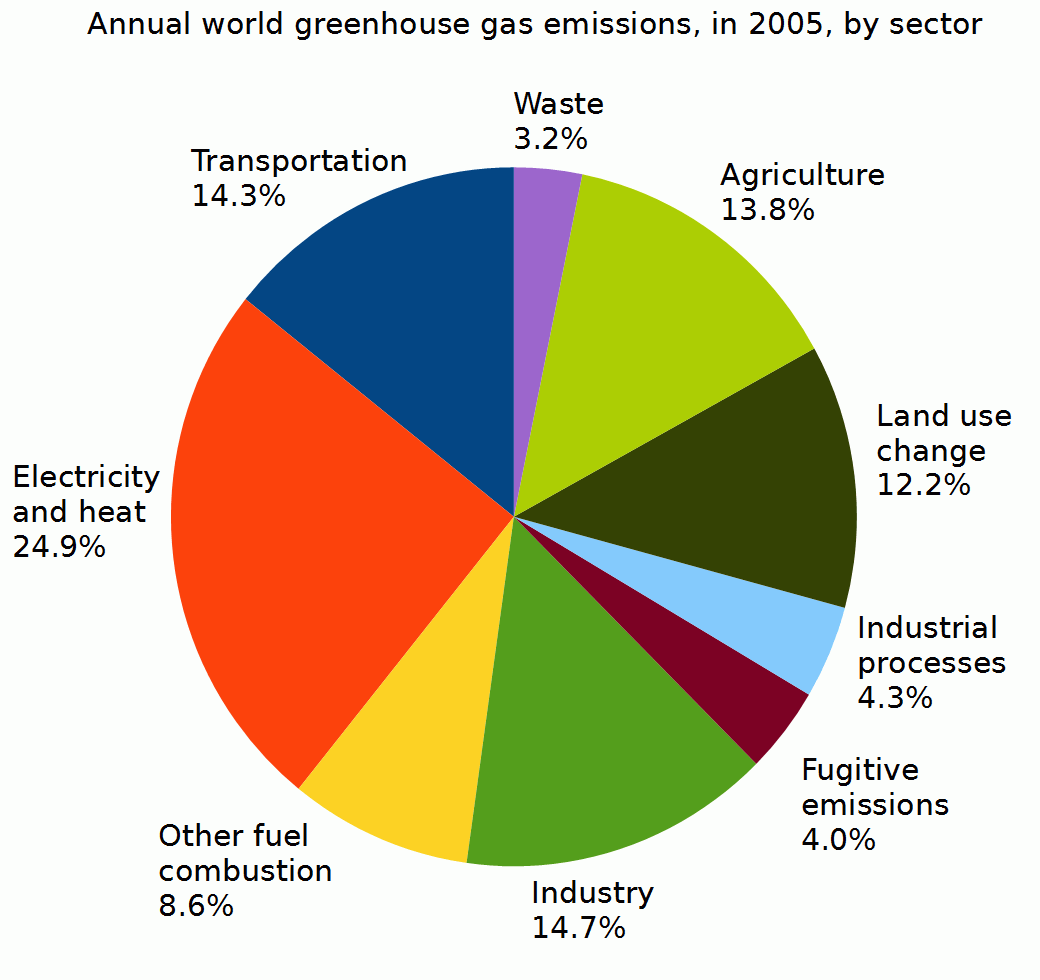
English: This pie chart shows annual world greenhouse gas emissions, in 2005, by sector. Emissions are measured as a percentage of total world carbon dioxide equivalent emissions:
Emissions due to land-use change include both emissions and absorptions (i.e., processes that both add to and remove carbon from the atmosphere). Emissions due to land-use change are highly uncertain. References:
|
| Date | |
| Source | Own work |
| Author | Enescot |
Data
Data from Herzog (2009) are given below as comma-separated values (CSV). The data were exported from OpenOffice 3.4.1 Calc using the following options (enclosed in braces): Character set: {Western Europe (Windows-1252/WinLatin}; Field delimiter: {,}; text delimiter: {"}.
,,
,,
,Sector,Percentage
,Transportation,14.3
,Electricity and heat,24.9
,Other fuel combustion,8.6
,Industry,14.7
,Fugitive emissions,4
,Industrial processes,4.3
,Land use change,12.2
,Agriculture,13.8
,Waste,3.2
Licensing
I, the copyright holder of this work, hereby publish it under the following license:
| This file is made available under the Creative Commons CC0 1.0 Universal Public Domain Dedication. | |
| The person who associated a work with this deed has dedicated the work to the public domain by waiving all of their rights to the work worldwide under copyright law, including all related and neighboring rights, to the extent allowed by law. You can copy, modify, distribute and perform the work, even for commercial purposes, all without asking permission.
|
File history
Click on a date/time to view the file as it appeared at that time.
| Date/Time | Thumbnail | Dimensions | User | Comment | |
|---|---|---|---|---|---|
| current | 05:43, 24 November 2012 | | 1,040 × 980 (29 KB) | Enescot | {{Information |Description ={{en|1=This pie chart shows annual world greenhouse gas emissions, in 2005, by sector. Emissions are measured as a percentage of total world carbon dioxide equivalent emissions: *Electricity and heat, 24.9% *Industry, 14.... |
File usage
The following pages on the English Wikipedia use this file (pages on other projects are not listed):