The 1882 Canadian federal election was held on June 20, 1882, to elect members of the House of Commons of Canada of the 5th Parliament of Canada.
| |||||||||||||||||||||||||||||||||||||
211 seats in the House of Commons 106 seats needed for a majority | |||||||||||||||||||||||||||||||||||||
|---|---|---|---|---|---|---|---|---|---|---|---|---|---|---|---|---|---|---|---|---|---|---|---|---|---|---|---|---|---|---|---|---|---|---|---|---|---|
| Turnout | 70.3%[1] ( | ||||||||||||||||||||||||||||||||||||
| |||||||||||||||||||||||||||||||||||||
 1882 Canadian electoral map | |||||||||||||||||||||||||||||||||||||
 The Canadian parliament after the 1882 election | |||||||||||||||||||||||||||||||||||||
| |||||||||||||||||||||||||||||||||||||
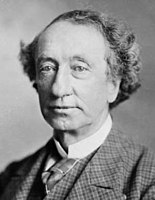
Prime Minister Sir John A. Macdonald's Conservatives and Liberal-Conservatives retained power, defeating the Liberal Party of Edward Blake.
National results
edit| Party | Party leader | # of candidates |
Seats | Popular vote | |||||
|---|---|---|---|---|---|---|---|---|---|
| 1878 | Elected | Change | # | % | Change | ||||
| Conservative | John A. Macdonald | 118 | 83 | 94 | +13.3% | 143,684 | 27.83% | -1.67pp | |
| Liberal-Conservative | 50 | 46 | 39 | -8.7% | 64,860 | 12.56% | -3.22pp | ||
| Liberal | Edward Blake | 112 | 57 | 73 | +26.3% | 160,547 | 31.10% | +1.95pp | |
| Independent | 7 | 5 | 1 | -80% | 8,227 | 1.59% | -1.12pp | ||
| Nationalist Conservative | 1 | - | 1 | - | 1,084 | 0.21% | +0.14pp | ||
| Independent Liberal | 3 | 2 | 2 | - | 5,740 | 1.11% | +0.12pp | ||
| Independent Conservative | 2 | 2 | 1 | -50% | 927 | 0.18% | - | ||
| Unknown | 121 | 9 | - | -100% | 131,178 | 25.41% | +4.48pp | ||
| Total | 414 | 204 | 211 | +4.4% | 516,247 | 100.0% | - | ||
| Sources: http://www.elections.ca -- History of Federal Ridings since 1867 Archived 2008-12-04 at the Wayback Machine | |||||||||
Acclamations:
The following Members of Parliament were elected by acclamation;
- British Columbia: 2 Liberal-Conservatives
- Manitoba: 1 Conservative
- Ontario: 2 Conservatives
- Quebec: 11 Conservatives, 1 Independent Conservative, 4 Liberal-Conservatives, 3 Liberals
- New Brunswick: 1 Liberal-Conservative, 1 Independent
- Nova Scotia: 1 Conservative
Results by province
edit| Party name | BC | MB | ON | QC | NB | NS | PE | Total | ||
|---|---|---|---|---|---|---|---|---|---|---|
| Conservative | Seats: | 3 | 2 | 39 | 38 | 4 | 8 | - | 94 | |
| Popular vote (%): | 38.4 | 13.6 | 27.0 | 37.7 | 25.6 | 23.0 | 17.1 | 27.8 | ||
| Liberal-Conservative | Seats: | 3 | 1 | 13 | 12 | 3 | 5 | 2 | 39 | |
| Vote (%): | 15.8 | 38.9 | 9.1 | 10.4 | 7.1 | 25.8 | 25.4 | 12.6 | ||
| Liberal | Seats: | - | 2 | 40 | 12 | 7 | 8 | 4 | 73 | |
| Vote (%): | 10.6 | 25.3 | 31.9 | 21.5 | 36.8 | 38.7 | 40.7 | 31.1 | ||
| Independent | Seats: | - | - | 1 | - | 1 | ||||
| Vote (%): | 1.7 | 0.8 | 0.4 | 4.8 | 1.6 | |||||
| Nationalist Conservative | Seats: | 1 | 1 | |||||||
| Vote (%): | 1.0 | 0.2 | ||||||||
| Independent Liberal | Seats: | - | 1 | 1 | 2 | |||||
| Vote (%): | 0.7 | 1.5 | 6.2 | 1.1 | ||||||
| Independent Conservative | Seats: | 1 | 1 | |||||||
| Vote (%): | 0.9 | 0.2 | ||||||||
| Unknown | Vote (%): | 35.2 | 22.2 | 29.6 | 27.1 | 23.9 | 7.7 | 16.8 | 25.4 | |
| Total seats | 6 | 5 | 92 | 65 | 16 | 21 | 6 | 211 | ||
See also
editNotes
editReferences
edit- ^ "Voter Turnout at Federal Elections and Referendums". Elections Canada. Retrieved March 10, 2019.

